. 2015 Mar 23;10(3):e0120296.
doi: 10.1371/journal.pone.0120296. eCollection 2015.

Genome-wide transcript profiling reveals novel breast cancer-associated intronic sense RNAs

Affiliations

Genome-wide transcript profiling reveals novel breast cancer-associated intronic sense RNAs

Sang Woo Kim et al. PLoS One. .

Abstract

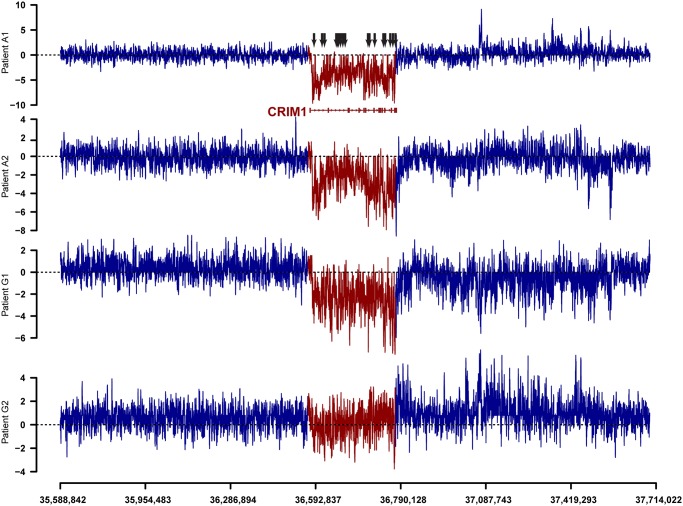
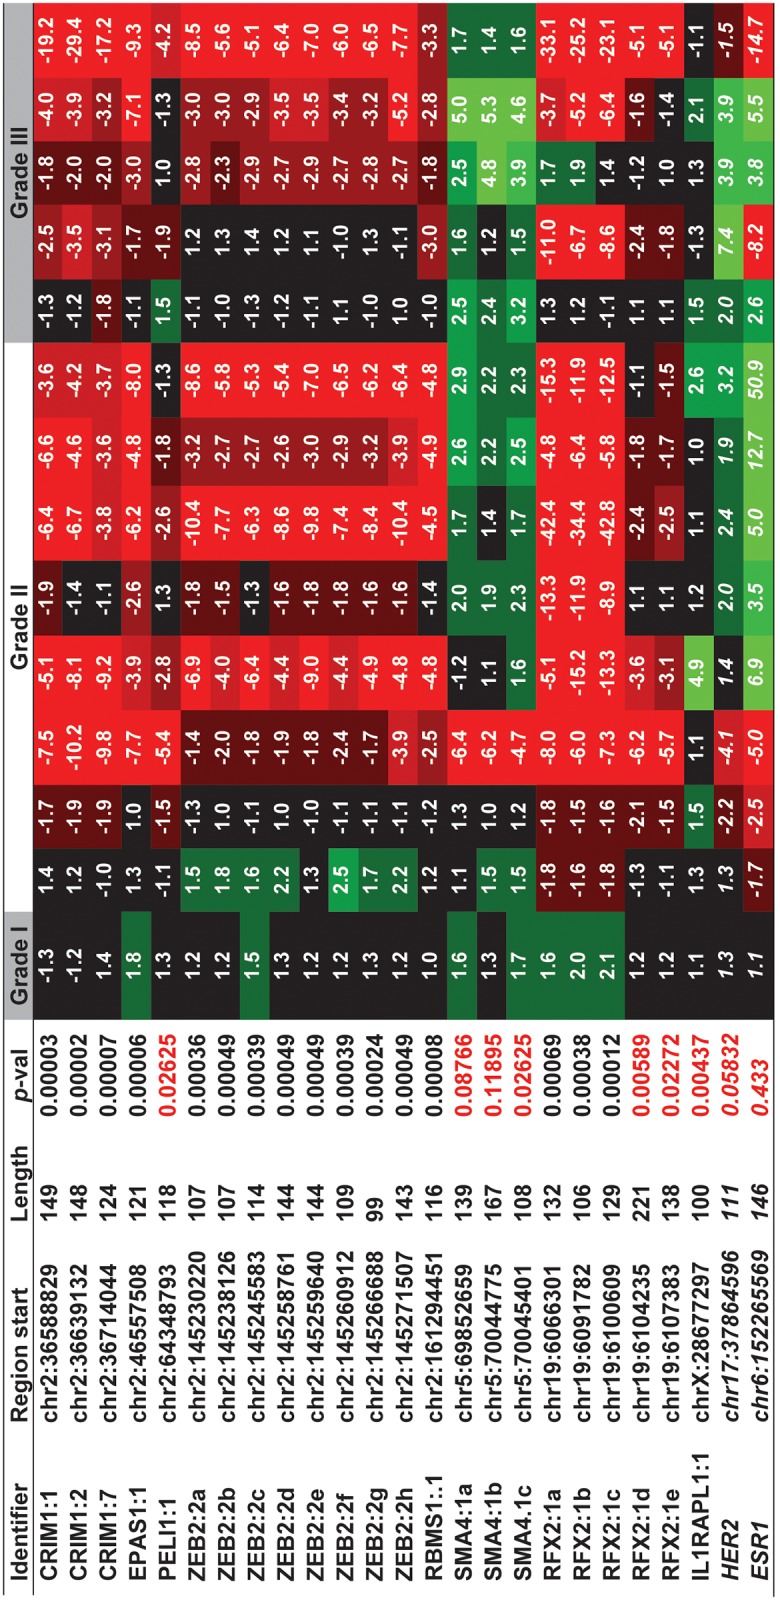
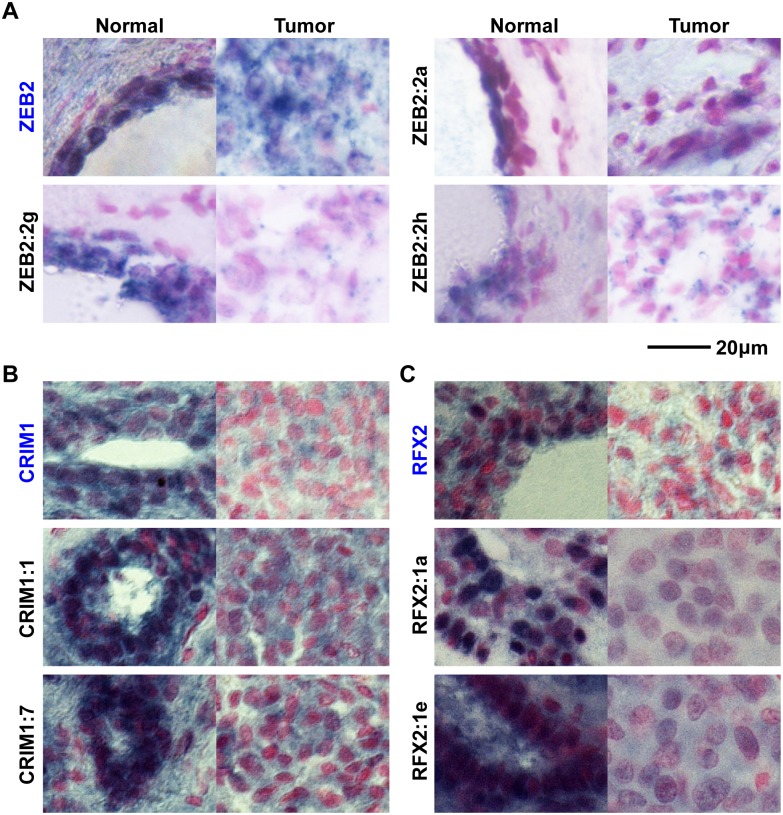
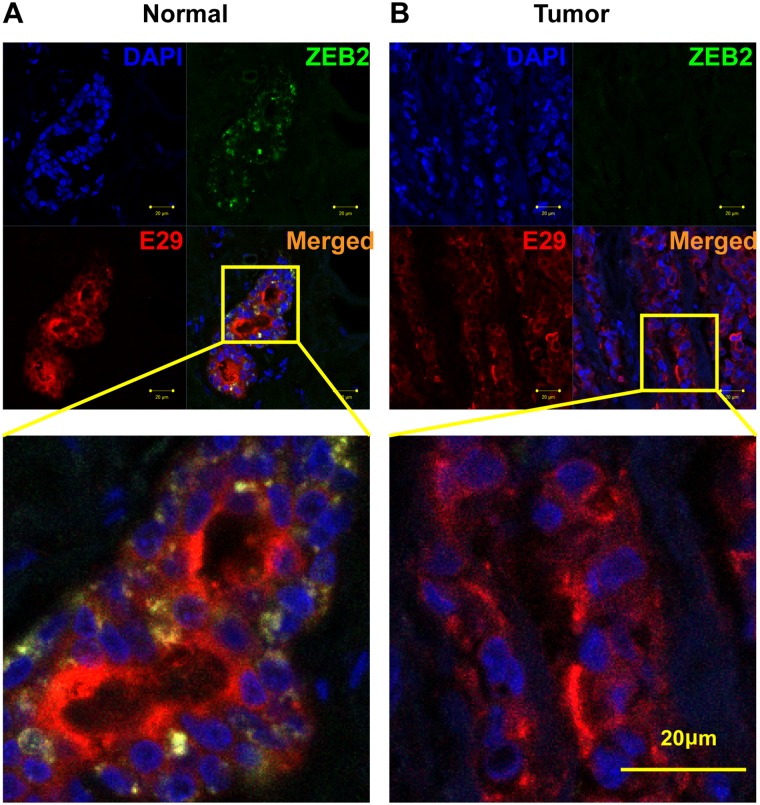
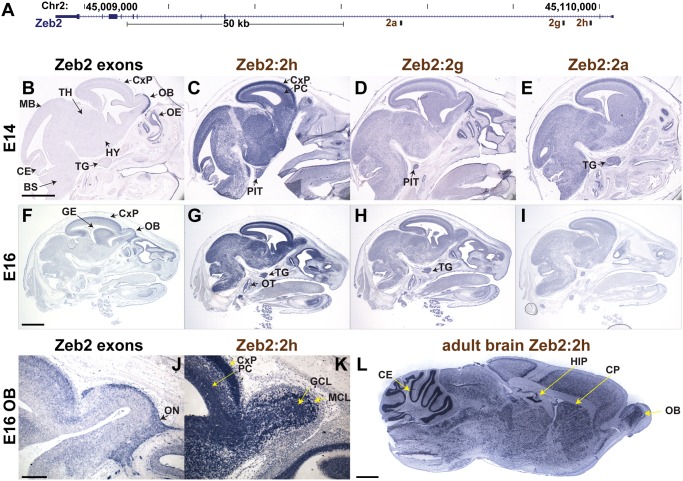
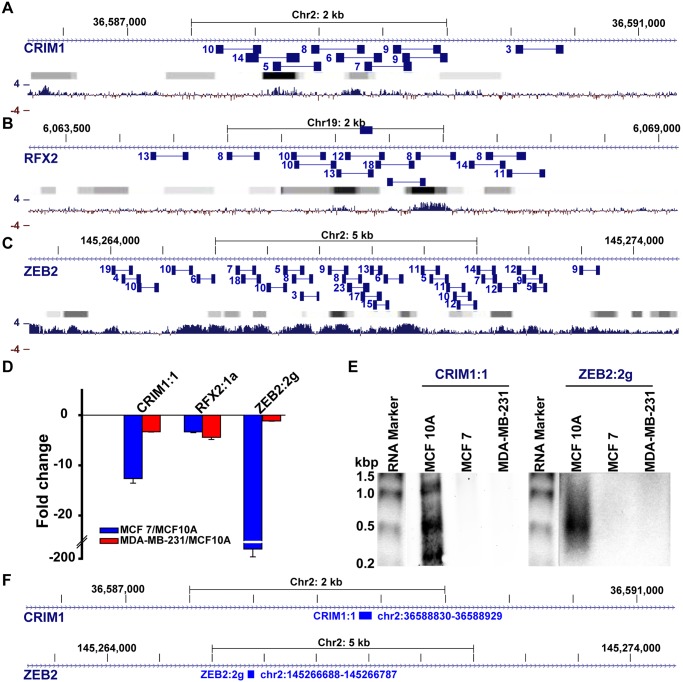
Non-coding RNAs (ncRNAs) play major roles in development and cancer progression. To identify novel ncRNAs that may identify key pathways in breast cancer development, we performed high-throughput transcript profiling of tumor and normal matched-pair tissue samples. Initial transcriptome profiling using high-density genome-wide tiling arrays revealed changes in over 200 novel candidate genomic regions that map to intronic regions. Sixteen genomic loci were identified that map to the long introns of five key protein-coding genes, CRIM1, EPAS1, ZEB2, RBMS1, and RFX2. Consistent with the known role of the tumor suppressor ZEB2 in the cancer-associated epithelial to mesenchymal transition (EMT), in situ hybridization reveals that the intronic regions deriving from ZEB2 as well as those from RFX2 and EPAS1 are down-regulated in cells of epithelial morphology, suggesting that these regions may be important for maintaining normal epithelial cell morphology. Paired-end deep sequencing analysis reveals a large number of distinct genomic clusters with no coding potential within the introns of these genes. These novel transcripts are only transcribed from the coding strand. A comprehensive search for breast cancer associated genes reveals enrichment for transcribed intronic regions from these loci, pointing to an underappreciated role of introns or mechanisms relating to their biology in EMT and breast cancer.


Conflict of interest statement

Competing Interests: The authors have declared that no competing interests exist.

Figures

Fig 1
Fig 1. Tiling array difference signals between normal and tumor samples for a long candidate region relevant to breast cancer biology.
The entire 195 kb long CRIM1 locus (red) trends toward downregulation in tumor samples. The marked CRIM1 intronic locations (arrows) that manifest reduced probe intensity signals in tumor were validated by PCR validations. Comparison of the CRIM1 locus to both its neighborhood, and its gene structure containing small exons (boxes) and long introns (lines) underscores the high degree of downregulation seen at multiple intronic locations. The tiling array signal intensities are relative intensities that are unique to each sample and hence should not be compared across the four different samples.
Fig 2
Fig 2. Gene expression patterns of candidate regions in matched-pair samples of breast cancer.
Quantitative PCR validations of twenty eight independent patient samples (14 normal-tumor pairs) of progressive aggressiveness (grades I-III) were profiled. Of the locations that are differentially regulated in tumor (p<0.001); seven candidates (red) do not pass the moderately stringent p-value cutoff, some of these locations manifest reasonable statistical significance (p<0.01) and hence may be useful for further studies. The name of the host gene followed by the number of the intron that encompasses the tested region, followed by alphabetic numbering to differentiate the different regions tested within the intronic region are indicated (Identifier). For example, the ZEB2:2c region represents the third (c) candidate tested (spanning 114 bp, starting at chr2:145245583), which is located in the second intron of ZEB2, while CRIM1:7 represents the only candidate located within the seventh intron of CRIM1 (spanning 124 bp, downstream of chr2:36714044). Curiously most of the regions tested are located within the first intron of the host gene. HER2 and ESR1 which is generally overexpressed in more aggressive breast cancer, is used as an internal control.
Fig 3
Fig 3. Examples of candidate intronic ncRNAs that are downregulated in breast cancer tissues, compared to the expression patterns of their host genes.
In situ hybridization of the cognate host gene mRNAs (in blue) for ZEB2 (A), CRIM1 (B) and RFX2 (C), and the candidate intronic ncRNA (Black) in sample-matched normal (left panels) and cancer tissues (right panels). RNA transcripts are blue/black and tissue is counterstained with nuclear Fast Red. Among the seven intronic and three mRNA loci tested, a few intronic loci such as RFX2:1a, CRIM1:7, and ZEB2:2g intronic regions show strong down-regulation in tumor epithelial cells, compared to control tissue. The comparisons of normal and tumor expression for Zeb2 variants illustrates that in tumor tissues that lose epithelial characteristics, canonical Zeb2 mRNA is still present. On the other hand intronic regions, such as Zeb2:2g, show robust expression in normal control tissue yet are greatly reduced in tumor tissues. Therefore the candidate intronic RNAs are downregulated in tumor cells compared to their cognate control RNAs.
Fig 4
Fig 4. Downregulation of ZEB2 protein in epithelial cells.
DAPI (blue) and E29 (red) staining are used to mark nucleus and epithelial cells of normal (A) and breast cancer (B) tissue, respectively, from a matched-pair invasive ductal carcinoma sample. Downregulation of ZEB2 (green) protein in breast epithelial cells (B) supports the idea that it is a target of aberrant gene regulation in breast cancer.
Fig 5
Fig 5. ZEB2 intronic sense transcripts manifest disparate expression patterns during development in mice.
A) Intronic riboprobe to regions 2a, 2g, and 2h within ZEB2 gene were used to detect sense-strand RNAs in mouse embryo head at E14 (B-E). Two different exon regions were used as internal controls, one within 3’ UTR (B) and another corresponding to the cDNA riboprobe used in the Allen Mouse Brain Atlas at E16 (F). B-I) RNA in situ hybridization in sagittal head sections of E14 and E16 mouse embryos. Scale bar E14 = 0.5 mm; E16 = 1 mm. J-K) Sagittal images of the olfactory bulb of E16 embryos highlighting the complementary expression pattern of ZEB2 in the olfactory nerve (ON), and Zeb2:2h in the mitral (MCL) and granule (GCL) cell layers. Scale bar = 100 μm. L. Sagittal section, RNA in situ hybridization detecting region Zeb2:2h in the adult mouse brain. Scale bar = 1 mm. BS, brain stem; CE, cerebellum; CP, caudoputamen; CxP, cortical plate; GE, ganglionic eminence; HIP, hippocampus; HY, hypothalamus; MB, midbrain; OB, olfactory bulb, OE, olfactory epithelium; OT, otic sensory epithelium; PC, progenitor cells of the cerebral cortex; PIT, pituitary gland; TG, trigeminal gland, TH, thalamus.
Fig 6
Fig 6. Paired-end sequencing read patterns confirm the presence of intronic transcripts.
A-C) The number of reads obtained from overlapping paired sequence reads (connected blue boxes) are indicated next to each paired read. Gradient bars (grey to black) represent known transcription factor binding sites obtained from ENCODE ChIP-Seq experiments, generated using UCSC genome browser; darker boxes represent increased transcription factor binding signal strengths across ENCODE experiments. Bottom bar plotgraphs (blue) represent the extent (4 = high, -4 = low) of evolutionary conservation in placental mammals. Reads obtained at locations of CRIM1:1 (A), RFX2:1a (B), and ZEB2:2g (C) reveal clusters of transcript regions that are generally located next to known transcription factor binding sites (Gradient bars) and highly conserved locations (blue). D) qPCR detection of differential expression of CRIM1, RFX2, and ZEB2 intronic transcripts in model breast cancer lines (MCF-7 and MDA-MB-231), in comparison to the model epithelial (normal) cell line, MCF10A. E) Analysis of CRM1:1 and ZEB2:2g locations by northern blot reveals the overabundance of novel transcripts that range from ~300–1000 nts for CRIM1:1 and ~500nts for MCF10A. F) the location of probes used for the northern blot.

Similar articles

Cited by

References

    1. Cawley S, Bekiranov S, Ng HH, Kapranov P, Sekinger EA, Kampa D, et al. Unbiased mapping of transcription factor binding sites along human chromosomes 21 and 22 points to widespread regulation of noncoding RNAs. Cell. 2004;116(4):499–509. - PubMed
    1. Birney E, Stamatoyannopoulos JA, Dutta A, Guigo R, Gingeras TR, Margulies EH, et al. Identification and analysis of functional elements in 1% of the human genome by the ENCODE pilot project. Nature. 2007;447(7146):799–816. - PMC - PubMed
    1. Rinn JL, Kertesz M, Wang JK, Squazzo SL, Xu X, Brugmann SA, et al. Functional demarcation of active and silent chromatin domains in human HOX loci by noncoding RNAs. Cell. 2007;129(7):1311–23. - PMC - PubMed
    1. Sleutels F, Zwart R, Barlow DP. The non-coding Air RNA is required for silencing autosomal imprinted genes. Nature. 2002;415(6873):810–3. - PubMed
    1. Esteller M. Non-coding RNAs in human disease. Nat Rev Genet. 2011;12(12):861–74. 10.1038/nrg3074 - DOI - PubMed

Publication types

MeSH terms