

CXCR3 signaling in BRAFWT melanoma increases IL-8 expression and tumorigenicity
- PMID: 25798946
- PMCID: PMC4370421
- DOI: 10.1371/journal.pone.0121140
CXCR3 signaling in BRAFWT melanoma increases IL-8 expression and tumorigenicity
Abstract
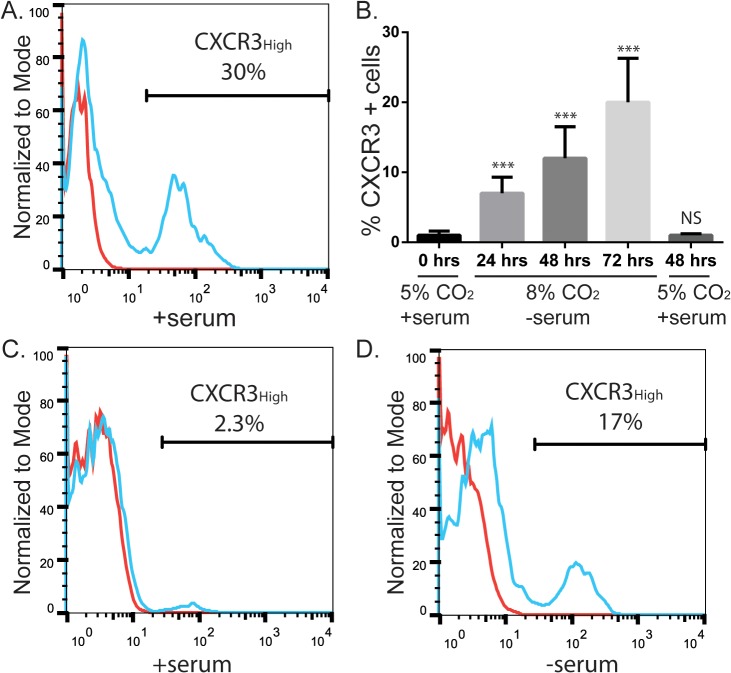
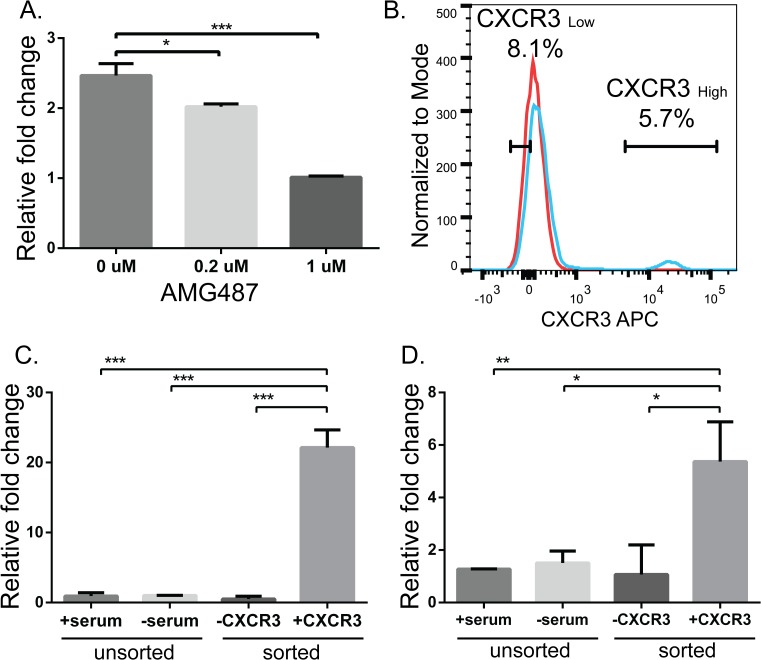
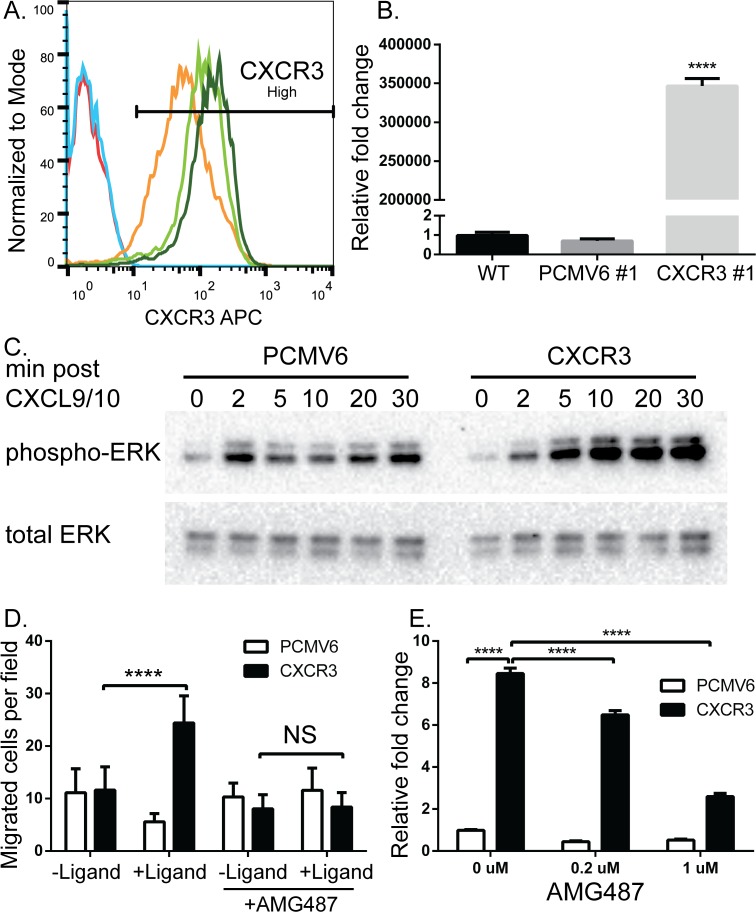
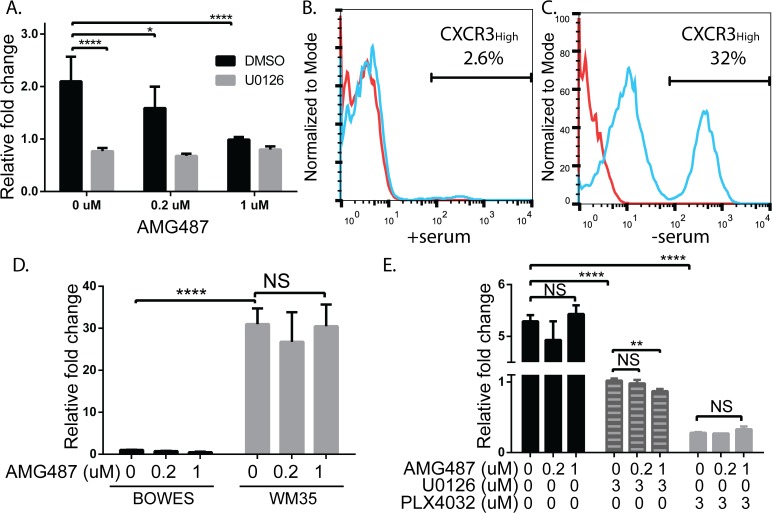
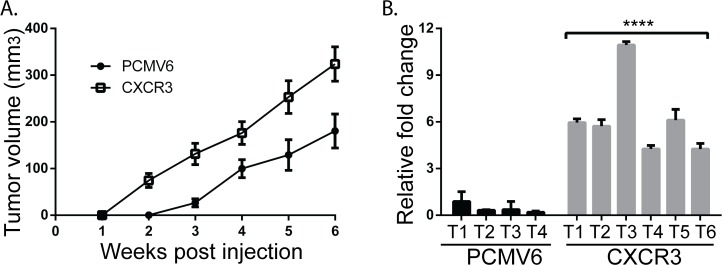
Patients with early stage, radial growth phase (RGP) melanoma have a 97% survival rate; however, when the melanoma progresses to the invasive vertical growth phase (VGP), survival rates decrease to 15%. The targets of many clinical trials are the known genetic and molecular mechanisms involved in melanoma progression, with the most common oncogenic mutation being the BRAFV600E. However, less than half of melanomas harbor this mutation, and consequently, do not respond to the current BRAF targeted treatments. It is therefore critical to elucidate alternative mechanisms regulating melanoma progression. Increased expression of the chemokine receptor, CXCR3, on melanoma cells is correlated with increased metastasis and poor patient outcomes, suggesting a role for CXCR3 in the RGP to VGP transition. We found that endogenous CXCR3 can be induced in two RGP cell lines, BOWES (BRAFWT) and WM35 (BRAFV600E), with in vitro environmental stress and nutrient deprivation. Signaling via induced endogenous CXCR3 is linked with IL-8 expression in BOWES cells. Ectopic overexpression of CXCR3 in BOWES cells leads to increased ligand-mediated phERK, cellular migration, and IL-8 expression in vitro, and to increased tumorigenesis and lymph node metastasis in vivo. Our results demonstrate that, in BRAFWT melanomas, CXCR3 signaling mediates significant increases in IL-8 expression, suggesting that CXCR3 expression and signaling may represent a transformative event that drives the progression of BRAFWT melanomas.
Implications: Expression of CXCR3 on BRAFWT melanoma cells may be a mediator of melanoma progression.
Conflict of interest statement
Figures
Similar articles
-
[Study of negative feedback between wild-type BRAF or RAFV600E and Mps1 in melanoma].Zhonghua Bing Li Xue Za Zhi. 2015 Apr;44(4):274-7. Zhonghua Bing Li Xue Za Zhi. 2015. PMID: 25975913 Chinese.
-
The BRAF(V600E) inhibitor, PLX4032, increases type I collagen synthesis in melanoma cells.Matrix Biol. 2015 Oct;48:66-77. doi: 10.1016/j.matbio.2015.05.007. Epub 2015 May 16. Matrix Biol. 2015. PMID: 25989506 Free PMC article.
-
BRAF oncogenic mutations correlate with progression rather than initiation of human melanoma.Cancer Res. 2003 Jul 15;63(14):3883-5. Cancer Res. 2003. PMID: 12873977
-
B-RAF: A contributor to the melanoma phenotype.Int J Biochem Cell Biol. 2011 Jan;43(1):29-32. doi: 10.1016/j.biocel.2010.09.015. Epub 2010 Sep 29. Int J Biochem Cell Biol. 2011. PMID: 20883818 Review.
-
The window of opportunities for targeted therapy in BRAFwt/NRASwt/KITwt melanoma: biology and clinical implications of fusion proteins and other mutations.G Ital Dermatol Venereol. 2018 Jun;153(3):349-360. doi: 10.23736/S0392-0488.18.05970-9. Epub 2018 Mar 29. G Ital Dermatol Venereol. 2018. PMID: 29600692 Review.
Cited by
-
Senescent human melanocytes drive skin ageing via paracrine telomere dysfunction.EMBO J. 2019 Dec 2;38(23):e101982. doi: 10.15252/embj.2019101982. Epub 2019 Oct 21. EMBO J. 2019. PMID: 31633821 Free PMC article.
-
CXCR3+ monocytes/macrophages are required for establishment of pulmonary metastases.Sci Rep. 2017 Mar 30;7:45593. doi: 10.1038/srep45593. Sci Rep. 2017. PMID: 28358049 Free PMC article.
-
SSeCKS/AKAP12 scaffolding functions suppress B16F10-induced peritoneal metastasis by attenuating CXCL9/10 secretion by resident fibroblasts.Oncotarget. 2017 Aug 9;8(41):70281-70298. doi: 10.18632/oncotarget.20092. eCollection 2017 Sep 19. Oncotarget. 2017. PMID: 29050279 Free PMC article.
-
Cytokines, Chemokines, and Other Biomarkers of Response for Checkpoint Inhibitor Therapy in Skin Cancer.Front Med (Lausanne). 2018 Dec 12;5:351. doi: 10.3389/fmed.2018.00351. eCollection 2018. Front Med (Lausanne). 2018. PMID: 30631766 Free PMC article. Review.
-
TNF-alpha and metalloproteases as key players in melanoma cells aggressiveness.J Exp Clin Cancer Res. 2018 Dec 28;37(1):326. doi: 10.1186/s13046-018-0982-1. J Exp Clin Cancer Res. 2018. PMID: 30591049 Free PMC article.
References
-
- Clark WH, Elder DE, Guerry D, Epstein MN, Greene MH, Van Horn M. A study of tumor progression: The precursor lesions of superficial spreading and nodular melanoma. Hum Pathol. 1984. Dec;15(12):1147–65. - PubMed
-
- Meier F, Satyamoorthy K, Nesbit M, Hsu MY, Schittek B, Garbe C, et al. Molecular events in melanoma development and progression. Front Biosci. 1998. Sep 15;3:D1005–10. - PubMed
-
- Leslie MC, Bar-Eli M. Regulation of gene expression in melanoma: new approaches for treatment. J Cell Biochem. 2005. Jan 1;94(1):25–38. - PubMed
-
- Balch CM, Soong S-J, Atkins MB, Buzaid AC, Cascinelli N, Coit DG, et al. An evidence-based staging system for cutaneous melanoma. CA Cancer J Clin. 2004;54(3):131–49; quiz 182–4. - PubMed
-
- American Cancer Society. Cancer Facts and Figures, 2014. Atlanta, Georgia; 2014.
Publication types
MeSH terms
Substances
Grants and funding
LinkOut - more resources
Full Text Sources
Other Literature Sources
Medical
Research Materials
