

A method for identification and analysis of non-overlapping myeloid immunophenotypes in humans
- PMID: 25799053
- PMCID: PMC4370675
- DOI: 10.1371/journal.pone.0121546
A method for identification and analysis of non-overlapping myeloid immunophenotypes in humans
Abstract
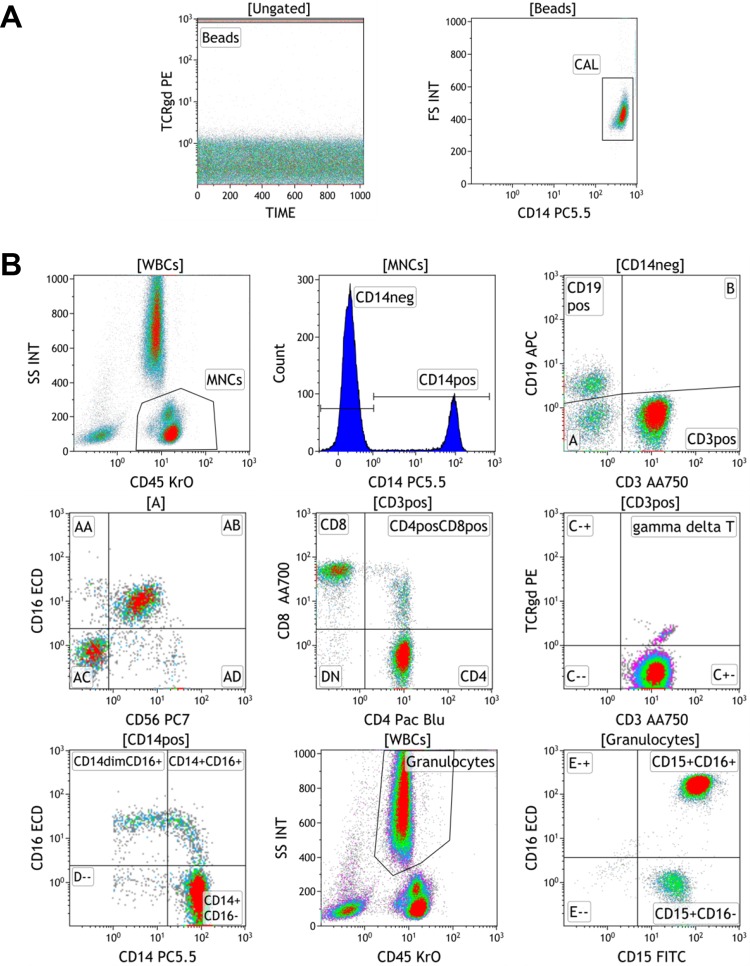
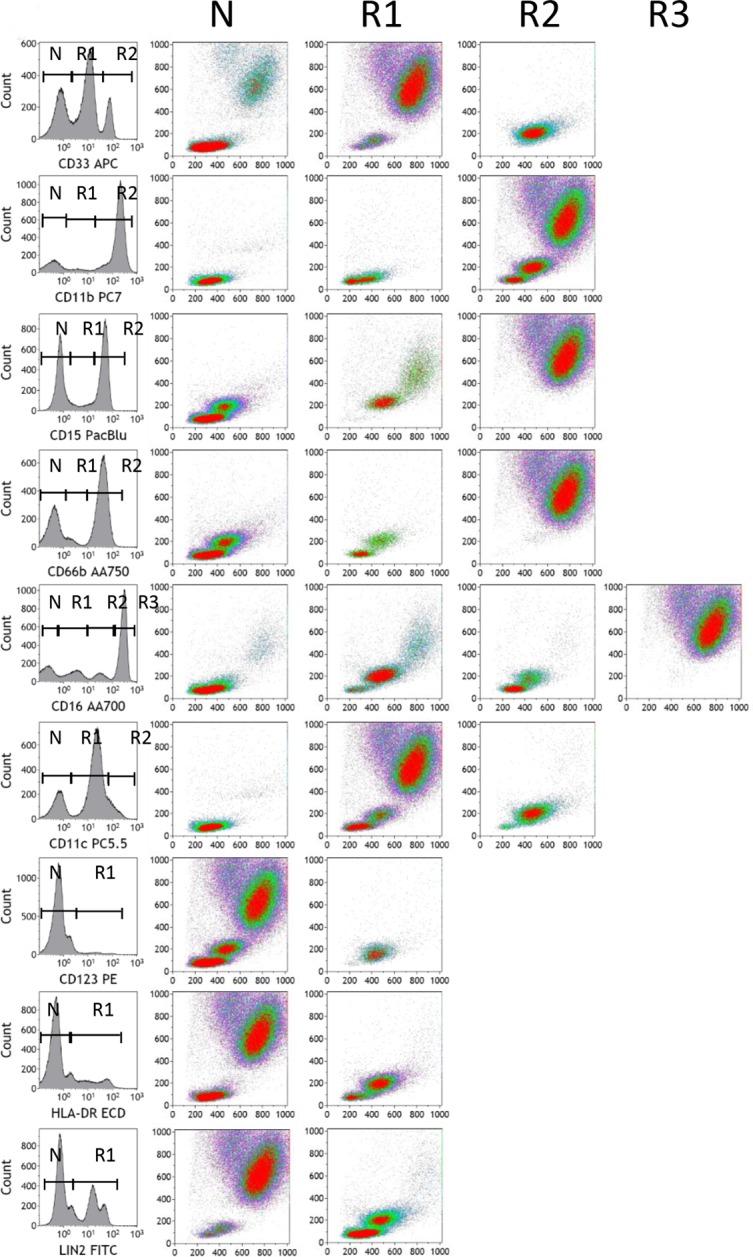
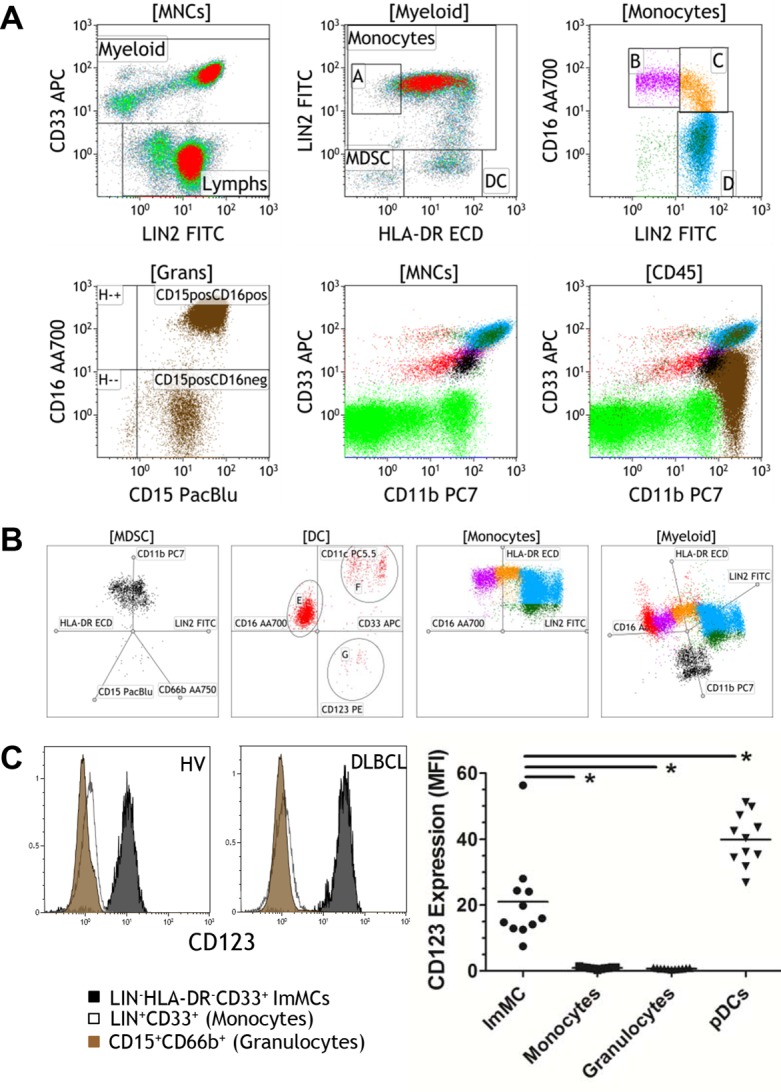
The development of flow cytometric biomarkers in human studies and clinical trials has been slowed by inconsistent sample processing, use of cell surface markers, and reporting of immunophenotypes. Additionally, the function(s) of distinct cell types as biomarkers cannot be accurately defined without the proper identification of homogeneous populations. As such, we developed a method for the identification and analysis of human leukocyte populations by the use of eight 10-color flow cytometric protocols in combination with novel software analyses. This method utilizes un-manipulated biological sample preparation that allows for the direct quantitation of leukocytes and non-overlapping immunophenotypes. We specifically designed myeloid protocols that enable us to define distinct phenotypes that include mature monocytes, granulocytes, circulating dendritic cells, immature myeloid cells, and myeloid derived suppressor cells (MDSCs). We also identified CD123 as an additional distinguishing marker for the phenotypic characterization of immature LIN-CD33+HLA-DR- MDSCs. Our approach permits the comprehensive analysis of all peripheral blood leukocytes and yields data that is highly amenable for standardization across inter-laboratory comparisons for human studies.
Conflict of interest statement
Figures
Similar articles
-
A circulating subpopulation of monocytic myeloid-derived suppressor cells as an independent prognostic/predictive factor in untreated non-small lung cancer patients.J Immunol Res. 2014;2014:659294. doi: 10.1155/2014/659294. Epub 2014 Nov 11. J Immunol Res. 2014. PMID: 25436215 Free PMC article.
-
Flow Cytometric Analysis of Myeloid Cells in Human Blood, Bronchoalveolar Lavage, and Lung Tissues.Am J Respir Cell Mol Biol. 2016 Jan;54(1):13-24. doi: 10.1165/rcmb.2015-0146OC. Am J Respir Cell Mol Biol. 2016. PMID: 26267148 Free PMC article.
-
Myeloid derived suppressor cells are numerically, functionally and phenotypically different in patients with multiple myeloma.Leuk Lymphoma. 2014 Dec;55(12):2893-900. doi: 10.3109/10428194.2014.904511. Epub 2014 May 12. Leuk Lymphoma. 2014. PMID: 24625328
-
Neutrophils and granulocytic myeloid-derived suppressor cells: immunophenotyping, cell biology and clinical relevance in human oncology.Cancer Immunol Immunother. 2012 Aug;61(8):1155-67. doi: 10.1007/s00262-012-1294-5. Epub 2012 Jun 13. Cancer Immunol Immunother. 2012. PMID: 22692756 Free PMC article. Review.
-
Immunophenotypic pattern of myeloid populations by flow cytometry analysis.Methods Cell Biol. 2011;103:221-66. doi: 10.1016/B978-0-12-385493-3.00010-3. Methods Cell Biol. 2011. PMID: 21722806 Review.
Cited by
-
Rousette Bat Dendritic Cells Overcome Marburg Virus-Mediated Antiviral Responses by Upregulation of Interferon-Related Genes While Downregulating Proinflammatory Disease Mediators.mSphere. 2019 Dec 4;4(6):e00728-19. doi: 10.1128/mSphere.00728-19. mSphere. 2019. PMID: 31801842 Free PMC article.
-
DAT and TH expression marks human Parkinson's disease in peripheral immune cells.NPJ Parkinsons Dis. 2022 Jun 7;8(1):72. doi: 10.1038/s41531-022-00333-8. NPJ Parkinsons Dis. 2022. PMID: 35672374 Free PMC article.
-
Development of a Modular Assay for Detailed Immunophenotyping of Peripheral Human Whole Blood Samples by Multicolor Flow Cytometry.Int J Mol Sci. 2016 Aug 11;17(8):1316. doi: 10.3390/ijms17081316. Int J Mol Sci. 2016. PMID: 27529227 Free PMC article.
-
Effects of tumor grade and dexamethasone on myeloid cells in patients with glioma.Oncoimmunology. 2018 Aug 27;7(11):e1507668. doi: 10.1080/2162402X.2018.1507668. eCollection 2018. Oncoimmunology. 2018. PMID: 30377570 Free PMC article.
-
The 'Danse Macabre'-Neutrophils the Interactive Partner Affecting Oral Cancer Outcomes.Front Immunol. 2022 Jun 16;13:894021. doi: 10.3389/fimmu.2022.894021. eCollection 2022. Front Immunol. 2022. PMID: 35784290 Free PMC article. Review.
References
-
- Nakayama F, Nishihara S, Iwasaki H, Kudo T, Okubo R, Kaneko M, et al. CD15 expression in mature granulocytes is determined by alpha 1,3-fucosyltransferase IX, but in promyelocytes and monocytes by alpha 1,3-fucosyltransferase IV. J Biol Chem. 2001. May 11;276(19):16100–6. - PubMed
Publication types
MeSH terms
Grants and funding
LinkOut - more resources
Full Text Sources
Other Literature Sources
Medical
Research Materials
