. 2015 Apr;21(4):327-34.
doi: 10.1038/nm.3831. Epub 2015 Mar 23.

Prostaglandin E2 and programmed cell death 1 signaling coordinately impair CTL function and survival during chronic viral infection

Affiliations

Prostaglandin E2 and programmed cell death 1 signaling coordinately impair CTL function and survival during chronic viral infection

Jonathan H Chen et al. Nat Med. 2015 Apr.

Abstract

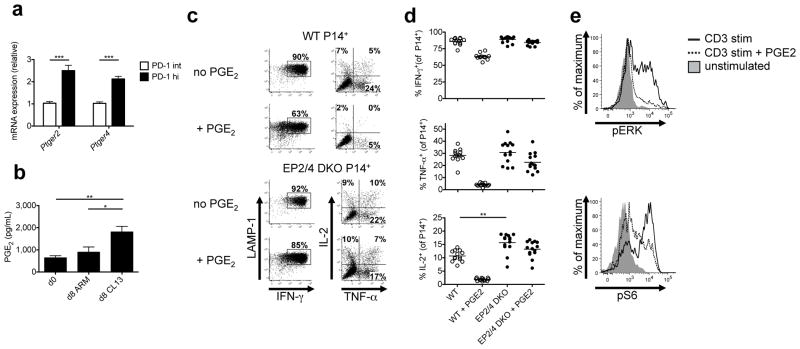
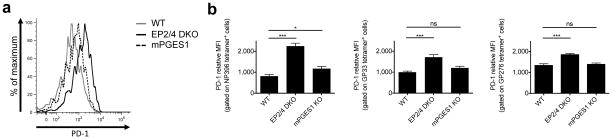
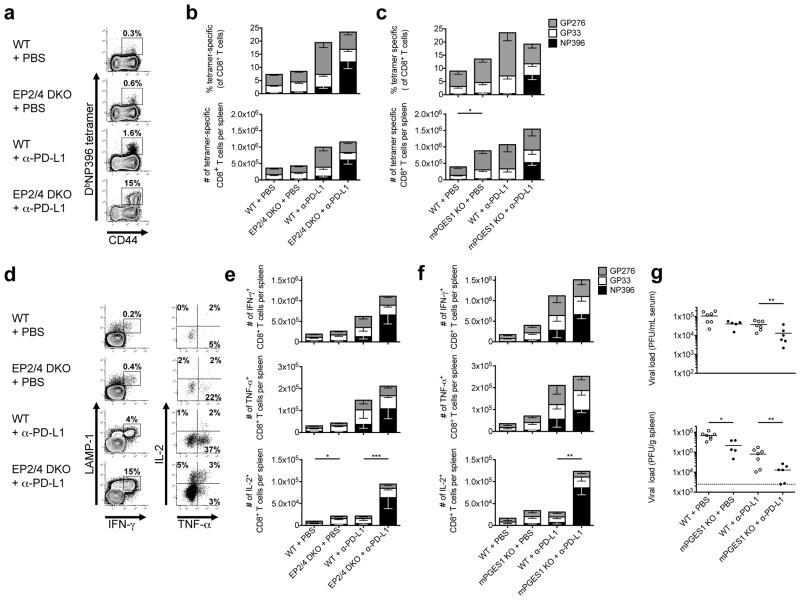
More than 10% of the world's population is chronically infected with HIV, hepatitis C virus (HCV) or hepatitis B virus (HBV), all of which can cause severe disease and death. These viruses persist in part because continuous antigenic stimulation causes the deterioration of virus-specific cytotoxic T lymphocyte (CTL) function and survival. Additionally, antiviral CTLs autonomously suppress their responses to limit immunopathology by upregulating inhibitory receptors such as programmed cell death 1 (PD-1). Identification and blockade of the pathways that induce CTL dysfunction may facilitate the clearance of chronic viral infections. We found that the prostaglandin E2 (PGE₂) receptors EP2 and EP4 were upregulated on virus-specific CTLs during chronic lymphocytic choriomeningitis virus (LCMV) infection and suppressed CTL survival and function. We show that the combined blockade of PGE₂ and PD-1 signaling was therapeutic in terms of improving viral control and augmenting the numbers of functional virus-specific CTLs. Thus, PGE₂ inhibition is both an independent candidate therapeutic target and a promising adjunct therapy to PD-1 blockade for the treatment of HIV and other chronic viral infections.


Conflict of interest statement

Competing Financial Interests

The authors declare competing financial interests: Jonathan Chen and Susan Kaech have applied for a patent based, in part, on the findings outlined in this paper.

Figures

Figure 1
Figure 1. PGE2 signaling directly suppresses CTL function via the receptors EP2 and EP4 during LCMV infection
(a) Ptger2 and Ptger4 mRNA was measured using qRT-PCR in PD-1hi and PD-1intermediate CD44hi CD8 T cells from LCMV-CL13 infected mice at day 21 p.i. Data are from two independent experiments with a total of 13 mice per group. (b) Whole splenocytes from mice infected with LCMV-Arm or LCMV-CL13 were harvested at day 8 p.i. and cultured for 24 hours. PGE2 was measured in the supernatant by ELISA. Data are from two independent experiments with a total of 8 mice per group. (c–d) Congenically labeled WT or EP2/4 DKO P14+ TCR CD8 T cells were adoptively transferred into WT mice depleted of CD4 T cells and infected with LCMV-CL13. At day 8 p.i., P14+ CD8 T cells were stimulated with GP33-41 peptide with or without 40μM PGE2 for 5hrs and stained for LAMP-1 and intracellular cytokines (IFN-γ, TNF-α, and IL-2). (c) Representative dot plots on left show LAMP-1 and IFN-γ production by P14+ CTLs and those on right show TNF-α and IL-2 production by IFN-γ+ P14+ CTLs. (d) Scatter plots show the compiled frequency of cytokine producing cells in the absence or presence of PGE2. Data above were compiled from three independent experiments with 13 total WT and 14 total EP2/4 DKO mice. (e) Congenically labeled WT or EP2/4 DKO P14+ TCR CD8 T cells were adoptively transferred into WT mice and infected with LCMV-Arm. At day 8 p.i., P14+ CD8 T cells were stimulated with GP33-41 peptide with or without 40μM PGE2 for 1hr. Phosphorylated ERK (pERK) and S6 (pS6) were measured by flow cytometry. Data for part e are representative of 3 independent experiments with a total of 9 mice per group. Data analysis was performed by ANOVA for part b, and by unpaired two-tailed t-test for parts a and d. Error bars depict S.E.M. *P < 0.05, **P < 0.01, and ***P < 0.001.
Figure 2
Figure 2. PGE2-deficient mice have greater numbers of antigen-specific cytokine producing CD8 T cells
WT, EP2/4 DKO, or mPGES1 KO mice were infected with LCMV-CL13, sacrificed at day 21 p.i., and analyzed by MHC Class I tetramer staining and IFN-γ, TNF-α, and IL-2 ICCS. (a) Representative FACS plots of splenic DbGP33+ CD8 T cells are shown. (b) Stacked bar graphs show the frequency and number of DbNP396-, DbGP33-, and DbGP276-specific CD8 T cells. (c) Representative dot plots of cytokine producing CD8 T cells after GP33-41 peptide stimulation. Plots in left panel are gated on CD8 T cells and plots in right panel are gated on IFN-γ+ CD8 T cells. (d) Stacked bar graphs show numbers of cytokine-producing CD8 T cells for the indicated epitope-specific CD8 T cells. Data were compiled from four experiments with a total of 13 WT, 16 EP2/4 DKO, and 8 mPGES1 KO mice. Statistical analysis was performed using ANOVA. Error bars depict S.E.M. *P < 0.05, **P < 0.01, and ***P < 0.001.
Figure 3
Figure 3. PD-1 expression in antiviral CD8 T cells in WT, EP2/4 DKO and mPGES1 KO mice
WT, EP2/4 DKO, or mPGES1 KO mice were infected with LCMV-CL13, and sacrificed at day 8 p.i. Splenic CD8 T cells were then stained with MHC class I tetramers and anti-PD-1 antibodies. (a) Histogram plot shows representative expression of PD-1 on DbNP396 tetramer-positive CD8 T cells. (b) Average MFIs of PD-1 expression for the indicated tetramer-positive populations were compiled from two experiments with a 7 total mice per group and analyzed by ANOVA. MFIs were normalized for each experiment to facilitate comparison across experiments. Error bars depict S.E.M. *P < 0.05, ***P < 0.001, and ns indicates not significant.
Figure 4
Figure 4. Combination blockade of PD-L1 and PGE2 signaling substantially augments antiviral CTL numbers and function, restores immunodominance hierarchy, and enhances viral control
EP2/4 DKO, mPGES1 KO, and WT mice were depleted of CD4 T cells and infected with LCMV-CL13. From days 28 to 42 p.i., mice were treated every third day with either anti-PD-L1 (200μg) or PBS and then analyzed at day 42 p.i. (a) Representative FACS plots for splenic DbNP396+ CD8 T cells are shown. (b and c) Stacked bar graphs show the frequency and number of DbNP396-, DbGP33-, and DbGP276-specific CD8 T cells. (d) Representative dot plots of cytokine-producing CD8 T cells after NP396-404 peptide stimulation. Plots in left panel are gated on CD8 T cells and plots in right panel are gated on IFN-γ+ CD8 T cells. (e and f) Stacked bar graphs show numbers of cytokine-producing CD8 T cells for the indicated virus-specific CD8 T cells. Data were compiled from 6 experiments with a total of 19 vehicle-treated WT, 17 vehicle treated EP2/4 DKO, 18 anti-PD-L1 treated WT, and 18 anti-PD-L1 treated EP2/4 DKO mice for the EP2/4 DKO experiments and 2 experiments with a total of 5 vehicle-treated WT, 6 vehicle-treated mPGES1 KO, 6 anti-PD-L1 treated WT, and 7 anti-PD-L1 treated mPGES1 KO mice for the mPGES1 experiments and statistically analyzed using ANOVA. (g) Spleen and serum were harvested from mice infected with LCMV-CL13 at day 42 p.i. Scatter plots show viral titers in serum and spleen measured by plaque assay. Dashed lines indicate limit of detection of the assay (50 pfu/ml for serum assay). Data were compiled from 2 independent experiments with a total of 7 vehicle-treated WT, 5 vehicle-treated mPGES1 KO, 7 anti-PD-L1 treated WT, and 6 anti-PD-L1 treated mPGES1 KO mice and statistically analyzed using ANOVA. Error bars depict S.E.M. *P < 0.05, **P < 0.01, and ***P < 0.001.
Figure 5
Figure 5. Pharmacologic PGE2 inhibition with celecoxib enhances antiviral CD8+ T cell response
WT mice were depleted of CD4 T cells and infected with LCMV-CL13. From days 0–42 p.i., mice received chow milled with or without celecoxib (100mg/kg). From days 28 to 42 p.i., mice were treated every third day with either anti-PD-L1 (200μg) or PBS and then analyzed at day 42 p.i. (a) Representative FACS plots for splenic DbNP396+ CD8 T cells are shown. (b) Stacked bar graphs show the frequency and number of DbNP396-, DbGP33-, and DbGP276-specific CD8 T cells. (c) Representative dot plots of cytokine-producing CD8 T cells after NP396-404 peptide stimulation. Plots in left panel are gated on CD8 T cells and plots in right panel are gated on IFN-γ+ CD8 T cells. (d) Stacked bar graphs show numbers of cytokine-producing CD8 T cells for the indicated virus-specific CD8 T cells. Data were compiled from 3 experiments with a total of 15 vehicle treated, 14 celecoxib-treated, 15 anti-PD-L1 treated, and 15 celecoxib and anti-PD-L1 co-treated mice. Statistical analysis was performed using ANOVA. Error bars depict S.E.M. *P < 0.05.
Figure 6
Figure 6. PGE2 signaling suppresses virus-specific CD8 T cell survival but not division
EP2/4 DKO and WT mice were depleted of CD4 T cells and infected with LCMV-CL13. From days 28 to 42 p.i., mice were treated every third day with either anti-PD-L1 (200μg) or PBS and given BrdU in their drinking water from days 35–42 p.i. At day 42 p.i., the LCMV-specific CD8 T cells were stained for BrdU, active caspases, and intracellular Bim. (a) Representative histogram plots on the top show the amount of BrdU incorporation in the DbNP396+ CD8 T cells and the compiled averages are shown in the bar graph below. (b) LCMV-specific CD8 T cells were stained for active caspases with CaspGLOW to detect apoptosis. Representative dot plots show the percentage of CaspGLOW+ DbNP396+ CD8 T cells and the compiled averages are shown in the bar graph below. (c) Representative histogram plots on the top show the amount of Bim in the DbNP396+ CD8 T cells and the compiled averages are shown in the bar graph below. Data were compiled from 2 experiments with a total of 7 vehicle-treated WT, 6 vehicle treated EP2/4 DKO, 7 anti-PD-L1 treated WT, and 7 anti-PD-L1 treated EP2/4 DKO mice and analyzed using ANOVA. Error bars depict S.E.M. *P < 0.05 and ***P < 0.001.

References

    1. Shin H, Wherry EJ. CD8 T cell dysfunction during chronic viral infection. Curr Opin Immunol. 2007;19:408–415. - PubMed
    1. Virgin HW, Wherry EJ, Ahmed R. Redefining chronic viral infection. Cell. 2009;138:30–50. - PubMed
    1. Wherry EJ. T cell exhaustion. Nat Immunol. 2011;131:492–499. - PubMed
    1. Wherry E, et al. Molecular Signature of CD8+ T Cell Exhaustion during Chronic Viral Infection. Immunity. 2007 - PubMed
    1. Lechner F, et al. Analysis of successful immune responses in persons infected with hepatitis C virus. J Exp Med. 2000;191:1499–1512. - PMC - PubMed

Publication types

MeSH terms