

Use of droplet digital PCR for estimation of fish abundance and biomass in environmental DNA surveys
- PMID: 25799582
- PMCID: PMC4370432
- DOI: 10.1371/journal.pone.0122763
Use of droplet digital PCR for estimation of fish abundance and biomass in environmental DNA surveys
Abstract
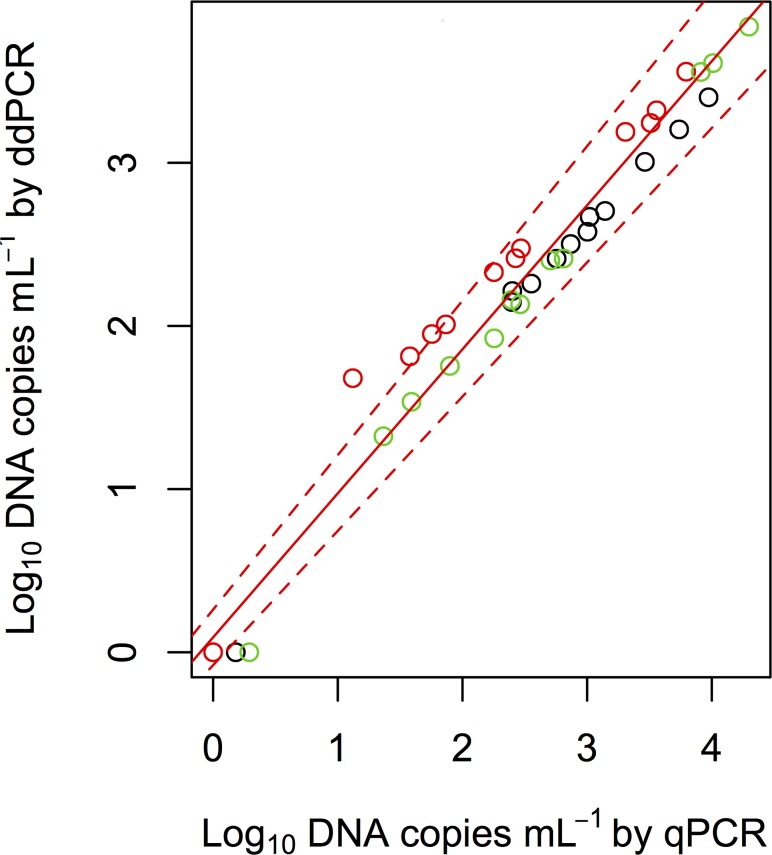
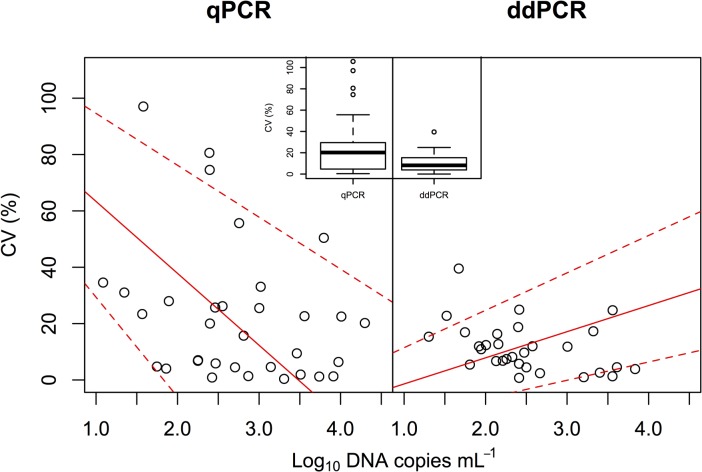
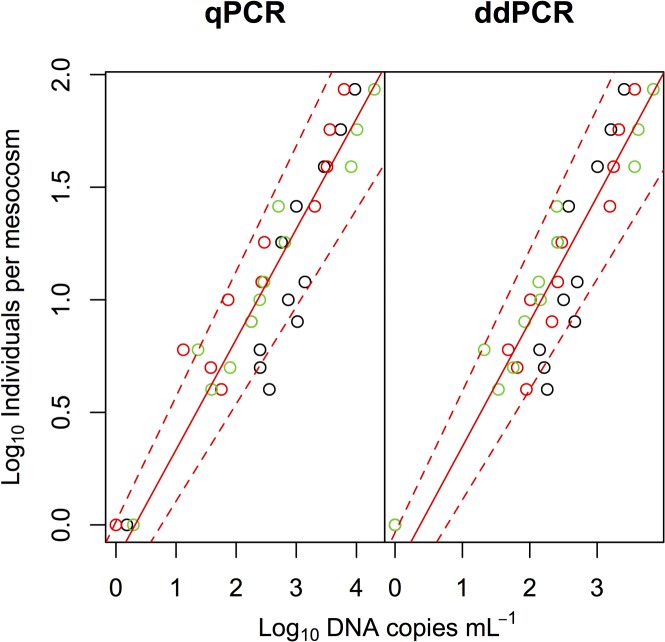
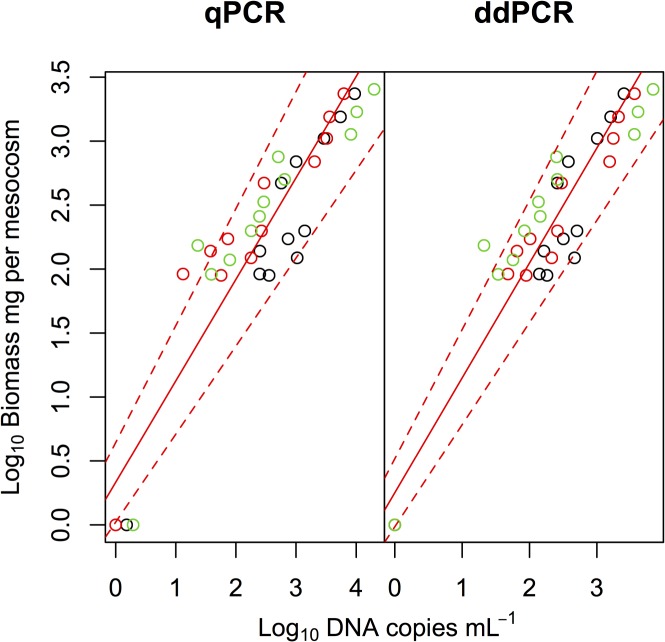
An environmental DNA (eDNA) analysis method has been recently developed to estimate the distribution of aquatic animals by quantifying the number of target DNA copies with quantitative real-time PCR (qPCR). A new quantitative PCR technology, droplet digital PCR (ddPCR), partitions PCR reactions into thousands of droplets and detects the amplification in each droplet, thereby allowing direct quantification of target DNA. We evaluated the quantification accuracy of qPCR and ddPCR to estimate species abundance and biomass by using eDNA in mesocosm experiments involving different numbers of common carp. We found that ddPCR quantified the concentration of carp eDNA along with carp abundance and biomass more accurately than qPCR, especially at low eDNA concentrations. In addition, errors in the analysis were smaller in ddPCR than in qPCR. Thus, ddPCR is better suited to measure eDNA concentration in water, and it provides more accurate results for the abundance and biomass of the target species than qPCR. We also found that the relationship between carp abundance and eDNA concentration was stronger than that between biomass and eDNA by using both ddPCR and qPCR; this suggests that abundance can be better estimated by the analysis of eDNA for species with fewer variations in body mass.
Conflict of interest statement
Figures
References
-
- Dejean T, Valentini A, Miquel C, Taberlet P, Bellemain E, Miaud C. Improved detection of an alien invasive species through environmental DNA barcoding: the example of the American bullfrog Lithobates catesbeianus . J Appl Ecol. 2012; 49: 953–959.
-
- Minamoto T, Yamanaka H, Takahara T, Honjo MN, Kawabata Z. Surveillance of fish species composition using environmental DNA. Limnology. 2012; 13: 193–197.
Publication types
MeSH terms
Substances
LinkOut - more resources
Full Text Sources
Other Literature Sources
Research Materials
