. 2015 May 28;521(7553):541-544.
doi: 10.1038/nature14328. Epub 2015 Mar 23.

REV7 counteracts DNA double-strand break resection and affects PARP inhibition

Affiliations

REV7 counteracts DNA double-strand break resection and affects PARP inhibition

Guotai Xu et al. Nature. .

Abstract

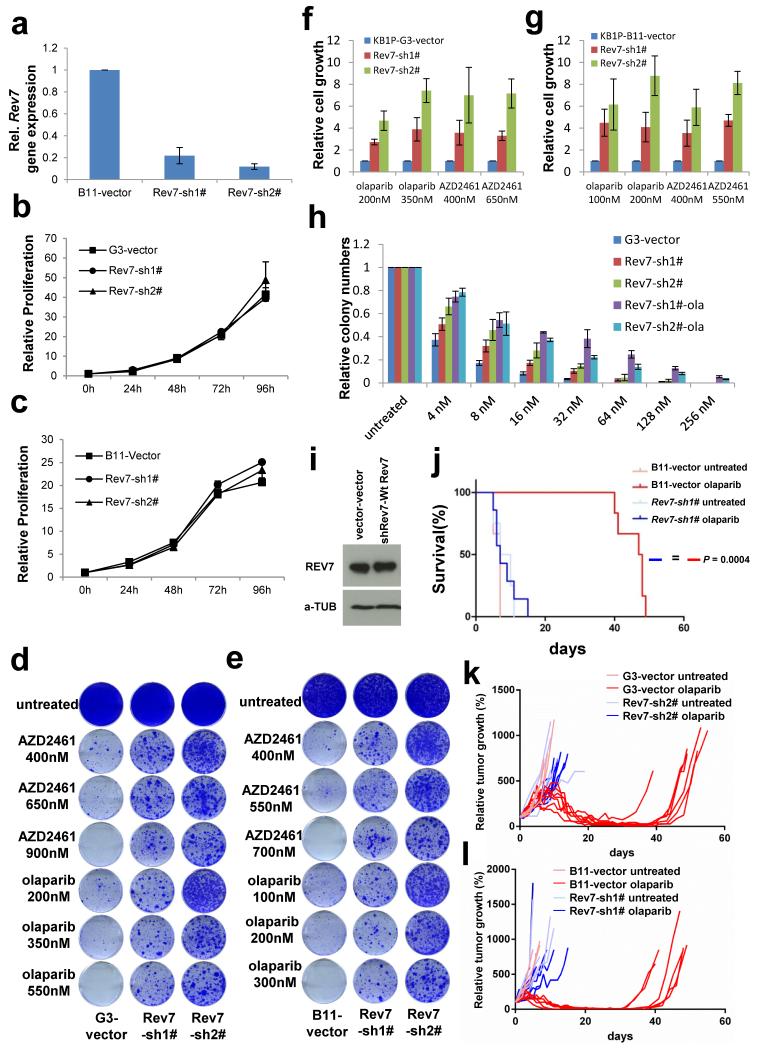
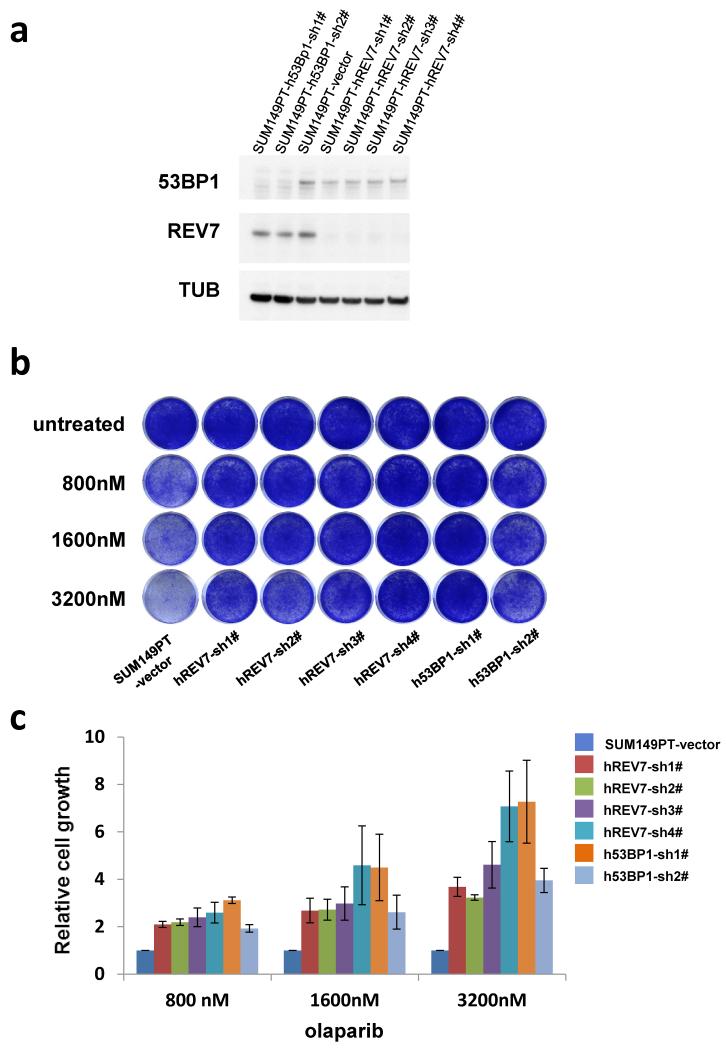
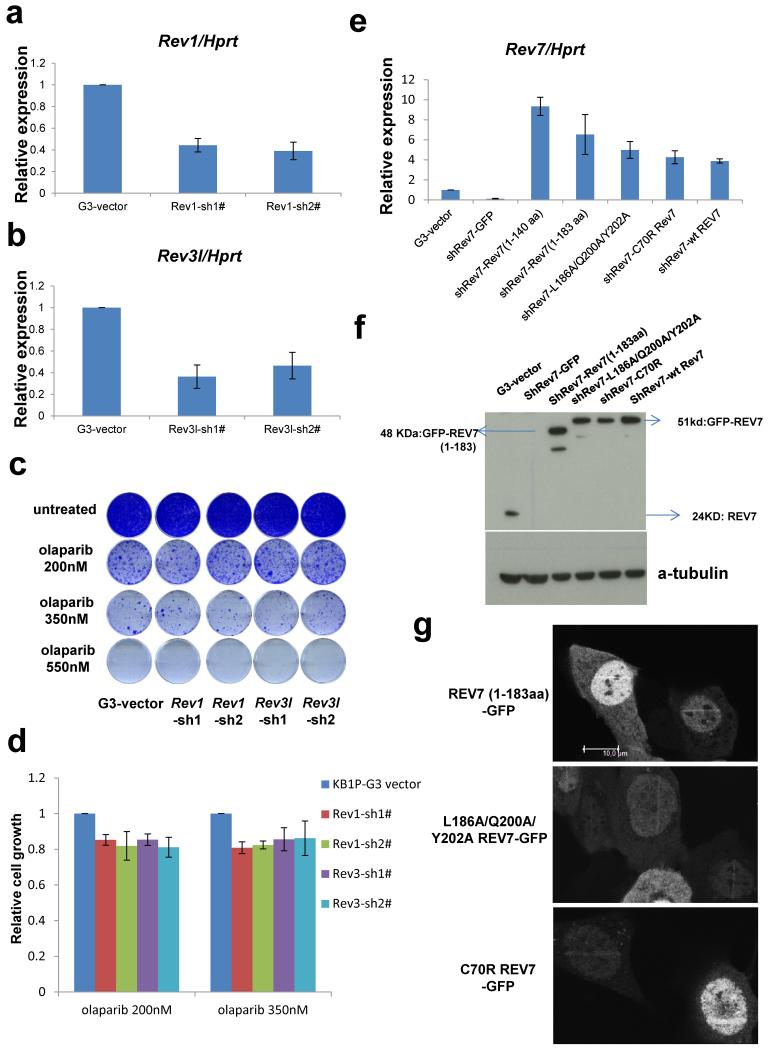
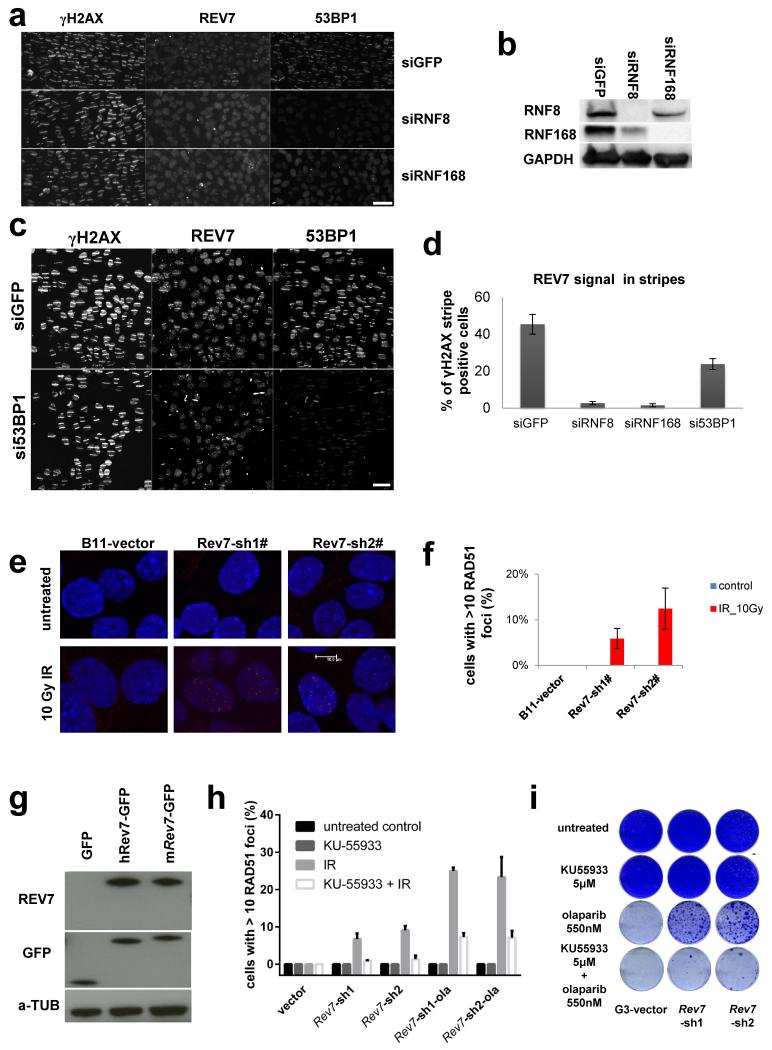
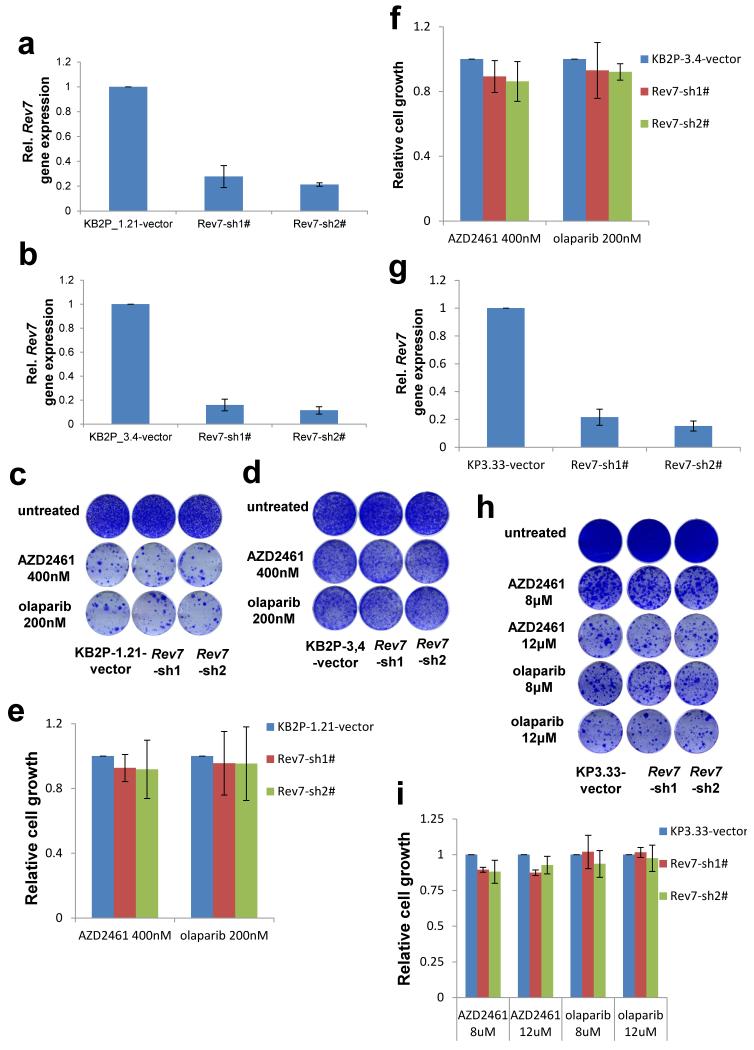
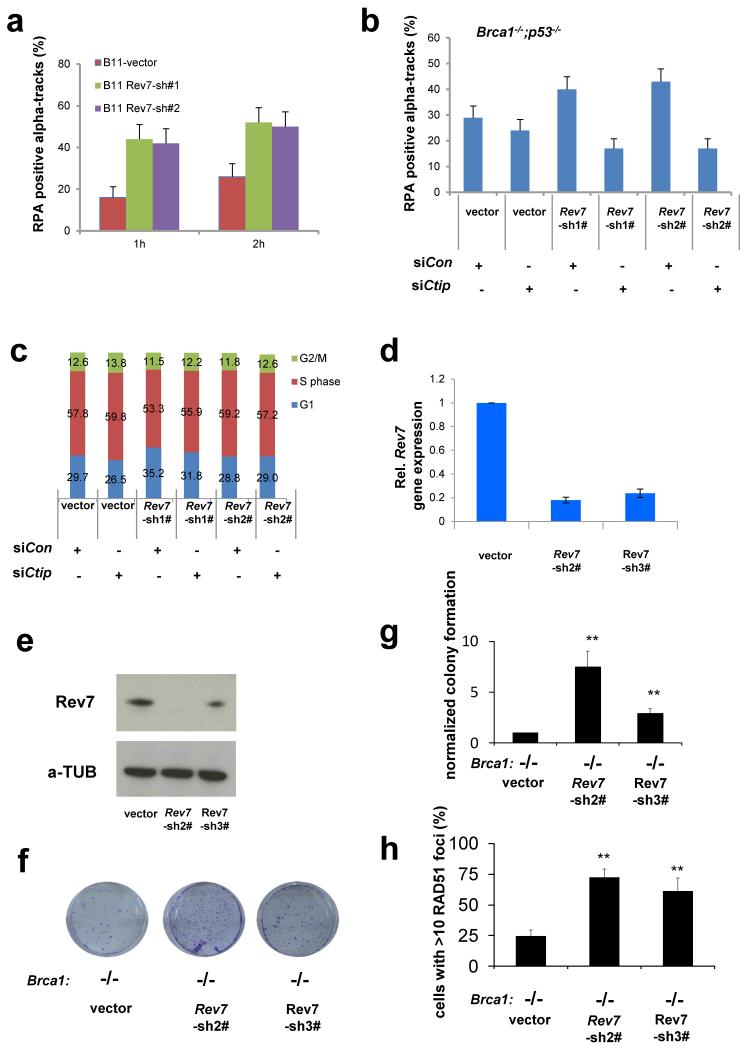
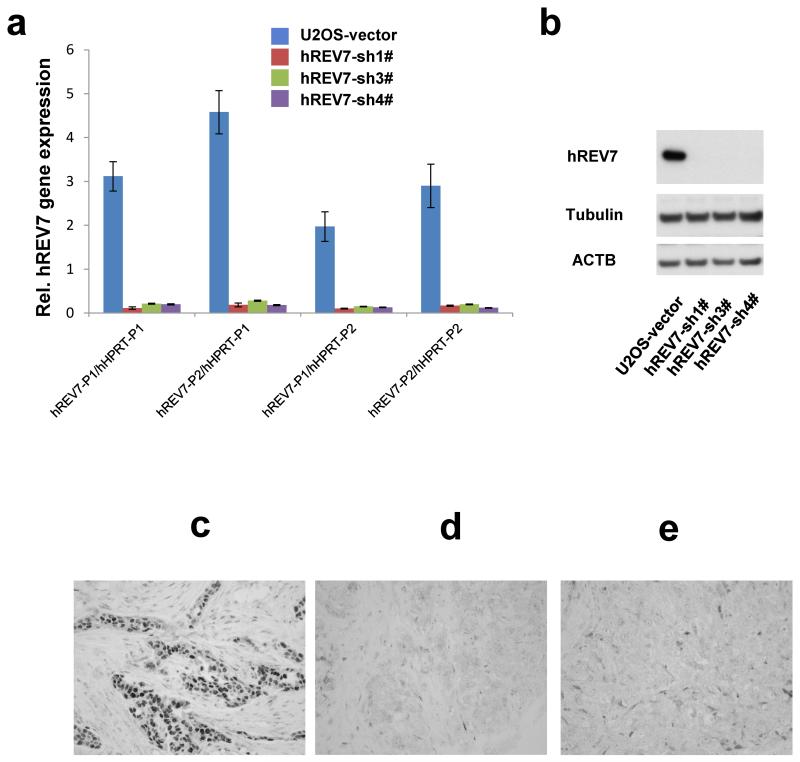
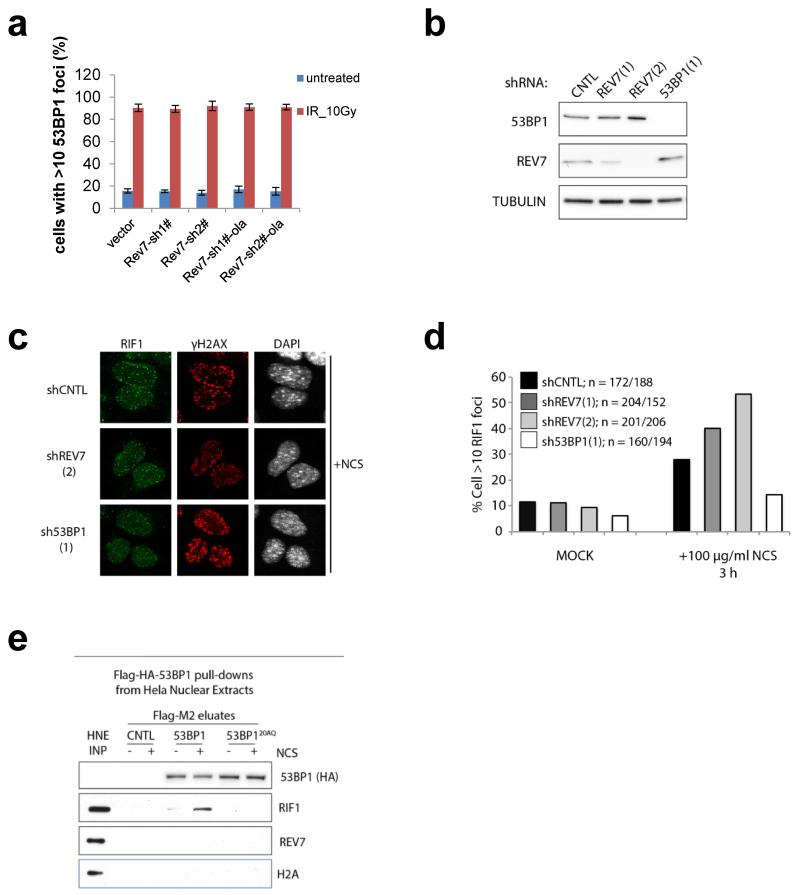
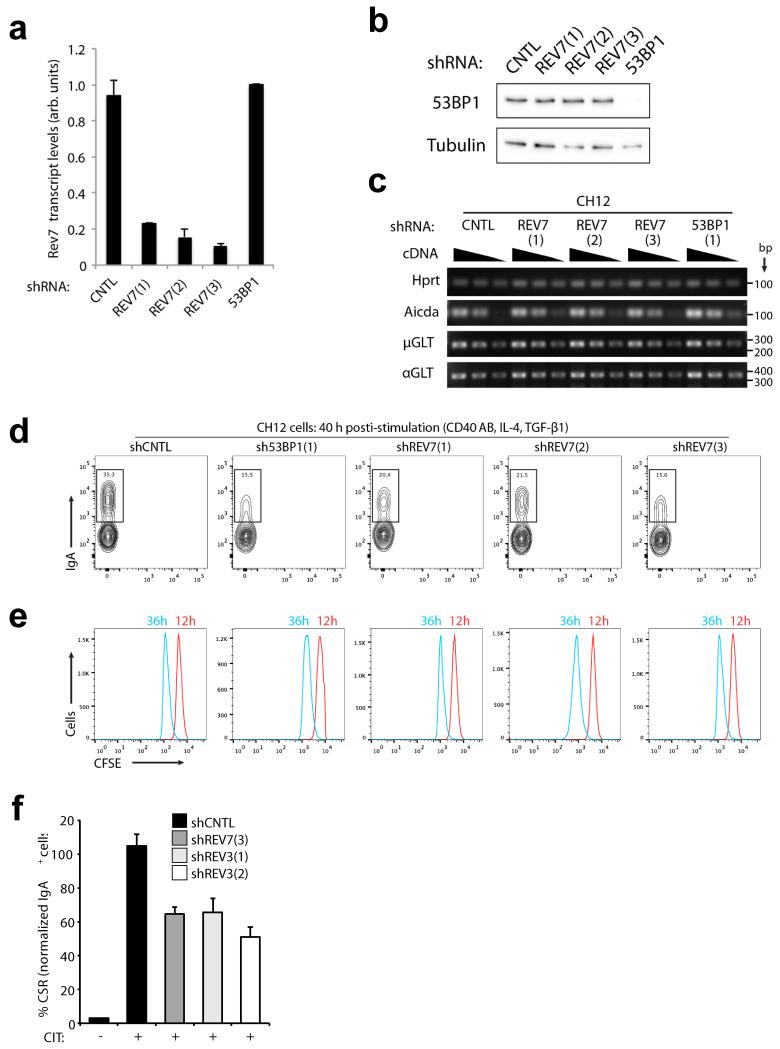
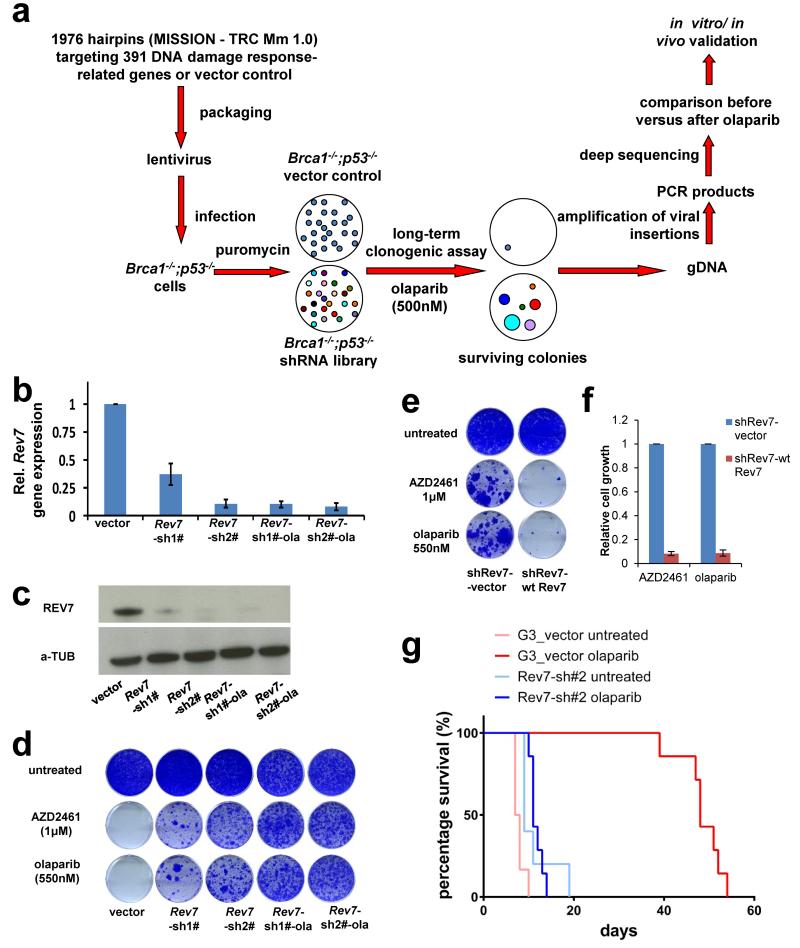
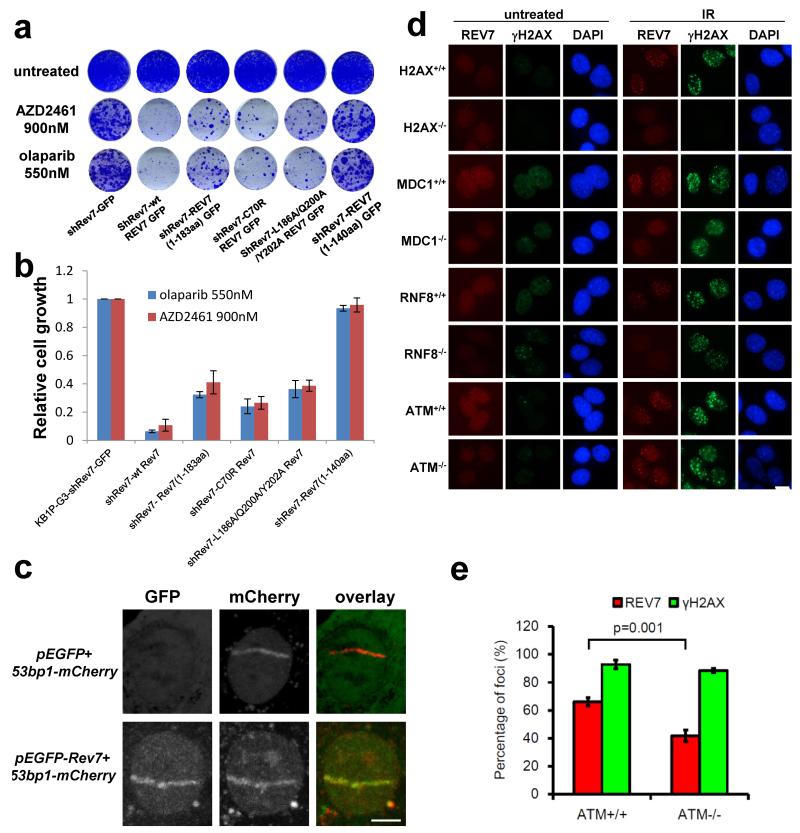
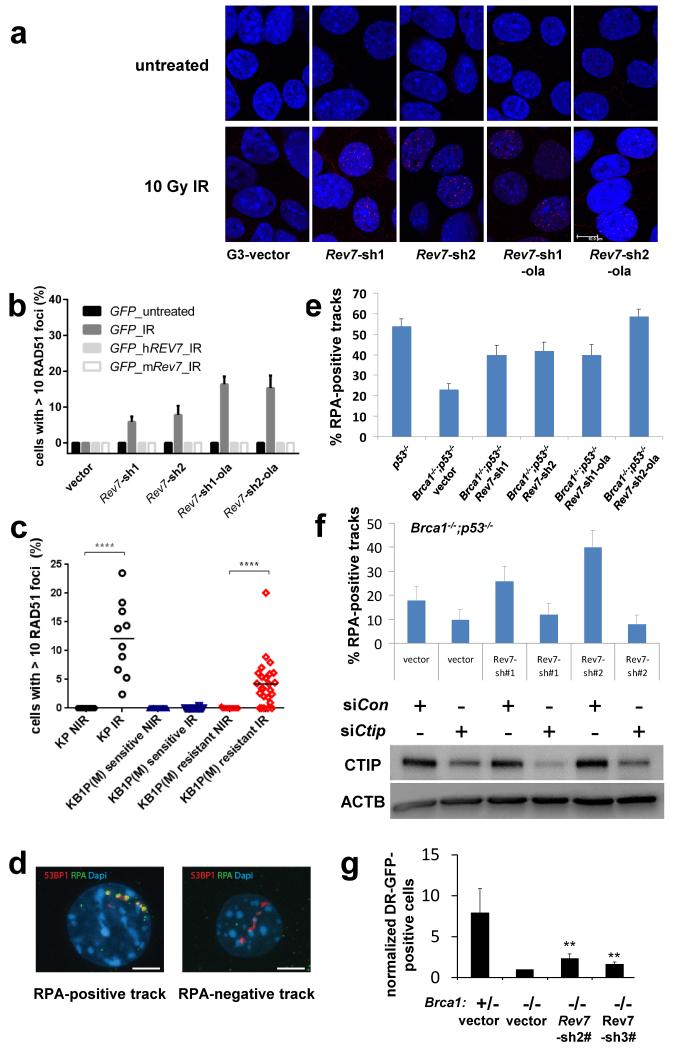
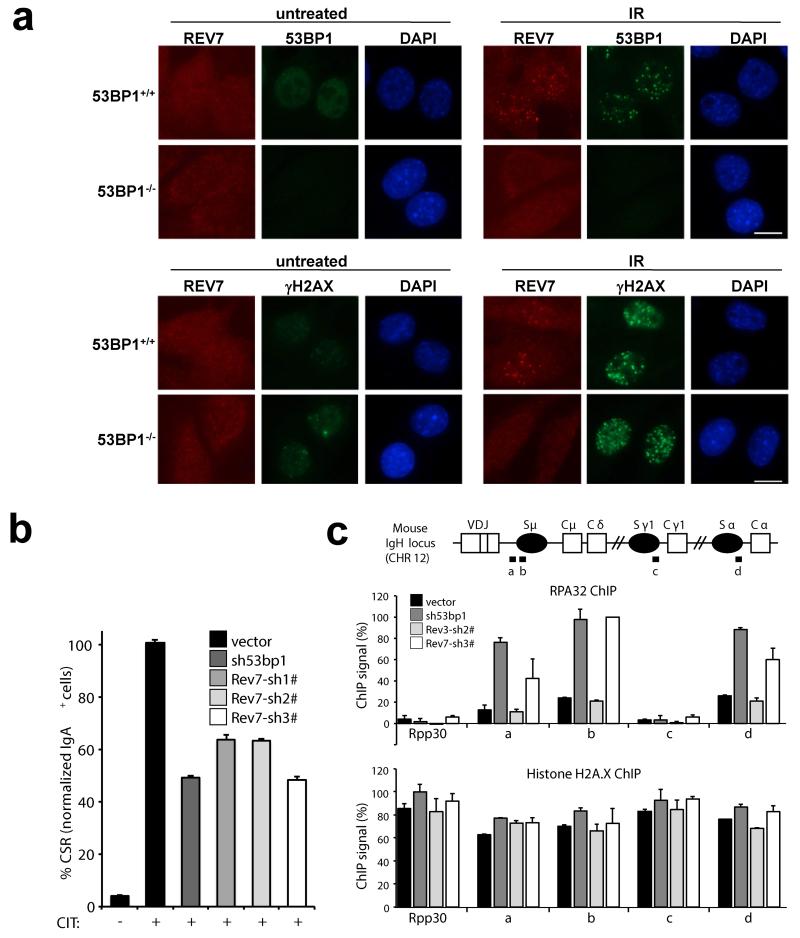
Error-free repair of DNA double-strand breaks (DSBs) is achieved by homologous recombination (HR), and BRCA1 is an important factor for this repair pathway. In the absence of BRCA1-mediated HR, the administration of PARP inhibitors induces synthetic lethality of tumour cells of patients with breast or ovarian cancers. Despite the benefit of this tailored therapy, drug resistance can occur by HR restoration. Genetic reversion of BRCA1-inactivating mutations can be the underlying mechanism of drug resistance, but this does not explain resistance in all cases. In particular, little is known about BRCA1-independent restoration of HR. Here we show that loss of REV7 (also known as MAD2L2) in mouse and human cell lines re-establishes CTIP-dependent end resection of DSBs in BRCA1-deficient cells, leading to HR restoration and PARP inhibitor resistance, which is reversed by ATM kinase inhibition. REV7 is recruited to DSBs in a manner dependent on the H2AX-MDC1-RNF8-RNF168-53BP1 chromatin pathway, and seems to block HR and promote end joining in addition to its regulatory role in DNA damage tolerance. Finally, we establish that REV7 blocks DSB resection to promote non-homologous end-joining during immunoglobulin class switch recombination. Our results reveal an unexpected crucial function of REV7 downstream of 53BP1 in coordinating pathological DSB repair pathway choices in BRCA1-deficient cells.


Figures

Extended Data Figure 1
Extended Data Figure 1. Loss of Rev7 causes PARPi resistance in vitro and in vivo
a, Quantification of Rev7 transcript levels in KB1P-B11 cells transduced with Rev7-targeting shRNAs or the vector control. Hprt was used as a control for transcript expression. The data represent the mean ± SD. b-c, Cell proliferation rates in KB1P-G3 (b) or –B11 (c) cells analyzed using the MTT assay. d-g, Long-term clonogenic survival assays and quantification of KB1P-G3 (d, f) or –B11 (e, g) cells transduced with the indicated constructs and treatments. All the groups were normalized by the absorbance of the vector control. The data represent the mean ± SD. h, Quantification of the real colony numbers from the short term clonogenic survival assay of KB1P-G3 cells with or without Rev7 loss exposed to olaparib. i, REV7 protein levels were determined by Western Blotting of lysates derived from KB1P-G3 cells transduced with the indicated constructs. j, Overall survival of mice with KB1P-B11-derived Rev7-depleted or control tumors treated with one regimen of 50 mg/kg olaparib daily for 28 days or left untreated. The P value was calculated using the log-rank test. k, l, relative tumor growth of individual KB1P-G3 (k) and KB1P-B11 (l)-derived Rev7-depleted or control tumors treated with one regimen of 50 mg/kg olaparib daily for 28 days or left untreated.
Extended Data Figure 2
Extended Data Figure 2. Loss of REV7 causes olaparib resistance in BRCA1-deficient SUM149PT cells
a, Western Blotting analysis of REV7 or 53BP1 expression in SUM149PT cells transduced with REV7- or 53BP1-targeting hairpins or the vector control. b, Example of a long-term clonogenic survival assay using the indicated hairpins and olaparib concentrations. c, Quantification of the clonogenic assays using absorbance of crystal violet at 590nm. The data represent the mean ± SD. All the groups were normalized by the absorbance of the vector control and showed significant differences to the control (P< 0.01, t-test).
Extended Data Figure 3
Extended Data Figure 3. Rev1 or Rev3 inhibition and PARPi sensitivity of Brca1−/−; p53−/− mammary tumor cells
a-b, Quantification of Rev1 (a) or Rev3 (b) transcript levels in KB1P-G3 cells transduced with Rev1-or Rev3-targeting shRNAs or the vector control. Hprt was used as a control for transcript expression. The data represent the mean ± SD. c, Long-term clonogenic survival assays of KB1P-G3 cells exposed to the indicated PARP inhibitors. d, Quantification of the clonogenic assay by determining the absorbance of crystal violet at 590 nm. All the groups were normalized by the absorbance of the vector control. The data represent the mean ± SD. e-f, Quantification of Rev7 transcript (e) or protein (f) levels in KB1P-G3 cells transduced with Rev7-targeting shRNAs or the vector control. Hprt was used as a control for transcript expression. The data represent the mean ± SD. g, GFP-tagged REV7 mutants recruitment to sites of DNA damage was observed 5 min after 405 nm laser exposure (0.99mW, 60% laser power, 50 seconds) in KB1P-B11 cells. Scale bar, 10μm.
Extended Data Figure 4
Extended Data Figure 4. REV7 recruitment to the DNA damage sites in human cells
a-d, Human REV7 recruitment to sites of laser-induced DNA damage were analyzed in siRNF8, siRNF168 (a) si53BP1 (c) and siGFP U2OS cells. RNF8 and RNF168 protein levels were determined by Western Blotting (b) using lysates derived from U2OS cells transfecting with the indicated siRNAs. For the quantification of the REV7 signal within laser-induced DNA damage stripes (d), a minimum of 100 striped cells (meaning yH2AX positive) were analyzed for the presence of the REV7 signal in two independent experiments. White scale bars = 50 μm. e, RAD51 focus (red) formation in KB1P-B11 cells before and 5h post IR (10 Gy). Scale bar, 10 μm. f, Quantification of RAD51 foci in KB1P-B11 cells in the presence or absence of REV7 depletion. At least 150 cells were analyzed per group in 3 independent experiments each. Error bars indicate SD; IR= 5h post 10 Gy. g, Western Blotting analysis of REV7-depleted KB1P-G3 cells transfected with human REV7-GFP or shRev7 resistant mouse Rev7-GFP fusion proteins. h, Same assay as in (e, f) using the ATM inhibitor KU55933 with or without IR (5h post 10 Gy). i, Long-term clonogenic survival assay of KB1P-G3 cells exposed to olaparib in the presence or absence of KU55933 pretreatment.
Extended Data Figure 5
Extended Data Figure 5. Loss of Rev7 does not cause PARPi resistance in Brca2−/−; p53−/− or p53−/− mammary tumor cells in vitro
a, b, Quantification of Rev7 transcript levels in Brca2−/−;p53−/− (KB2P_1.21 or KB2P_3.4) cells transduced with Rev7-targeting shRNAs or the vector control. Hprt was used as a control for transcript expression. The data represent the mean ± SD. c-f, Long-term clonogenic survival assays and quantification of KB2P_1.21 or KB2P_3.4 cells with or without Rev7 depletion exposed to the indicated treatments. All the groups were normalized by the absorbance of the vector control. The data represent the mean ± SD. g, Quantification of Rev7 transcript levels in p53−/− (KP3.33) cells transduced with the indicated constructs. Hprt was used as a control for transcript expression and the data represent the mean ± SD. h, i, Long-term clonogenic survival assays and quantification of KP3.33 cells exposed to the indicated treatments. The data represent the mean ± SD.
Extended Data Figure 6
Extended Data Figure 6. Rev7 loss promotes end resection at DSBs in BRCA1-deficient cells after IR
a, Quantification of RPA positive alpha tracks in KB1P-B11 cells 1h or 2h after irradiation with alpha particles. b, Quantification of RPA and 53BP1-positive alpha tracks in KB1P-B11 cells transfected with non-targeting control siRNAs or siRNAs against CtIP. c, Cell cycle analysis (BrdU incorporation and propidium iodine labeling) of KB1P-B11 cells transduced with the indicated constructs and siRNAs. . d, e, Quantification of Rev7 transcript (d) or protein (e) levels in BRCA1-deficient mES cells transduced with Rev7-targeting shRNAs or the vector control. Hprt was used as a control for transcript expression. The data represent the mean ± SD. f, Representative images of surviving colonies of Brca1−/− mES cells transduced with an empty vector control or Rev7-targeting shRNAs. g, Quantification of colony formation normalized to the vector control. h, Quantification of RAD51 foci in Brca1−/− mES cells that were transduced with the indicated constructs.
Extended Data Figure 7
Extended Data Figure 7. REV7 loss frequently occurs in triple-negative breast cancer
a, b, Quantification of hREV7 transcript levels (a) and protein levels (b) in U2OS cells transduced with indicated constructs. 2 different pairs of primers for hREV7 or hHPRT were used for the quantification of hREV7 transcript levels. c-e, Examples of aberrantly reduced REV7 protein expression in triple-negative human breast carcinomas. Immunohistochemical detection of REV7 in human breast carcinomas shows moderate to high nuclear expression in normal human breast tissue (data not shown) and the majority of invasive breast tumors (c). Aberrant reduction of REV7 with less than 70% of cancer cells that show nuclear positivity (d, e) was observed in 18/50 cases.
Extended Data Figure 8
Extended Data Figure 8. REV7 is a downstream effector of 53BP1
a, Quantification of 53BP1 focus in KB1P-G3 cells in the presence or absence of REV7 depletion. At least 100 cells were analyzed per group in 3 independent experiments each. Error bars indicate SD; IR= 5h post 10 Gy. b, REV7 or 53BP1 protein levels were determined by Western Blotting of lysates derived from MEF cells transduced with the indicated constructs. c, d, RIF1 foci formation (c) following neocarzinostatin treatment and quantification of RIF1 focus (d) in MEF cells in the presence or absence of REV7 or 53BP1 depletion. e, Flag-pulldowns were performed from 2 mg lysate prepared from 53BP1−/−, 53BP1−/−+53BP1 and 53BP1−/−+53BP120AQ MEFs following mock or NCS treatment. Control, 53BP1, and 53BP120AQ immunoprecipitates were incubated in Hela Nuclear Extract (HNE, 2mg) and then eluted with triple-Flag peptide.
Extended Data Figure 9
Extended Data Figure 9. The effect of REV7 inhibition on CSR after antigenic stimulation of CH12 cells
a, Rev7 mRNA levels determined by qRT-PCR were normalized against β-actin transcripts in the indicated shRNA-transduced CH12 cell-lines. The data represent the mean ± SEM from two primer sets specific for Rev7 transcript. b, 53BP1 protein of each group normalized to vector-transduced cells (CH12) was analyzed by Western Blotting. c, IgH μ and α germline transcripts and AID (Aicda) mRNA were estimated by semi-quantitative RT-PCR using 2-fold serial dilutions of cDNA made from indicated CH12 cell-lines 40 h following stimulation. Hprt was used as a control for transcript expression. d, Representative flow cytometric profiles of shRNA-transduced CH12 B-cells stained with anti-IgA antibody 40 h following stimulation with indicated cytokines. e, Cells (CH12) were labeled with CFSE immediately before cytokine stimulation as in figure 4d, and cell proliferation was assessed by flow cytometry at indicated time points. f, Quantification of CSR to IgA of shRNA-transduced CH12 cells 40h post stimulation with CD40Ab, IL-4, TGFβ-1 (CIT). Data represent the mean ± SD from 2 independent experiments performed in triplicate.
Figure 1
Figure 1. Identification of loss of Rev7 in PARPi-resistant Brca1−/−; p53−/− mammary tumor cells
a, Design of the functional shRNA screen. b, c, Quantification of Rev7 transcript (b) or protein (c) levels in KB1P-G3 cells transduced with Rev7-targeting shRNAs or the vector control. Hprt was used as a control for transcript expression. The data represent the mean ± SD. d, e, Long-term clonogenic assay using KB1P-G3 cells transduced with the indicated constructs (wt Rev7 stands for pLenti6-wt Rev7) and treatments. f, Quantification of the clonogenic assay (e) by determining the absorbance of crystal violet at 590nm. All the groups were normalized by the absorbance of the vector control. The data represent the mean ± SD. g, Overall survival of mice with KB1P-G3-derived Rev7-depleted or control tumors treated with one regimen of 50 mg olaparib per kg daily for 28 days or left untreated. The P value was calculated using the log-rank test.
Figure 2
Figure 2. Dissection of REV7 function and its dependent factors
a, b, Long-term clonogenic assay (a) and quantification (b) using KB1P-G3 cells transduced with the indicated constructs (wt Rev7 stands for pMSCV-GFP-wt Rev7) and treatments. All the groups were normalized by the absorbance of the shRev7-GFP control. The data represent the mean ± SD. c, GFP-REV7 recruitment to sites of DNA damage (visualized by 53BP1-mCherry) was observed 5 min after 405 nm laser exposure (0.99mW, 60% laser power, 50 seconds) in KB1P-B11 cells. Scale bar, 5μm. d, REV7 foci formation in H2AX−/−, ATM−/−, MDC1−/− and RNF8−/− MEF cells and their corresponding controls before and 4h post IR (10 Gy). Scale bar, 10μm. e, Quantification of REV7 foci formation (>8 foci per cell) in ATM−/− and ATM+/+ MEF cells. The quantification of foci-positive cells was performed by counting a total of 100 cells per sample. Data are presented as mean ± SD from 3 different experiments. The P value was calculated using the t-test.
Figure 3
Figure 3. The effect of REV7 inhibition on RAD51 and RPA focus formation of Brca1−/−; p53−/− cells
a, RAD51 focus (red) formation in KB1P-G3 cells before and 5h post IR (10 Gy). Scale bar, 10μm. b, Quantification of RAD51 foci in KB1P-G3 cells (with or without REV7 depletion) transfected with an empty vector (GFP) or vectors containing mouse or human Rev7/REV7. At least 150 GFP-positive cells were analyzed per group in 3 independent experiments each. The data represent the mean ± SD. IR= 5h post 10 Gy. c, In situ analysis of RAD51 foci in PARPi-resistant KB1P(M) tumors with a low Rev7 gene expression. IR= 2h post 15Gy, NIR= no IR, **** P value < 0.0001 (Mann-Whitney test). d, e, Representative examples of images (d) of 53BP1-labelled alpha tracks in cells positive or negative for RPA and quantification of RPA-positive tracks 2h post IR (e). KP (p53−/−) or KB1P-G3 cells with or without Rev7-targeting shRNAs were tested. Scale bar, 5μm. f, Quantification of RPA and 53BP1-positive alpha tracks in KB1P-G3 cells transfected with non-targeting control siRNAs or siRNAs against CtIP. CTIP protein expression of the indicated groups was checked by Western blotting. g, Quantification of HR using the DR-GFP reporter assay. GFP-positive cells normalized to the vector-transduced Brca1−/−; shp53; cells are shown. The data represent the mean ± SD. The P values (** P<0.01) were calculated using the t-test (2-tailed).
Figure 4
Figure 4. REV7 is a downstream effector of 53BP1 on inhibiting end resection and promoting CSR
a, REV7 foci formation in 53bp1−/− and 53bp1+/+ MEF cells before and 4h post IR (10 Gy). Scale bar, 10μm. b, Quantification of CSR to IgA of shRNA-transduced CH12 cells 40h post stimulation (CD40Ab, IL-4, TGFβ-1; CIT). Data represent the mean ± SD from two independent experiments performed in triplicate. c, Schematic of IgH locus shows relative positions of qPCR amplicons used in ChIP experiments. A control non- IgH locus (Rpp30) was also examined. Indicated CH12 cell-lines stimulated for 30 h with CIT were subjected to ChIP with IgG (control), histone H2A.X, and RPA32 monoclonal antisera. Following background subtraction, values were normalized to the DNA input signals, followed by the maximum value in each data set. Mean signals, two replicates ± SEM.

Comment in

Similar articles

Cited by

References

    1. Roy R, Chun J, Powell SN. BRCA1 and BRCA2: different roles in a common pathway of genome protection. Nat. Rev. Cancer. 2012;12:68–78. - PMC - PubMed
    1. Lee J-M, Ledermann JA, Kohn EC. PARP Inhibitors for BRCA1/2 mutation-associated and BRCA-like malignancies. Ann. Oncol. Off. J. Eur. Soc. Med. Oncol. ESMO. 2013 doi:10.1093/annonc/mdt384. - PMC - PubMed
    1. Farmer H, et al. Targeting the DNA repair defect in BRCA mutant cells as a therapeutic strategy. Nature. 2005;434:917–921. - PubMed
    1. Lord CJ, Ashworth A. Mechanisms of resistance to therapies targeting BRCA-mutant cancers. Nat. Med. 2013;19:1381–1388. - PubMed
    1. Ang JE, et al. Efficacy of chemotherapy in BRCA1/2 mutation carrier ovarian cancer in the setting of PARP inhibitor resistance: a multi-institutional study. Clin. Cancer Res. Off. J. Am. Assoc. Cancer Res. 2013;19:5485–5493. - PubMed

Publication types

MeSH terms

Substances