. 2015 May 21;521(7552):366-70.
doi: 10.1038/nature14289. Epub 2015 Mar 18.

Pioneer factors govern super-enhancer dynamics in stem cell plasticity and lineage choice

Affiliations

Pioneer factors govern super-enhancer dynamics in stem cell plasticity and lineage choice

Rene C Adam et al. Nature. .

Abstract

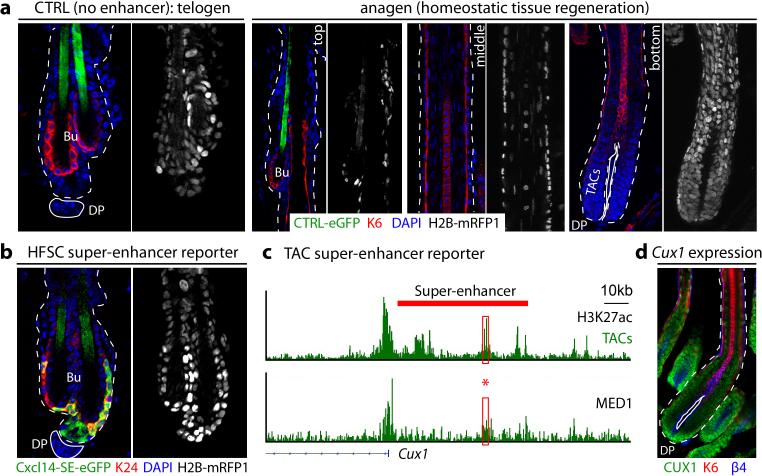
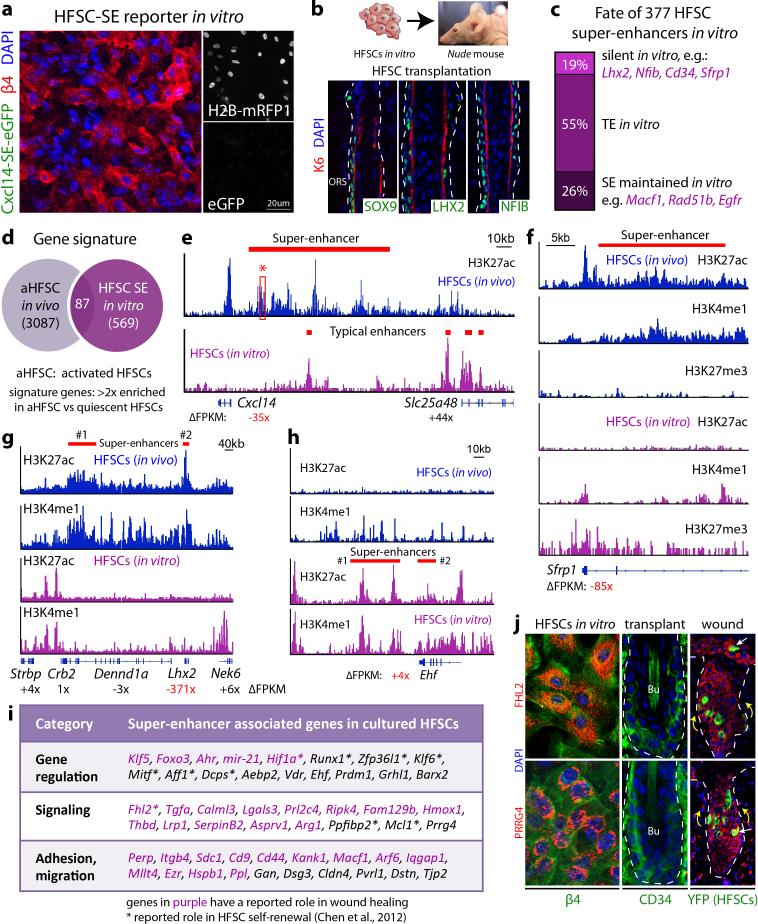
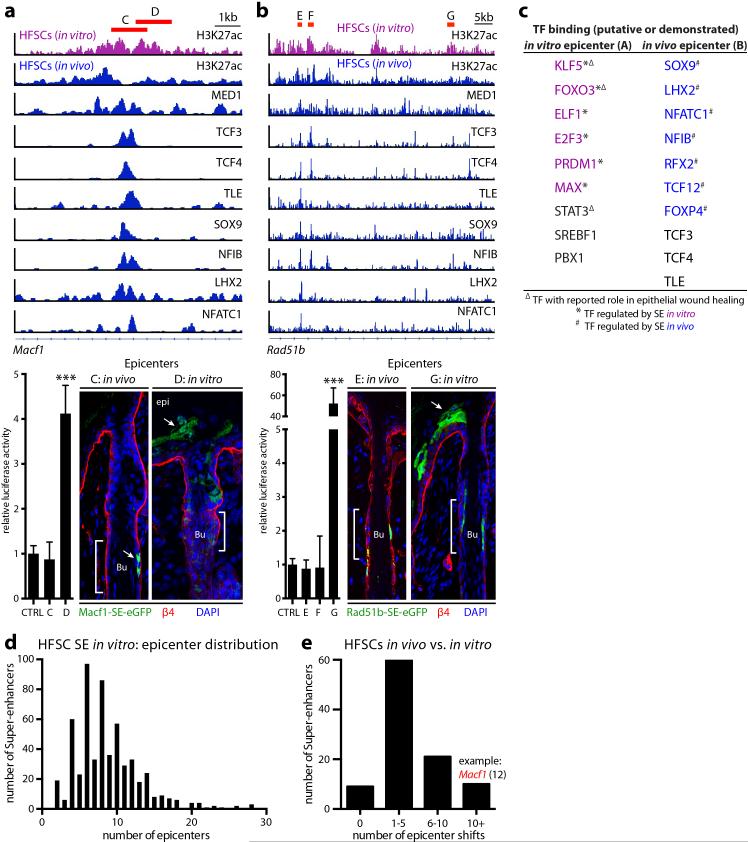
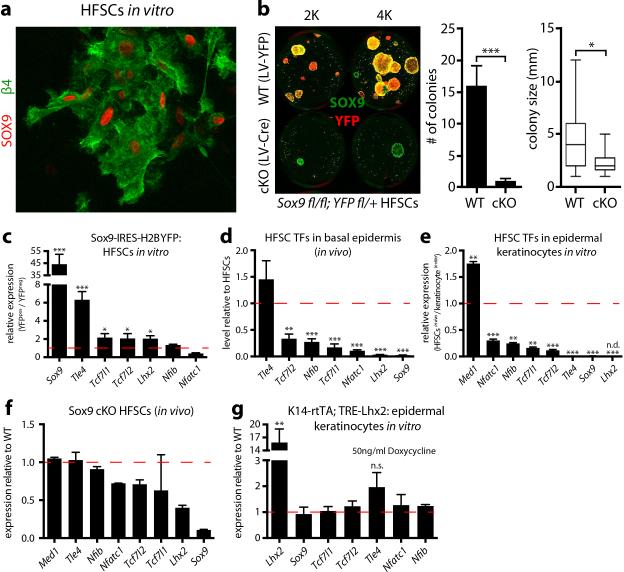
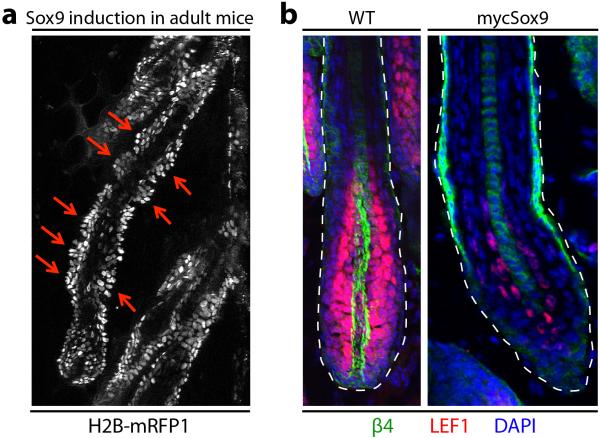
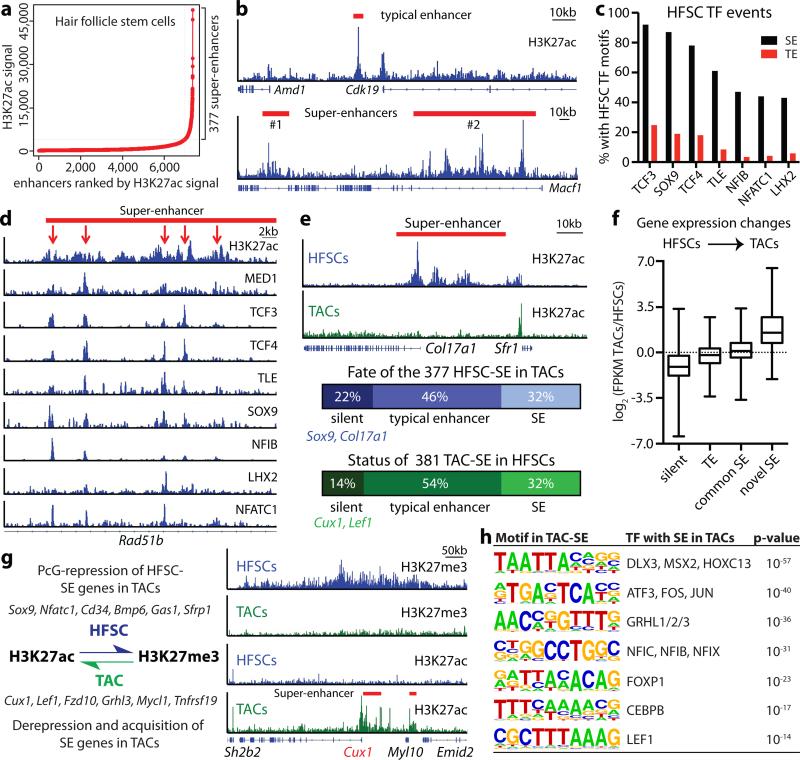
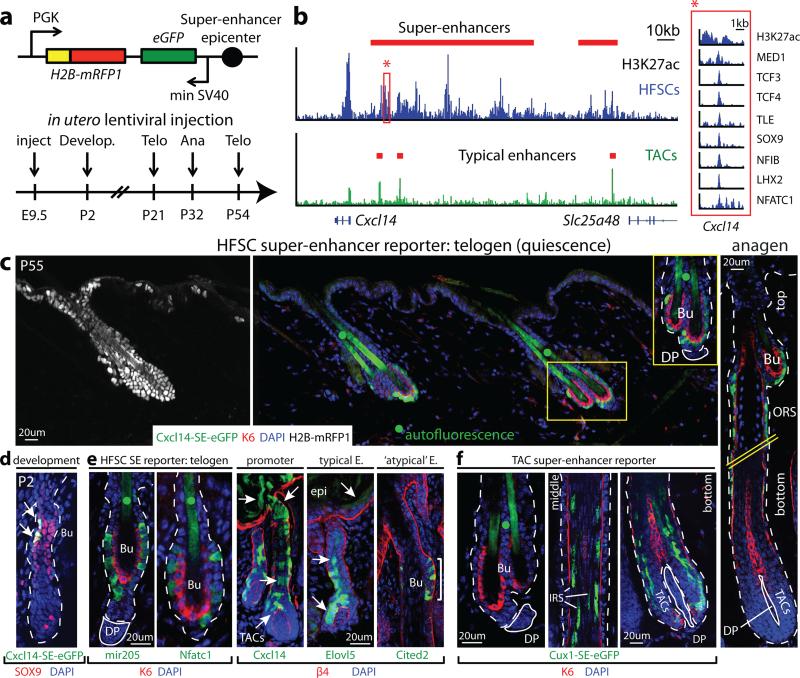
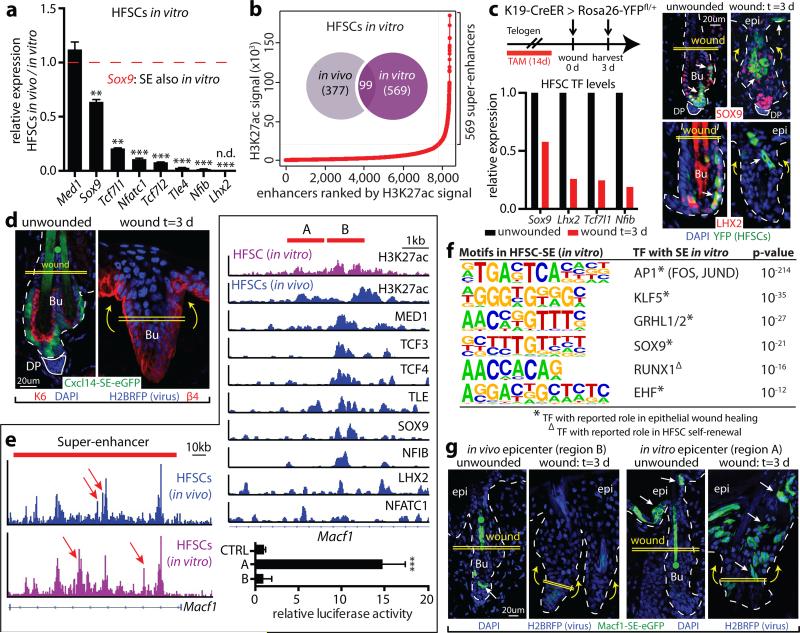
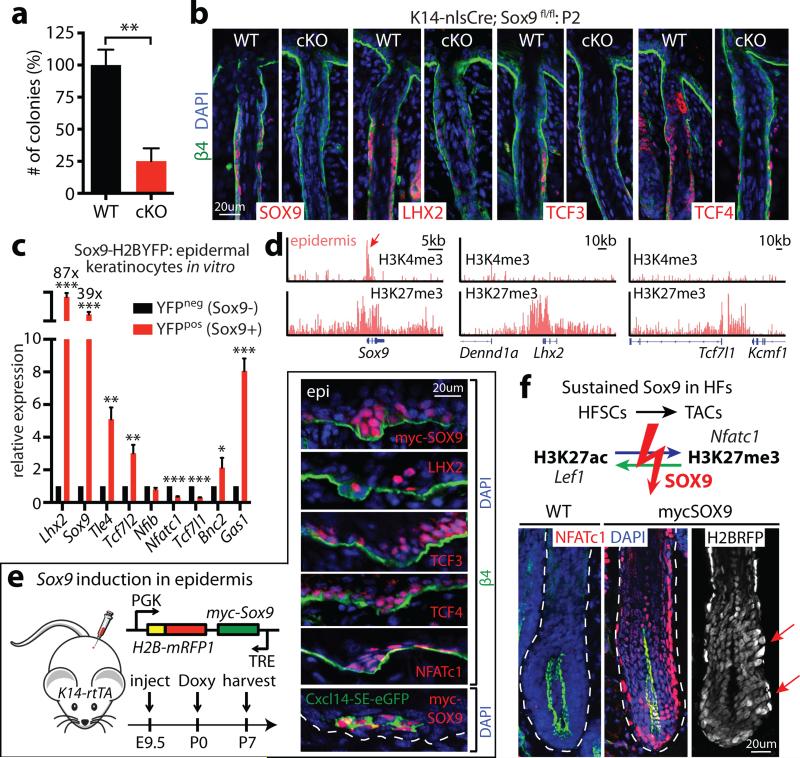
Adult stem cells occur in niches that balance self-renewal with lineage selection and progression during tissue homeostasis. Following injury, culture or transplantation, stem cells outside their niche often display fate flexibility. Here we show that super-enhancers underlie the identity, lineage commitment and plasticity of adult stem cells in vivo. Using hair follicle as a model, we map the global chromatin domains of hair follicle stem cells and their committed progenitors in their native microenvironments. We show that super-enhancers and their dense clusters ('epicentres') of transcription factor binding sites undergo remodelling upon lineage progression. New fate is acquired by decommissioning old and establishing new super-enhancers and/or epicentres, an auto-regulatory process that abates one master regulator subset while enhancing another. We further show that when outside their niche, either in vitro or in wound-repair, hair follicle stem cells dynamically remodel super-enhancers in response to changes in their microenvironment. Intriguingly, some key super-enhancers shift epicentres, enabling their genes to remain active and maintain a transitional state in an ever-changing transcriptional landscape. Finally, we identify SOX9 as a crucial chromatin rheostat of hair follicle stem cell super-enhancers, and provide functional evidence that super-enhancers are dynamic, dense transcription-factor-binding platforms which are acutely sensitive to pioneer master regulators whose levels define not only spatial and temporal features of lineage-status but also stemness, plasticity in transitional states and differentiation.


Figures

Extended Data Figure 1
Extended Data Figure 1. FACS purification strategy to isolate HFSCs and TACs
a, FACS purification of WT HFSCs for ChIP-Seq according to established markers α6hi and CD34+ . Sca1 is used to remove basal epidermal cells. b, FACS purification of TACs from Krt14-H2B-GFP mice. TACs are GFPlow Sca1- α6low/- CD34-. c, Epifluorescence of Krt14-driven H2B-GFP. HFSCs and epidermal cells are GFPhi, whereas TACs are GFPlow. d, q-PCR to verify the FACS sorting strategy and measure enrichment of cell-type specific marker genes. Mean and standard deviation are shown (n = 3). P-values from t-test: *P<0.05; **P<0.01; ***P<0.001, relative to HFSCs.
Extended Data Figure 2
Extended Data Figure 2. Enhancer distribution, size and gene assignment in HFSCs
a, Distribution of H3K27ac occupancy at promoter and enhancers in HFSCs. b, Distribution of typical and super-enhancers in HFSCs. c, Enhancer size distribution in HFSCs. d, Number of individual H3K27ac peaks per gene. Super-enhancers are clusters of H3K27ac peaks and mainly consist of ≥5 peaks per gene. e, f, Enhancer-gene assignments, exemplified by HFSC-SEs Fzd6 and Btg2. FPKM, fragments per kilobase of transcript per million mapped reads (RNA-seq). g, Differential expression for genes driven by HFSC-SEs and TEs. P-values from t-test: ***P<0.001. h, Density plot, contrasting expression levels of TE- versus SE-associated HFSC genes in HFSCs compared to epidermal progenitors. Note cell type-specific differences in expression for HFSC genes controlled by super-enhancers but not typical enhancers. i, Gene Ontology analysis of genes controlled by HFSC enhancers. j, List of selected SE-regulated HFSC genes. SE, super-enhancer; TE, typical enhancer.
Extended Data Figure 3
Extended Data Figure 3. HFSC-TFs are enriched within super-enhancers and cluster in epicenters
a, b, Enrichment of HFSC TFs within chromatin of super-enhancers, but not typical enhancers. Comparisons were made with 377 randomly selected typical enhancers and their flanking sequence extended 5’ and 3’ to match the average length of super-enhancers (average of 3 analyses is shown). Each ‘TF event’ (a) represents one HFSC-TF bound within a SE. ‘TF peaks’ (b) refers to the absolute amount of TFs occupying the SE. c, Heatmap showing ChIP-seq read densities (from -5kb to +5kb of peak center) across H3K27ac peaks located in SEs. Note that HFSC-TFs frequently bound densely together with strong H3K27ac peaks. d, Motif analysis of HFSC-SEs for putative TF binding sites. e, Analysis of distance of H3K27ac peaks to their nearest transcription factor ChIP-seq peaks in HFSCs in vivo (distance of the two peak centers). Note that enrichment of TF binding occurs within 1-kb regions of H3K27ac peaks (‘epicenters’). f, Frequency and distribution of HFSC-SE epicenters. g, Rare ‘atypical’ enhancers co-bound by 7 HFSC-TFs are more highly expressed in HFSCs versus committed progenitors.
Extended Data Figure 4
Extended Data Figure 4. Identification of super-enhancers in TACs
a, Distribution of H3K27ac ChIP-seq signal across all enhancers in transit-amplifying cells (TACs) reveals 381 super-enhancers of little overlap with HFSC super-enhancers. b, Tracking the status of TAC super-enhancers in HFSCs indicates striking enhancer remodeling upon lineage progression. Example shows the appearance of a de novo super-enhancer for the Dlx3/4 locus as HFSCs commit to a TAC fate. c, Examples of super-enhancer associated genes in TACs. Genes in green have a reported function in HFs.
Extended Data Figure 5
Extended Data Figure 5. Super-enhancer reporters drive cell-type specific expression
a, The lentiviral CTRL reporter construct (containing no enhancer) is silent throughout all stages of the hair cycle, despite efficient infection (as evidenced by H2B-mRFP1). b, Immunofluorescence showing that Cxcl14-eGFP super-enhancer reporter activity co-localizes with Krt24+ HFSCs. DP, dermal papilla; Bu, Bulge. White dashed lines denote the epidermal-dermal border; solid lines delineate the DP. c, H3K27ac and MED1 ChIP-seq occupancy at the Cux1 locus in TACs. Red box shows the SE epicenter that was cloned for reporter assays. Note that epicenters bound by MED1 are sufficient to identify cell-stage specific loci, even without prior information about lineage-specific TFs. d, CUX1 expression pattern in hair follicles.
Extended Data Figure 6
Extended Data Figure 6. HFSCs adapt to microenvironmental changes by reversible remodeling of super-enhancers
a, Absence of Cxcl14-SE-eGFP reporter activity in transduced cultured HFSCs. b, Transplanted cultured HFSCs establish de novo HFs and regain expression of HFSC-TFs. c, Note extensive HFSC-SE-remodeling upon culture conditions. d, HFSCs in vitro are molecularly distinct from activated HFSCs (aHFSC) in vivo. e-h, H3K27ac levels at the Cxcl14, Sfrp1, Lhx2 and Ehf loci in HFSCs in vivo and in vitro. Note the dynamic regulation of super-enhancers and the resulting changes in gene expression. i, Selected list of super-enhancer associated genes in HFSCs in vitro. j, Note HFSC-SE plasticity in vitro and during wound repair: Fhl2 and Prrg4 display SE-mediated activity in vitro. Upon transplantation, HFSCs silence in vitro-induced genes concomitant with HF regeneration. However, during wounding, HFSCs (lineage marked with K19-CreER/R26YFP) regain expression of Fhl2 and Prrg4.
Extended Data Figure 7
Extended Data Figure 7. HFSCs activate different epicenters within super-enhancers to sustain expression of critical genes in different microenvironments
a, b, H3K27ac and HFSC-TF ChIP-seq occupancies at the Macf1 and Rad51b loci in HFSCs in vivo and in vitro. Regions C, E and F mark epicenters active in vivo, richly bound by HFSC-TFs; adjacent regions D and G are novel epicenters active in vitro. Relative luciferase activities were driven by the 1-1.5kb encompassing these epicenters. Mean and standard deviation are shown (n = 3). P-values from t-test: ***P<0.001. Functional validation of epicenter shifts in vivo. eGFP-reporter activity of in vitro epicenters is highly active in the epidermis while physiological HFSC epicenters are restricted to the HF niche. c, Motif analysis of Macf1 epicenters (Regions A and B, Fig. 3e) for putative TF binding sites. d, Number and distribution of HFSC-SE epicenters in vitro. e, Frequency of epicenter shifts in HFSC-SEs (in vivo versus in vitro). Note that corresponding to the loss of HFSC-TFs in vitro, many SEs display epicenter shifts to maintain expression of critical genes (e.g. Macf1) in different microenvironments.
Extended Data Figure 8
Extended Data Figure 8. HFSC TFs are reduced outside the niche but are sensitive to Sox9 levels
a, SOX9 is expressed and displays nuclear localization in HFSCs in vitro. b, Colony formation assays on WT and Sox9-cKO HFSCs. Sox9fl/fl Rosa26YFPfl/+ HFSCs were seeded at 2K and 4K and transduced with lentiviral-Cre to achieve Sox9 ablation in vitro. All yellow and green colonies were not effectively targeted and are still SOX9+. All red colonies (SOX9-negative) aborted, as revealed by quantifications of colony numbers and sizes shown at right. c, Sox9-overexpression in cultured HFSCs. SOX9 induces the expression of Tle4, Tcf7l1, Tcf7l2 and Lhx2. d, e, HFSC TFs are expressed at substantially lower levels in basal epidermal progenitors in vivo or in cultured epidermal keratinocytes relative to HFSCs. f, Down-regulation of HFSC TFs in Sox9-cKO HFSCs in vivo before HFSCs are lost. g, Doxycycline-inducible overexpression of Lhx2 in cultured epidermal keratinocytes does not induce HFSC TFs. For b-g, mean and standard deviation are shown (n = 3). P-values from t-test: *P<0.05; **P<0.01; ***P<0.001; n.d., not detected; n.s., not significant.
Extended Data Figure 9
Extended Data Figure 9. Sustained Sox9 expression in committed progenitors perturbs lineage progression
a, Sustained Sox9 in adult mice (Doxycycline for 3 weeks in adult mice, starting at P21) leads to de novo formation of minibulge-like structures along the ORS. b, Immunofluorescence showing that Lef1 (normally H3K27me3 repressed in HFSCs, but H3K27ac super-enhancer induced in TACs) remains repressed in mycSOX9+ HFs.
Figure 1
Figure 1. Dynamic super-enhancer remodeling facilitates lineage progression
a, Identification of H3K27ac super-enhancers in HFSCs. b, H3K27ac-marked enhancers at Cdk19 and Macf1 loci in HFSCs. c, Occupancy of HFSC-TFs within enhancers. d, Clustering of HFSC-TFs occurs in epicenters (red arrows) within super-enhancers. e, Dynamic remodeling of super-enhancers during lineage progression. f, Enhancer remodeling correlates with gene expression changes. g, Cell fate determinants switch between SE-activation and PcG-repression, typified by a swap in H3K27 modifications. Representative example (Cux1) shows this switch upon HFSC→TAC fate commitment. h, Motif analysis of TAC super-enhancers for putative TF binding sites. SE, super-enhancer; TE, typical enhancer.
Figure 2
Figure 2. Super-enhancer epicenters confer tissue, lineage and temporal specificity
a, Lentiviral super-enhancer reporter and analysis scheme. Telo: Telogen (quiescent HFSCs; no TACs, no hair growth); Ana: anagen (active TACs, hair growth). b, H3K27ac occupancy at the Cxcl14 locus. Red box highlights the Cxcl14-SE epicenter (bound by MED1 and 7 HFSC-TFs; absent in TACs) cloned for reporter assays. c, Cxcl14-SE-eGFP expression in H2B-mRFP+ epidermis is limited to HFSCs and early HFSC progeny along upper ORS in anagen (right). Hatched lines denote spliced out middle-region of HF. d, Temporal activation of Cxcl14-SE-eGFP in SOX9+ cells, concomitant with HFSC niche establishment at P2. e, HFSC-specific targeting by mir205- and Nfatc1-SE-epicenters, whereas Cxcl14-promoter and Elovl5-TE display broader activity. Atypical Cited2-TE binds all 7 HFSC-TFs and drives HFSC-specific targeting. f, Cux1-SE-eGFP is silent in HFSCs, but activated during the hair cycle in TACs and differentiating IRS progeny. Dotted lines denote epidermal-dermal border; solid lines delineate DP (dermal papilla). Bu, bulge (HFSC niche). • denotes hair shaft autofluorescence.
Figure 3
Figure 3. The sensitivity of super-enhancers to environmental changes allows HFSC adaptation and plasticity
a, Repression of HFSC-TF genes in vitro. Mean and standard deviation are shown (n = 3). P-values from t-test: **P<0.01; ***P<0.001; n.d., not detected. b, Super-enhancers in HFSCs show little overlap in vivo and in vitro. c, Down-regulation of HFSC-TFs during wound-repair in K19-CreER(HFSC-specific)/R26YFP mice. SOX9 is present in migrating HFSCs at reduced levels. d, Cxcl14-SE-eGFP reporter is repressed in wound-induced HFSCs. e, In vivo versus in vitro HFSC differences in H3K27ac peak (epicenter) distributions (arrows) of Macf1's super-enhancer. One epicenter shift is magnified at right. Region B represents an epicenter active in vivo, richly bound by HFSC-TFs; adjacent region A is an epicenter active in vitro. Mean and standard deviation of relative luciferase activities are shown below (n = 3). P-value from t-test: ***P<0.001. f, Motif analysis for TF binding sites of in vitro HFSC-SEs. g, Functional validation of epicenter shifts in mice transduced with Macf1-SE-eGFP reporters. Note dynamic changes in reporter activity upon wounding.
Figure 4
Figure 4. SOX9 is a pioneer factor governing HFSC fate and plasticity
a, Colony formation assays on WT and Sox9-cKO HFSCs. Mean and standard deviation are shown (n = 3). P-value from t-test: **P<0.01. b, HFSC-specification fails in Sox9-cKO mice. c, Ectopic Sox9 in epidermal keratinocytes induces HFSC-SE genes. Mean and standard deviation are shown (n = 3). P-values from t-test: *P<0.05; **P<0.01; ***P<0.001. d, HFSC-TF genes Lhx2 and Tcf7l1 are PcG-repressed in epidermis, while Sox9 is poised. e, Forced in vivo expression of Sox9 in epidermal progenitors activates HFSC-TF genes. Note induction of HFSC-SE regulated Cxcl14-SE-eGFP. f, Sustained SOX9 during HF regeneration. Note prevention of swap in H3K27 modifications of key SEs upon TAC fate commitment. NFATc1 atypically persists in lower ORS and TACs, and minibulge-like structures occur along ORS (arrows).

References

    1. Spradling A, Drummond-Barbosa D, Kai T. Stem cells find their niche. Nature. 2001;414:98–104. - PubMed
    1. Lopez-Garcia C, Klein AM, Simons BD, Winton DJ. Intestinal stem cell replacement follows a pattern of neutral drift. Science. 2010;330:822–825. doi: 810.1126/science.1196236. Epub 1192010 Sep 1196223. - PubMed
    1. van Es JH, et al. Dll1+ secretory progenitor cells revert to stem cells upon crypt damage. Nat Cell Biol. 2012;14:1099–1104. doi: 1010.1038/ncb2581. Epub 2012 Sep 1023. - PMC - PubMed
    1. Blanpain C, Fuchs E. Stem cell plasticity. Plasticity of epithelial stem cells in tissue regeneration. Science. 2014;344:1242281. doi: 1242210.1241126/science.1242281. Epub 1242014 Jun 1242212. - PMC - PubMed
    1. Whyte WA, et al. Master transcription factors and mediator establish super-enhancers at key cell identity genes. Cell. 2013;153:307–319. doi: 310.1016/j.cell.2013.1003.1035. - PMC - PubMed

Publication types

Associated data