Review
. 2016 Feb;173(4):649-65.
doi: 10.1111/bph.13139. Epub 2015 May 11.

Microglial M1/M2 polarization and metabolic states

Affiliations
Review

Microglial M1/M2 polarization and metabolic states

Ruben Orihuela et al. Br J Pharmacol. 2016 Feb.

Abstract

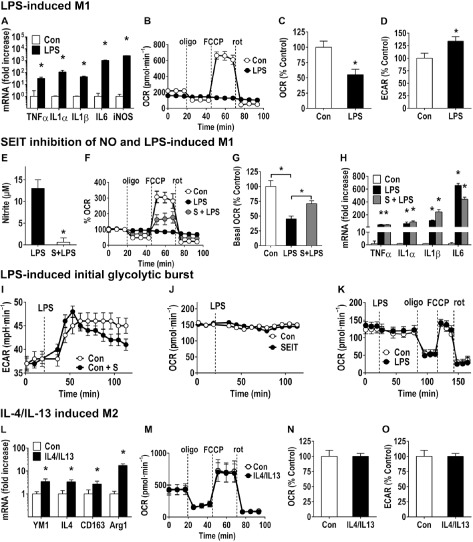
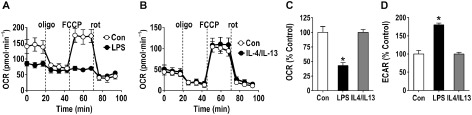
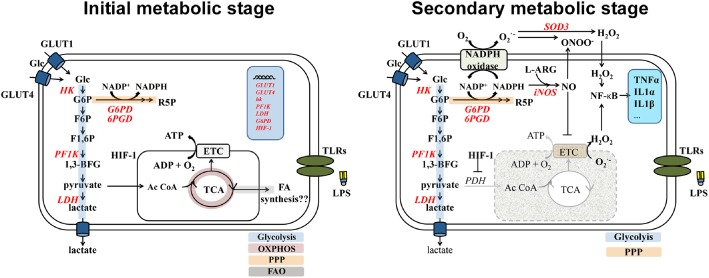
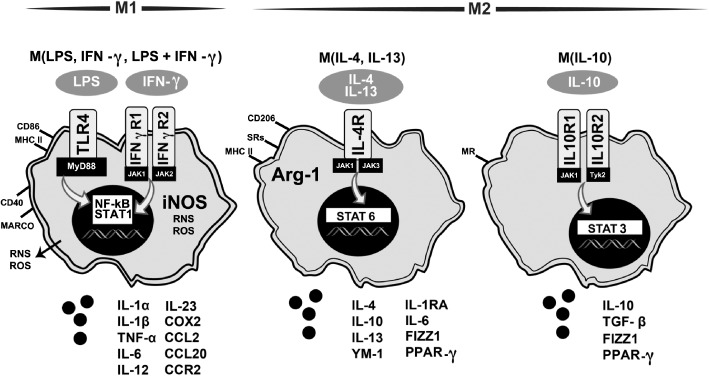
Microglia are critical nervous system-specific immune cells serving as tissue-resident macrophages influencing brain development, maintenance of the neural environment, response to injury and repair. As influenced by their environment, microglia assume a diversity of phenotypes and retain the capability to shift functions to maintain tissue homeostasis. In comparison with peripheral macrophages, microglia demonstrate similar and unique features with regards to phenotype polarization, allowing for innate immunological functions. Microglia can be stimulated by LPS or IFN-γ to an M1 phenotype for expression of pro-inflammatory cytokines or by IL-4/IL-13 to an M2 phenotype for resolution of inflammation and tissue repair. Increasing evidence suggests a role of metabolic reprogramming in the regulation of the innate inflammatory response. Studies using peripheral immune cells demonstrate that polarization to an M1 phenotype is often accompanied by a shift in cells from oxidative phosphorylation to aerobic glycolysis for energy production. More recently, the link between polarization and mitochondrial energy metabolism has been considered in microglia. Under these conditions, energy demands would be associated with functional activities and cell survival and thus, may serve to influence the contribution of microglia activation to various neurodegenerative conditions. This review examines the polarization states of microglia and their relationship to mitochondrial metabolism. Additional supporting experimental data are provided to demonstrate mitochondrial metabolic shifts in primary microglia and the BV-2 microglia cell line induced under LPS (M1) and IL-4/IL-13 (M2) polarization.


Figures

Figure 1
Figure 1
LPS and IL‐4/IL‐13 stimulation of BV‐2 cells. (A–D) LPS‐induced M1 phenotype of BV‐2 cells. BV‐2 cells were plated in six‐well tissue culture plates for mRNA (2 × 10⁵ cells per well) or in 24‐well Seahorse plates (2.5 × 10⁴ per well). 24 h post‐plating, cells were exposed to LPS (100 ng·mL−1 final concentration; 24 h) or media (Con). (A) Total RNA was isolated by Trizol and mRNA levels for M1‐related genes determined by qRTPCR (Supporting Information). Threshold cycle values were determined, GAPDH was used for normalization, and the mean fold changes over saline controls were calculated according to the 2−ΔΔC T method. Data represent mean ± SEM (n = 6). (B) Representative example of a bioenergetics profile (Seahorse Bioscience; Supporting Information) shows a normal response pattern for control BV‐2 cells (2.5 × 10⁴ cells per well) for basal respiration (first three readings), and following addition of the mitochondrial stressors oligomycin (oligo; 0.75 μM), FCCP (0.75 μM) and rotenone (rot; 1 nM). LPS‐exposed cells showed a decrease in basal respiration and were unresponsive to the different mitochondrial stressors, suggesting an impairment of mitochondrial function. Calculation of (C) OCR and (D) ECAR as a percentage of control demonstrated a significant difference between controls and LPS‐exposed cells suggesting an increased extracellular acidification of the media. Data represent mean ± SEM calculated as a percentage of control (six to seven individual wells across three independent experiments) (n = 3). *P < 0.05, significantly different from control; Student's t‐test. (E–H) Response of BV‐2 cells to LPS following inhibition of iNOS with SEIT. BV‐2 cells (nitrite release; mRNA: 2 × 10⁵ cells per well per six‐well; 24‐well Seahorse plate (2.5 × 10⁴ per well) were pre‐exposed to the iNOS‐inhibitor, SEIT (S, 200 μM) for 1 h followed by LPS (100 ng·mL−1, 24 h) exposure. (E) LPS‐induced nitrite release into the media, as determined by Griess reaction, was significantly inhibited by SEIT (S). *P < 0.05, significantly different from LPS alone; Student's t‐test. (F) Seahorse bioenergetics profile showed that inhibition of iNOS partially blunted the mitochondrial impairment induced by LPS as demonstrated by the cellular response following FCCP. (G) Calculation of OCR indicated a significant decrease with LPS exposure and a blunting of this effect with SEIT. (H) mRNA levels for M1‐related genes as determined by qRT‐PCR showed no significant difference between cells exposed to LPS and those exposed to SEIT + LPS. Data represent mean ± SEM (n = 6). *P < 0.05, significantly different from control; anova with Bonferroni's test. (I–K) LPS‐induced polarization provokes a glycolytic burst in BV‐2 cells. (I–J) BV‐2 cells (2.5 × 10⁴ per well Seahorse plate) were exposed to the iNOS‐inhibitor, SEIT (S; 1 h, 200 μM) or media (Con) followed by LPS (100 ng·mL−1 final concentration; 24 h). (I) Cells showed an increase in ECAR following LPS. SEIT dosed cells showed a decrease in ECAR over time as compared with controls suggesting a role for iNOS in maintaining elevated ECAR. (J) SEIT alone showed no effect on basal respiration (OCR). (K) To examine mitochondrial function during the initial LPS‐induced glycolytic burst, BV‐2 cells were administered LPS (100 μg·mL−1 final concentration) or media (Con) at the 20 min time point after recording basal respiration (line indicating dosing). No significant differences were observed in response to oligomycin, FCCP or rotenone, indicating that cells maintained normal mitochondrial function during the initial glycolytic burst. Data represent mean ± SEM calculated as a percentage of control (six to seven individual wells across three independent experiments) (n = 3). (L–N) IL4/IL13 induction of M2 phenotype. 24 h post‐plating, BV‐2 cells (mRNA: 2 × 10⁵ cells per well per well plate; 2.5 × 10⁴ per well per 24‐well Seahorse plate) were exposed to IL4/IL13 (10 ng·mL−1 final concentration of each) or media (Con) for 24 h. (L) Total RNA was isolated by Trizol and mRNA levels for M2‐related genes determined by qRTPCR (Supporting Information). Threshold cycle values were determined, GAPDH was used for normalization, and the mean fold changes over saline controls were calculated according to the 2−ΔΔC T method. Data represent mean ± SEM (n = 6). *P < 0.05, significantly different from control; Student's t‐test. (M) Seahorse bioenergetics profile shows no significant effect of M2 polarization by IL4/IL13 as compared with media controls and (N) OCR and (O) ECAR were not altered with the addition of IL4/IL13. Data represent mean ± SEM calculated as a percentage of control from seven independent wells from duplicate experiments.
Figure 2
Figure 2
Representative mitochondrial function analysis of polarized primary microglia cells. Primary microglia cells were seeded in a Seahorse XF plate (Seahorse Bioscience, Supporting Information) at a density of 1.25 × 10⁵ cells per well and polarized in situ for 24 h with LPS (100 ng·mL−1) or a combination of IL‐4 and IL‐13 (10 ng·mL−1 each). After signal stabilization (three measures) the cells were sequentially exposed to the mitochondrial stressors oligomycin (0.75 μM), FCCP (0.75 μM) and rotenone (rot, 1 μM). (A) Representative bioenergetics profile demonstrates a normal response pattern for control primary microglia. LPS‐exposed cells showed a decrease in basal respiration and were unresponsive to the different mitochondrial stressors, suggesting an impairment of mitochondrial function. (B) Following exposure to IL‐4/IL‐13, cells maintained a bioenergetics profile similar to controls. Calculation of (C) OCR and (D) ECAR as a percentage of control showed that LPS exposure decreased basal respiration, and increased extracellular acidification of the media, respectively, with no changes observed with IL‐4/IL‐13 exposure. Data represent mean ± SEM calculated as a percentage of control (seven individual wells each condition). *P < 0.05, significantly different from control; Student's t‐test. All studies were conducted under an animal protocol approved by National Institute of Environmental Health Sciences Animal Care and Use Committee.
Figure 3
Figure 3
Schematic representation of LPS‐induced BV‐2 polarization. Activation of TLRs by LPS provokes dramatic changes in the metabolism of microglia, inducing a glycolytic switch that decreases mitochondrial O2 consumption and increases extracellular acidification via production of lactate. As observed in other immune cells (Everts et al., 2014), the data suggest that activation of microglia goes through two metabolic steps. In the first step, immediately after LPS stimulation, glycolytic metabolism is enhanced independently of NO production, increasing intracellular glucose (Glc) via glucose transporter (GLUT)‐1 and GLUT‐4 and production of several glycolytic enzymes. The PPP is induced via expression of its rate‐limiting enzyme, 6‐phosphogluconate dehydrogenase (G6PD). The electron transport chain (ETC) remains functional and the cells rely on oxidative phosphorylation and glycolysis for energy production. While LPS provokes a rapid glycolytic burst in microglia, there is little evidence of increased oxidative phosphorylation for synthesis of new molecules, as observed in DCs (Everts et al., 2014). In the second stage, NADPH, generated through the PPP, is used to produce ROS. H2O2 is then used as a bactericidal and also as a second messenger to modulate NFκB. In the presence of NADPH, iNOS oxidation of L‐arginine (L‐ARG) produces NO to inhibit Cytochrome c. In addition, HIF‐1α inhibits pyruvate dehydrogenase (PDH) and thus, the conversion of pyruvate into acetyl CoA, forcing a sole reliance on glycolysis for cell survival. As a consequence, mitochondrial dysfunction provokes the generation of additional mitochondrial ROS that are transported to the cytoplasm activating NFκB to exacerbate the pro‐inflammatory response. Abbreviations: 1,3‐BFG, 1,3‐biphosphoglycerate; ETC, electronic transport chain; FAO, fatty‐acid oxidation; F6P, fructose‐6‐phosphate; F‐1,6P, fructose‐1,6‐biphosphate; G6P, glucose‐6‐phosphate; NADP +, oxidized form of NADPH; OXPHOS, oxidative phosphorylation; PF1K, phosphofructose‐1‐kinase; R5P, ribose‐5‐phosphate; SOD3, superoxide dismutase 3.
Figure 4
Figure 4
Diagram of activation states of microglia based on inflammatory profile and effector function. Based upon peripheral macrophage nomenclature, M1 and M2 polarization states of microglia have been proposed as a framework to evaluate the heterogeneity of responses (Colton, 2009; Mosser and Edwards, 2008) with recent evaluations suggesting a framework focused on the inducing stimuli (Martinez and Gordon, 2014; Murray et al., 2014). This diagram is based upon these papers and adapted from Martinez and Gordon (2014). Under the classic M1 state, exposure to LPS and/or IFN‐γ stimulates TLR4 or IFN‐γ receptors 1 and 2, respectively, leading to activation of transcription factors NFκΒ and STAT1 and increased expression of CD86 and MHC‐II. The increase in iNOS produces a burst of ROS and reactive nitrogen species (RNS) and the release of pro‐inflammatory cytokines, such as IL‐1α, IL‐1β, TNFα, IL‐6, IL‐12, IL‐23, the chemokines CCL2 and CCL20, and the receptor CCR2, macrophage receptor with collagenous structure (MARCO) and COX2. M2 states have been proposed following various stimulatory factors. For example, upon stimulation with IL‐4/IL‐13, binding of the IL‐4 receptor (IL‐4R) initiates activation of STAT6, shifting the cells towards an anti‐inflammatory phenotype with an increase in Arg‐1, expression of CD206 and mannose receptor (MR), and release of anti‐inflammatory factors (IL‐4, IL‐6, IL‐10, IL‐13, IL1RA, FIZZ1, and PPARγ. Exposure of the cells to IL‐10 activates STAT6 via stimulation of IL‐10 receptors 1 and 2. This serves to shift the cells to a primary immunosuppressive state with an expression of CD206 and the release of IL‐10, TGFβ, FIZZ1 and PPARγ.

References

    1. Albina JE, Caldwell MD, Henry WL Jr, Mills CD (1989). Regulation of macrophages functions by L‐arginine. J Exp Med 169: 1021–1029. - PMC - PubMed
    1. Alexander SPH, Benson HE, Faccenda E, Pawson AJ, Sharman JL, Spedding M et al (2013a). The Concise Guide to PHARMACOLOGY 2013/14: Enzymes. Br J Pharmacol 170: 1797–1867. - PMC - PubMed
    1. Alexander SPH, Benson HE, Faccenda E, Pawson AJ, Sharman JL, Spedding M et al (2013b). The Concise Guide to PHARMACOLOGY 2013/14: G Protein‐Coupled Receptors. Br J Pharmacol 170: 1459–1581. - PMC - PubMed
    1. Alexander SPH, Benson HE, Faccenda E, Pawson AJ, Sharman JL, Spedding M et al (2013c). The Concise Guide to PHARMACOLOGY 2013/14: Catalytic Receptors. Br J Pharmacol 170: 1676–1705. - PMC - PubMed
    1. Alliot F, Godin I, Pessac B (1999). Microglia derived from progenitors, originating from the yolk sac, and which proliferate in the brain. Brain Res Dev Brain Res 117: 145–152. - PubMed

Publication types

Associated data