

Active-comparator design and new-user design in observational studies
- PMID: 25800216
- PMCID: PMC4486631
- DOI: 10.1038/nrrheum.2015.30
Active-comparator design and new-user design in observational studies
Abstract
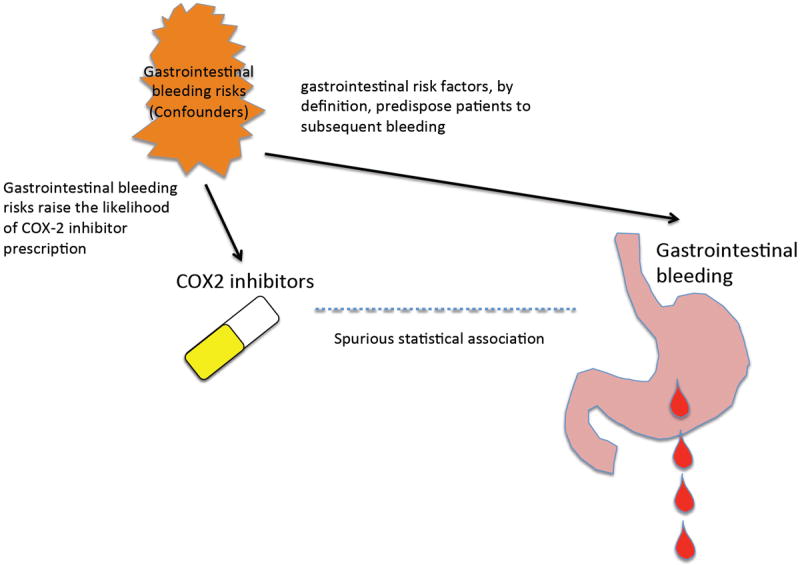
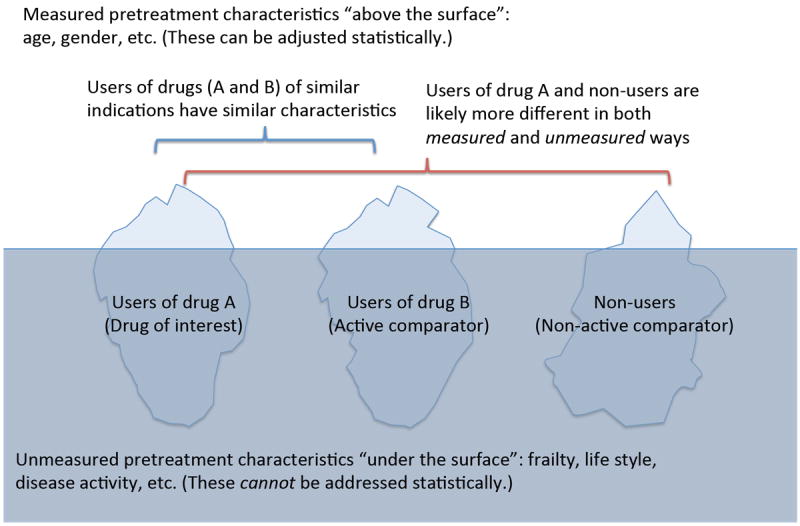
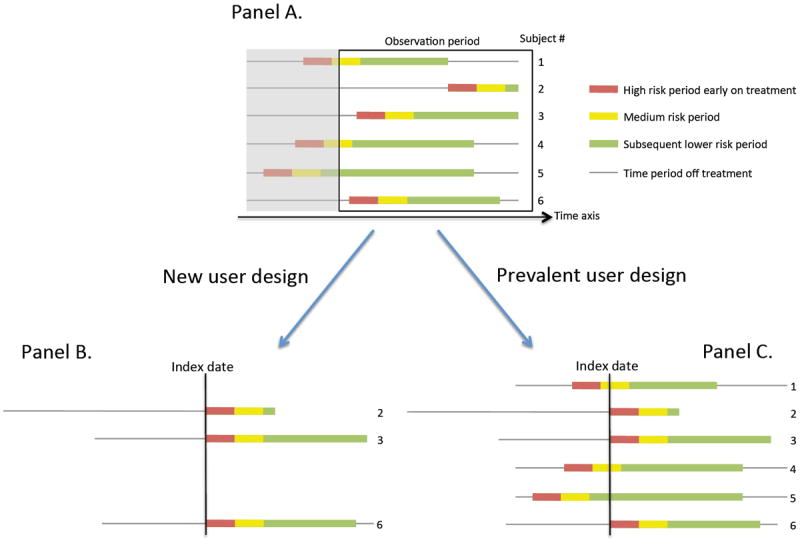
Over the past decade, an increasing number of observational studies have examined the effectiveness or safety of treatments for rheumatoid arthritis. Unlike randomized controlled trials (RCTs), however, observational studies of drug effects have methodological limitations such as confounding by indication. Active-comparator designs and new-user designs can help mitigate such biases in observational studies and improve the validity of their findings by making them more closely approximate RCTs. In an active-comparator study, the drug of interest is compared with another agent commonly used for the same indication, rather than with no treatment (a 'non-user' group). This principle helps to ensure that treatment groups have similar treatment indications, attenuating both measured and unmeasured differences in patient characteristics. The new-user study includes a cohort of patients from the time of treatment initiation, enabling assessment of patients' pretreatment characteristics and capture of all events occurring during follow-up. These two principles should be considered when designing or reviewing observational studies of drug effects.
Figures
Similar articles
-
Network meta-analysis incorporating randomized controlled trials and non-randomized comparative cohort studies for assessing the safety and effectiveness of medical treatments: challenges and opportunities.Syst Rev. 2015 Nov 5;4:147. doi: 10.1186/s13643-015-0133-0. Syst Rev. 2015. PMID: 26537988 Free PMC article.
-
Increase in lifetime adverse drug reactions, service utilization, and disease severity among patients who will start COX-2 specific inhibitors: quantitative assessment of channeling bias and confounding by indication in 6689 patients with rheumatoid arthritis and osteoarthritis.J Rheumatol. 2002 May;29(5):1015-22. J Rheumatol. 2002. PMID: 12022317
-
Should meta-analyses of interventions include observational studies in addition to randomized controlled trials? A critical examination of underlying principles.Am J Epidemiol. 2007 Nov 15;166(10):1203-9. doi: 10.1093/aje/kwm189. Epub 2007 Aug 21. Am J Epidemiol. 2007. PMID: 17712019
-
Designing clinical trials for amblyopia.Vision Res. 2015 Sep;114:41-7. doi: 10.1016/j.visres.2015.01.029. Epub 2015 Mar 6. Vision Res. 2015. PMID: 25752747 Free PMC article. Review.
-
Methodological issues in observational studies and non-randomized controlled trials in oncology in the era of big data.Jpn J Clin Oncol. 2015 Apr;45(4):323-7. doi: 10.1093/jjco/hyu220. Epub 2015 Jan 14. Jpn J Clin Oncol. 2015. PMID: 25589456 Review.
Cited by
-
Analysis of Healthcare Resource Utilization and Costs after the Initiation of Biologic Treatment in Patients with Ulcerative Colitis and Crohn's Disease.J Health Econ Outcomes Res. 2018 Sep 1;6(1):96-112. doi: 10.36469/9791. eCollection 2018. J Health Econ Outcomes Res. 2018. PMID: 32685575 Free PMC article.
-
Thiazolidinedione use and risk of Parkinson's disease in patients with type 2 diabetes mellitus.NPJ Parkinsons Dis. 2022 Oct 21;8(1):138. doi: 10.1038/s41531-022-00406-8. NPJ Parkinsons Dis. 2022. PMID: 36271052 Free PMC article.
-
Disentangling the Association between Statins, Cholesterol, and Colorectal Cancer: A Nested Case-Control Study.PLoS Med. 2016 Apr 26;13(4):e1002007. doi: 10.1371/journal.pmed.1002007. eCollection 2016 Apr. PLoS Med. 2016. PMID: 27116322 Free PMC article.
-
Increased risk of all-cause mortality associated with domperidone use in Parkinson's patients: a population-based cohort study in the UK.Br J Clin Pharmacol. 2018 Nov;84(11):2551-2561. doi: 10.1111/bcp.13708. Epub 2018 Aug 9. Br J Clin Pharmacol. 2018. PMID: 29975795 Free PMC article.
-
Random control selection for conducting high-throughput adverse drug events screening using large-scale longitudinal health data.CPT Pharmacometrics Syst Pharmacol. 2021 Sep;10(9):1032-1042. doi: 10.1002/psp4.12673. Epub 2021 Aug 17. CPT Pharmacometrics Syst Pharmacol. 2021. PMID: 34313404 Free PMC article.
References
-
- Chan KA, Hernandez-Diaz S. Pharmacoepidemiology and rheumatic disorders. Rheum Dis Clin North Am. 2004;30:835–850. vii. - PubMed
-
- Schneeweiss S, Gagne JJ, Glynn RJ, Ruhl M, Rassen JA. Assessing the comparative effectiveness of newly marketed medications: methodological challenges and implications for drug development. Clin Pharmacol Ther. 2011;90:777–790. - PubMed
-
- Strom BL, Kimmel SE, Hennessy S. Textbook of Pharmacoepidemiology. Wiley-Blackwell; 2013.
-
- Walker AM, Stampfer MJ. Observational studies of drug safety. Lancet. 1996;348:489. - PubMed
-
- Psaty BM, Siscovick DS. Minimizing bias due to confounding by indication in comparative effectiveness research: the importance of restriction. JAMA. 2010;304:897–898. - PubMed
Publication types
MeSH terms
Grants and funding
LinkOut - more resources
Full Text Sources
Other Literature Sources
Miscellaneous
