. 2015 Apr 20;33(12):1379-88.
doi: 10.1200/JCO.2014.57.7080. Epub 2015 Mar 23.

Diffuse large B-cell lymphoma classification system that associates normal B-cell subset phenotypes with prognosis

Affiliations

Diffuse large B-cell lymphoma classification system that associates normal B-cell subset phenotypes with prognosis

Karen Dybkær et al. J Clin Oncol. .

Abstract

Purpose: Current diagnostic tests for diffuse large B-cell lymphoma use the updated WHO criteria based on biologic, morphologic, and clinical heterogeneity. We propose a refined classification system based on subset-specific B-cell-associated gene signatures (BAGS) in the normal B-cell hierarchy, hypothesizing that it can provide new biologic insight and diagnostic and prognostic value.

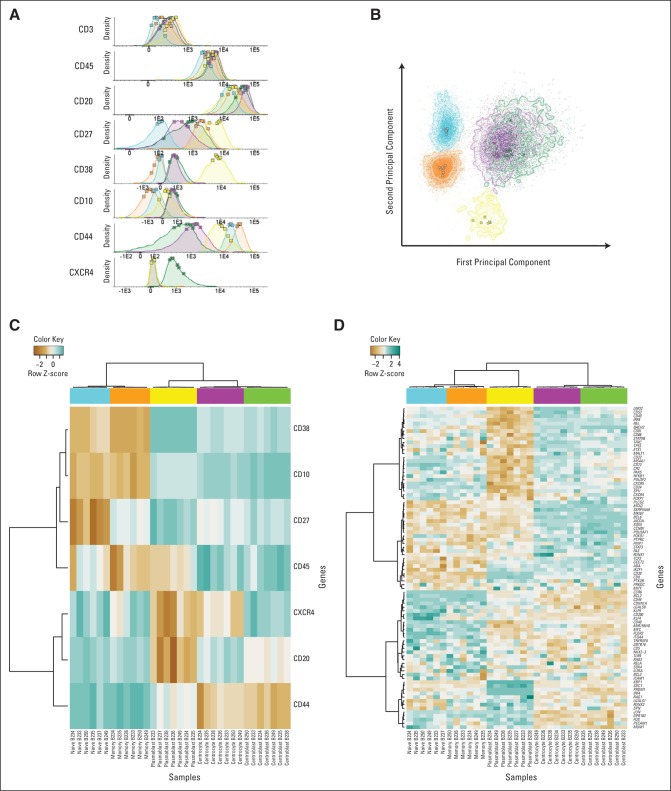
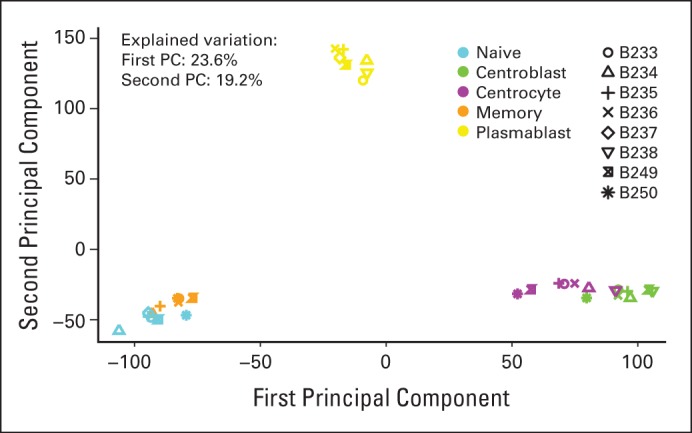
Patients and methods: We combined fluorescence-activated cell sorting, gene expression profiling, and statistical modeling to generate BAGS for naive, centrocyte, centroblast, memory, and plasmablast B cells from normal human tonsils. The impact of BAGS-assigned subtyping was analyzed using five clinical cohorts (treated with cyclophosphamide, doxorubicin, vincristine, and prednisone [CHOP], n = 270; treated with rituximab plus CHOP [R-CHOP], n = 869) gathered across geographic regions, time eras, and sampling methods. The analysis estimated subtype frequencies and drug-specific resistance and included a prognostic meta-analysis of patients treated with first-line R-CHOP therapy.

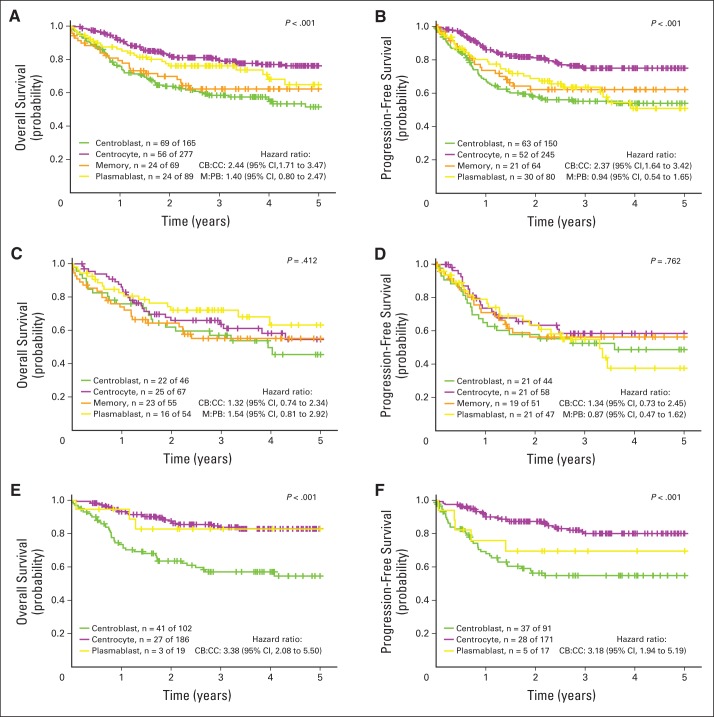
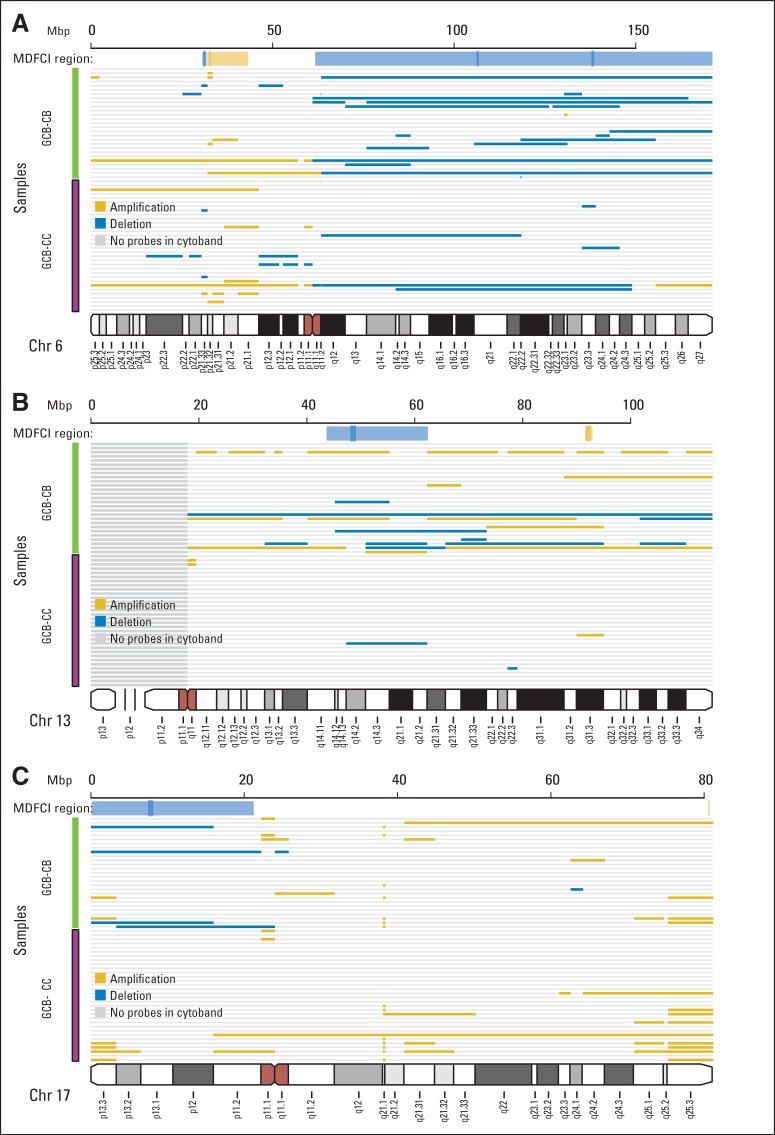
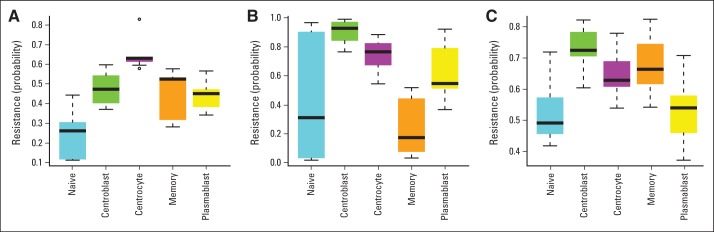
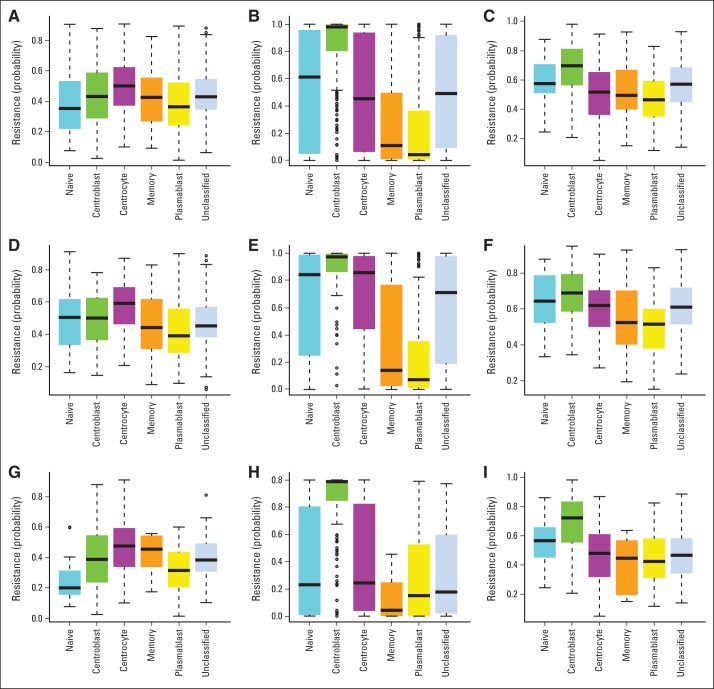
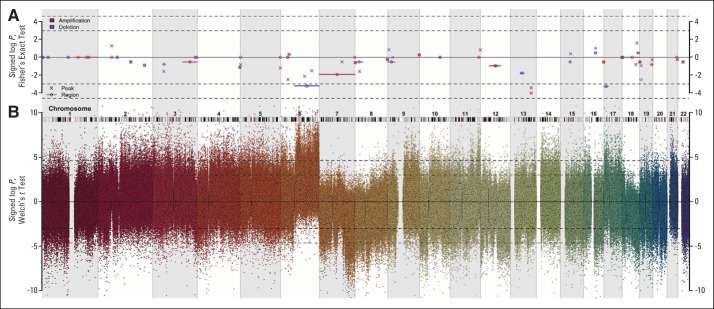
Results: Similar BAGS subtype frequencies were assigned across 1,139 samples from five different cohorts. Among R-CHOP-treated patients, BAGS assignment was significantly associated with overall survival and progression-free survival within the germinal center B-cell-like subclass; the centrocyte subtype had a superior prognosis compared with the centroblast subtype. In agreement with the observed therapeutic outcome, centrocyte subtypes were estimated as being less resistant than the centroblast subtype to doxorubicin and vincristine. The centroblast subtype had a complex genotype, whereas the centrocyte subtype had high TP53 mutation and insertion/deletion frequencies and expressed LMO2, CD58, and stromal-1-signature and major histocompatibility complex class II-signature genes, which are known to have a positive impact on prognosis.

Conclusion: Further development of a diagnostic platform using BAGS-assigned subtypes may allow pathogenetic studies to improve disease management.


Conflict of interest statement

Authors' disclosures of potential conflicts of interest are found in the article online at www.jco.org. Author contributions are found at the end of this article.

Figures

Fig 1.
Fig 1.
Expression of CD markers, transcription factors, and B-cell subset–specific genes. Tonsil B cells were defined as CD20+, CD45+, and CD3 and were further subdivided according to differential expression of CD10, CD27, CD38, CD44, and CXCR4 into naive cells (blue), centrocytes (purple), centroblasts (green), memory cells (orange), and plasmablasts (yellow). (A) Normalized histograms of the fluorescence intensities of CD markers based on merged multiparametric flow cytometry reanalysis of pure sorted populations resulting from five independent sorting procedures. The squares are mean values of the fluorescence intensities for each single sorted B-cell subset. (B) Principal component analysis of the fluorescence intensities for each sorted cell in all samples. Cells are color coded according to their original subset. The squares are mean values for each sorted B-cell subset included in the principal component analysis. Surface markers, transcription factors, and B-cell differentiation–specific genes were identified through a literature review, and their expression across subsets was evaluated. The most varying probe sets were included in an unsupervised hierarchical clustering analysis (C) of the sorting markers and (D) of transcription factors, surface markers, and B-cell differentiation–specific genes. The color scale (top) indicates the relative gene expression in each sample, with blue illustrating high gene expression and brown low gene expression.
Fig 2.
Fig 2.
Meta-analysis of the prognostic impact of assigned B-cell–associated gene signature (BAGS) subtypes. (A, C, E) Overall survival and (B, D, F) progression-free survival were compared between BAGS subtypes for patients treated with rituximab plus cyclophosphamide, doxorubicin, vincristine, and prednisone (R-CHOP). For overall survival, the following three cohorts were used: Lymphoma/Leukemia Molecular Profiling Project (LLMPP) R-CHOP, International Diffuse Large B-Cell Lymphoma Rituximab-CHOP Consortium MD Anderson Project (IDRC), and Mayo Clinic, Brigham and Women's Hospital, and Dana-Farber Cancer Institute Project (MDFCI). For progression-free survival, only LLMPP R-CHOP and IDRC were used. The comparisons were performed (A, B) overall and according to the (C, D) activated B-cell–like and (E, F) germinal center B-cell–like subclasses based on Kaplan-Meier survival curves, log-rank test P values, and hazard ratios. For clarity, the naive and unclassified cells were excluded from the Kaplan-Meier analysis. CB, centroblast; CC, centrocyte; M, memory; PB, plasmablast.
Fig 3.
Fig 3.
Characterization of the genotypes of B-cell–associated gene signature (BAGS) subtypes. Copy number aberrations (CNAs) in the assigned subtypes were found at various chromosome positions when studied in 165 samples from Mayo Clinic, Brigham and Women's Hospital, and Dana-Farber Cancer Institute Project (MDFCI) with Affymetrix Genome-Wide Human SNP Array 6.0 and Affymetrix Gene Chip Human Genome U133 Plus 2.0 Arrays or U133A+B Arrays. (A) Graphical representation of CNAs on chromosome 6, (B) chromosome 13, and (C) chromosome 17 with copy numbers (CNs) averaged over each cytoband. A deletion was defined as an average CN of less than 1.62, and an amplification was defined as an average CN of more than 2.46. Gold indicates amplification, and blue indicates deletion. The subtype identity is color coded as follows: germinal center B-cell–like (GCB) centrocyte (CC) is purple, and GCB centroblast (CB) is green. Above each chromosome, the extents of the MDFCI peaks (dark gold for amplification and dark blue for deletion) and region (light gold for amplification and light blue for deletion) are shown.
Fig A1.
Fig A1.
Principal component (PC) analysis identified distinct B-cell subset clusters. PC analysis was performed based on all probe sets for all samples (n = 8). The second PC is plotted versus the first PC. All subsets segregated into distinct clusters, albeit with relatively minor separation between the centroblast and centrocyte clusters and between the naive and memory clusters. The first and second PCs explained 23.6% and 19.2% of the variation, respectively. Notably, the analysis was conducted on all probe sets, resulting in a large number of noise probes, which explains the large proportion of the variation explained by the first PC.
Fig A2.
Fig A2.
Drug-specific resistance of B-cell–associated gene signature subtypes. The probability of resistance in normal tonsil subsets was sorted and analyzed by microarray. Box plots indicate the estimated probabilities of resistance to (A) cyclophosphamide/mafosfamide, (B) doxorubicin, and (C) vincristine.
Fig A3.
Fig A3.
Drug-specific resistance of B-cell–associated gene signature (BAGS) subtypes in all clinical cohorts. Box plots show the probability of resistance versus BAGS subtype for all clinical cohorts: (A, D, G) cyclophosphamide, (B, E, H) doxorubicin, and (C, F, I) vincristine in (A, B, C) all clinical cohorts, (D, E, F) activated B-cell–like subclass, and (G, H, I) germinal center B-cell–like subclass.
Fig A4.
Fig A4.
Characterization of the genotypes of B-cell–associated gene signature subtypes. Copy number aberrations (CNAs) in the assigned subtypes were found at various chromosome positions when studied in 165 samples from Mayo Clinic, Brigham and Women's Hospital, and Dana-Farber Cancer Institute Project (MDFCI) with Affymetrix Genome-Wide Human SNP Array 6.0 and Affymetrix Gene Chip Human Genome U133 Plus 2.0 Arrays or U133A+B Arrays. (A) Signed log P values calculated using Fisher's exact test for the hypothesis of equal proportions of CNA in germinal center B-cell–like (GCB) centrocyte (CC; n = 32) versus GCB-centroblast (CB; n = 23) in peaks and regions (as defined by Monti et al) are plotted against the chromosomal position of the region. Crosses and circles denote genomic peaks and regions, respectively. Color indicates the type of CNA investigated, as follows: amplification (red) or deletion (blue). Values greater than zero indicate more frequent CNAs in GCB-CC compared with GCB-CB, and vice versa for negative values. The dashed horizontal lines indicate the 95% and 99% acceptance intervals. (B) Signed log P values calculated based on t test for the hypothesis of no difference in copy number for each probe set in GCB-CC and GCB-CB samples are plotted against the chromosomal position of that probe set. Values greater than zero indicate amplification in GCB-CC or deletion in GCB-CB, and vice versa for values less than zero.

References

    1. Campo E, Swerdlow SH, Harris NL, et al. The 2008 WHO classification of lymphoid neoplasms and beyond: Evolving concepts and practical applications. Blood. 2011;117:5019–5032. - PMC - PubMed
    1. Alizadeh AA, Eisen MB, Davis RE, et al. Distinct types of diffuse large B-cell lymphoma identified by gene expression profiling. Nature. 2000;403:503–511. - PubMed
    1. Andréasson U, Dictor M, Jerkeman M, et al. Identification of molecular targets associated with transformed diffuse large B cell lymphoma using highly purified tumor cells. Am J Hematol. 2009;84:803–808. - PubMed
    1. Kjeldsen MK, Perez-Andres M, Schmitz A, et al. Multiparametric flow cytometry for identification and fluorescence activated cell sorting of five distinct B-cell subpopulations in normal tonsil tissue. Am J Clin Pathol. 2011;136:960–969. - PubMed
    1. Perez-Andres M, Paiva B, Nieto WG, et al. Human peripheral blood B-cell compartments: A crossroad in B-cell traffic. Cytometry B Clin Cytom. 2010;78(suppl 1):S47–S60. - PubMed

Publication types

MeSH terms