

Summarising and validating test accuracy results across multiple studies for use in clinical practice
- PMID: 25800943
- PMCID: PMC4973708
- DOI: 10.1002/sim.6471
Summarising and validating test accuracy results across multiple studies for use in clinical practice
Abstract
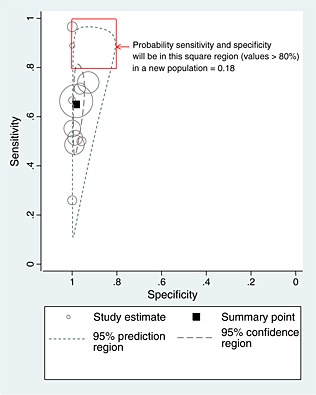
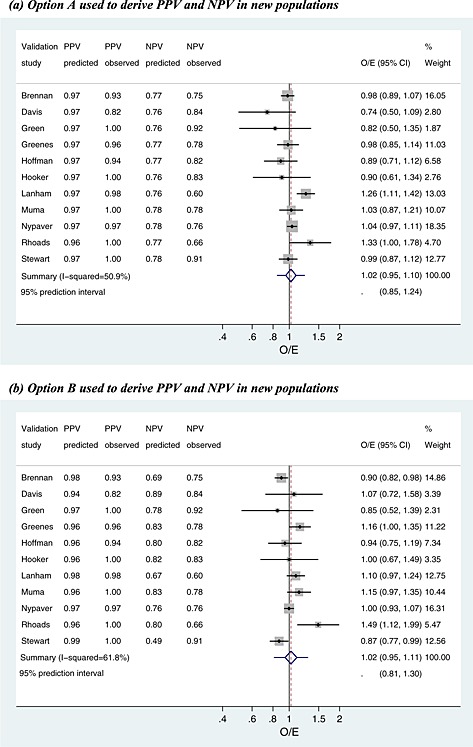
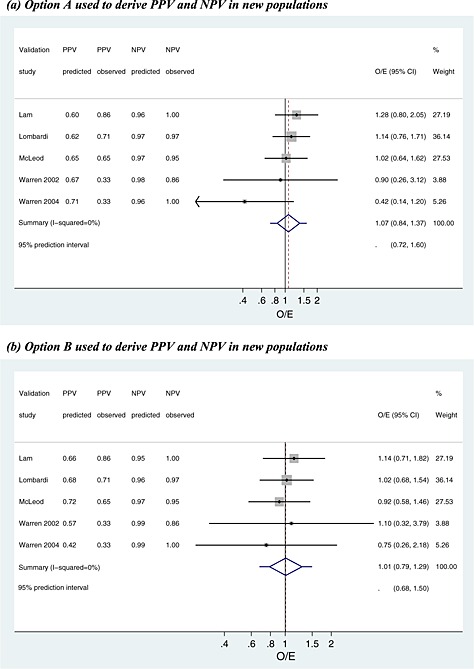
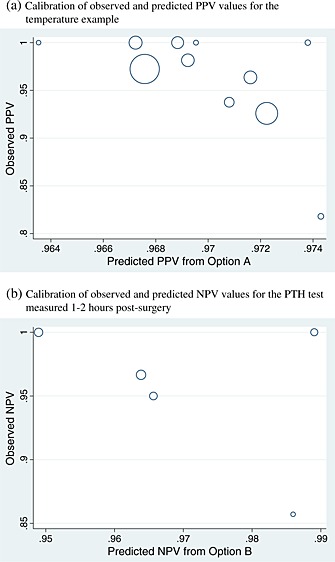
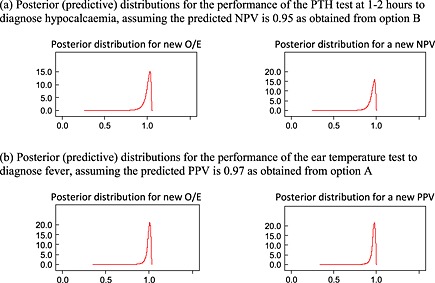
Following a meta-analysis of test accuracy studies, the translation of summary results into clinical practice is potentially problematic. The sensitivity, specificity and positive (PPV) and negative (NPV) predictive values of a test may differ substantially from the average meta-analysis findings, because of heterogeneity. Clinicians thus need more guidance: given the meta-analysis, is a test likely to be useful in new populations, and if so, how should test results inform the probability of existing disease (for a diagnostic test) or future adverse outcome (for a prognostic test)? We propose ways to address this. Firstly, following a meta-analysis, we suggest deriving prediction intervals and probability statements about the potential accuracy of a test in a new population. Secondly, we suggest strategies on how clinicians should derive post-test probabilities (PPV and NPV) in a new population based on existing meta-analysis results and propose a cross-validation approach for examining and comparing their calibration performance. Application is made to two clinical examples. In the first example, the joint probability that both sensitivity and specificity will be >80% in a new population is just 0.19, because of a low sensitivity. However, the summary PPV of 0.97 is high and calibrates well in new populations, with a probability of 0.78 that the true PPV will be at least 0.95. In the second example, post-test probabilities calibrate better when tailored to the prevalence in the new population, with cross-validation revealing a probability of 0.97 that the observed NPV will be within 10% of the predicted NPV.
Keywords: calibration; diagnostic; discrimination; meta-analysis; prognostic; test accuracy.
© 2015 The Authors. Statistics in Medicine Published by John Wiley & Sons Ltd.
Figures
References
-
- Reitsma JB, Glas AS, Rutjes AW, Scholten RJ, Bossuyt PM, Zwinderman AH. Bivariate analysis of sensitivity and specificity produces informative summary measures in diagnostic reviews. Journal of Clinical Epidemiology 2005; 58:982–990. - PubMed
-
- Harbord RM, Deeks JJ, Egger M, Whiting P, Sterne JA. A unification of models for meta‐analysis of diagnostic accuracy studies. Biostatistics 2007; 8:239–251. - PubMed
-
- Chu H, Cole SR. Bivariate meta‐analysis of sensitivity and specificity with sparse data: a generalized linear mixed model approach. Journal of Clinical Epidemiology 2006;59 1331–1332. author reply 1332–1333. - PubMed
-
- Leeflang MM, Deeks JJ, Rutjes AW, Reitsma JB, Bossuyt PM. Bivariate meta‐analysis of predictive values of diagnostic tests can be an alternative to bivariate meta‐analysis of sensitivity and specificity. Journal of Clinical Epidemiology 2012; 65:1088–1097. - PubMed
Publication types
MeSH terms
Grants and funding
LinkOut - more resources
Full Text Sources
Other Literature Sources