

Evaluation of extraction kits and RT-qPCR systems adapted to high-throughput platform for circulating miRNAs
- PMID: 25800946
- PMCID: PMC4371102
- DOI: 10.1038/srep09430
Evaluation of extraction kits and RT-qPCR systems adapted to high-throughput platform for circulating miRNAs
Abstract
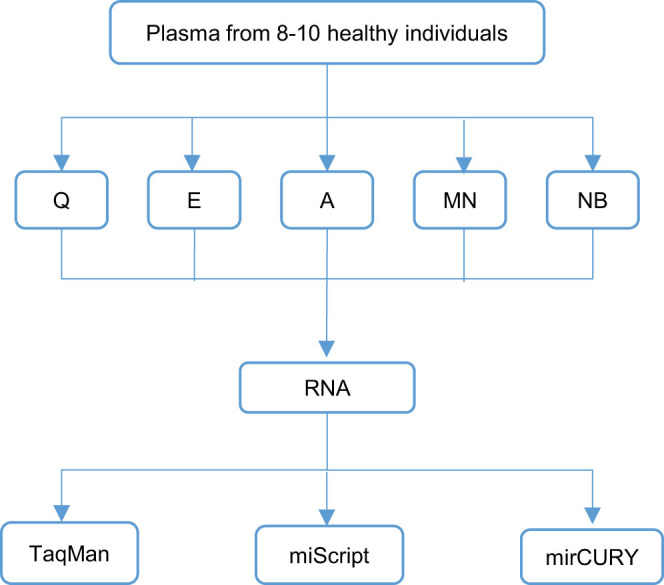
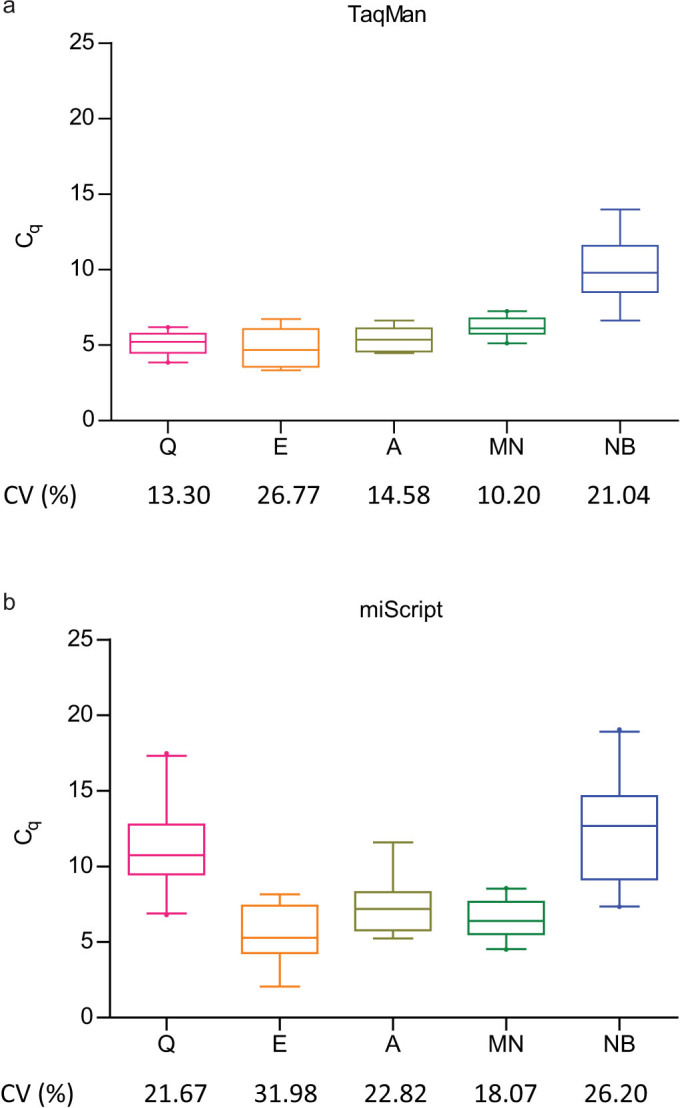
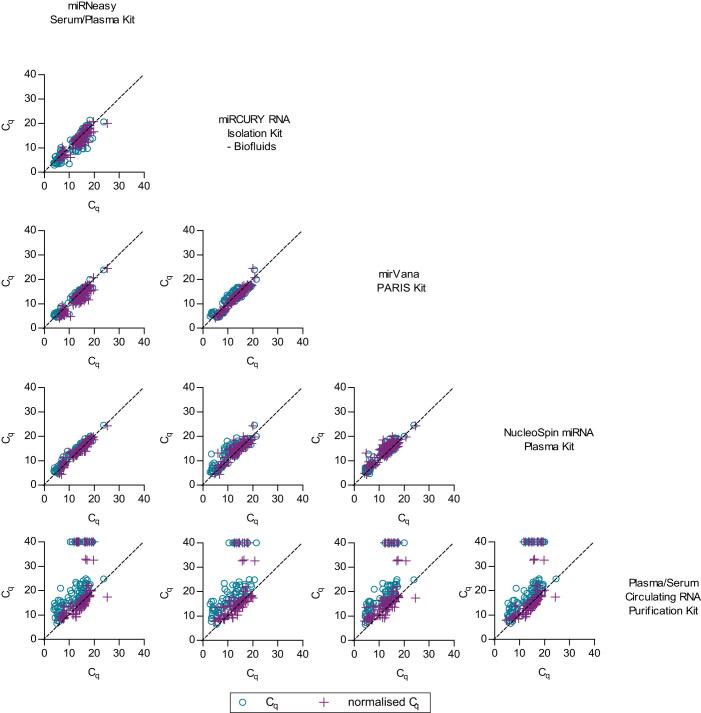
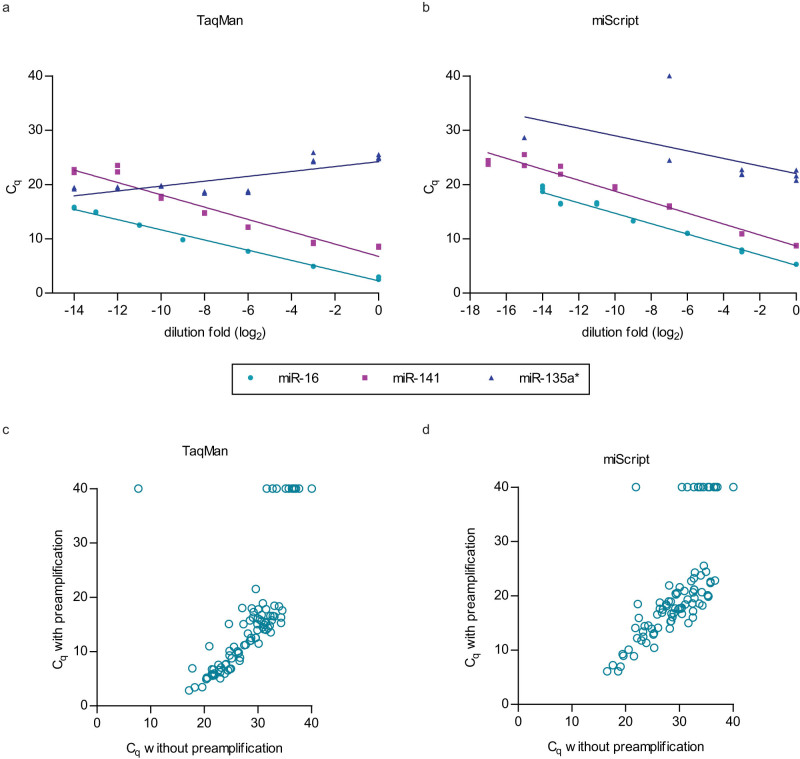
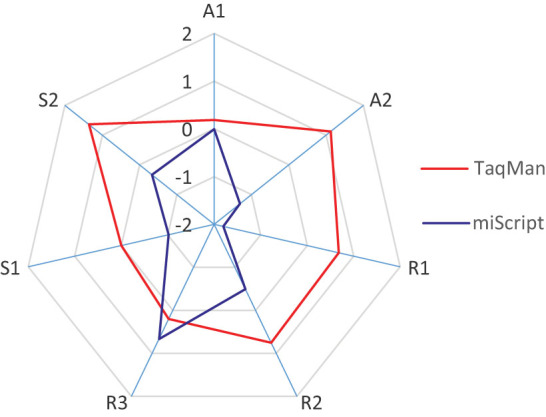
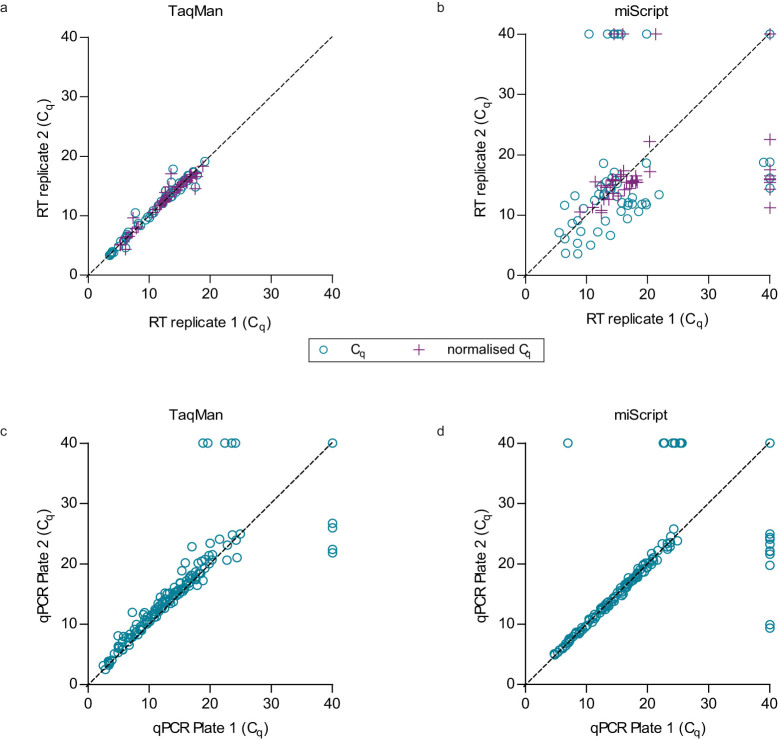
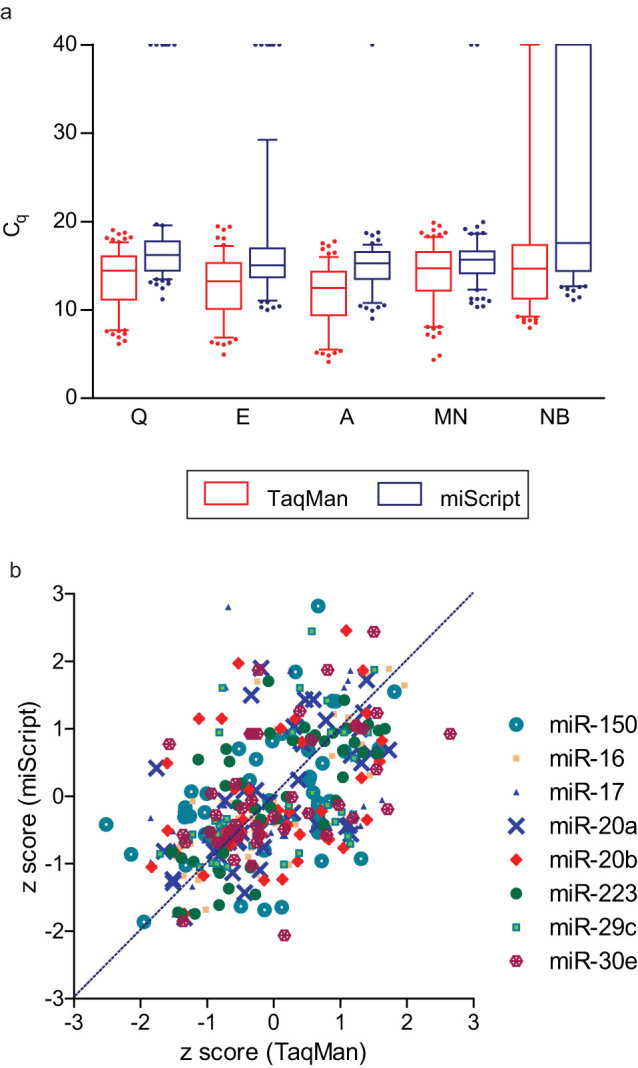
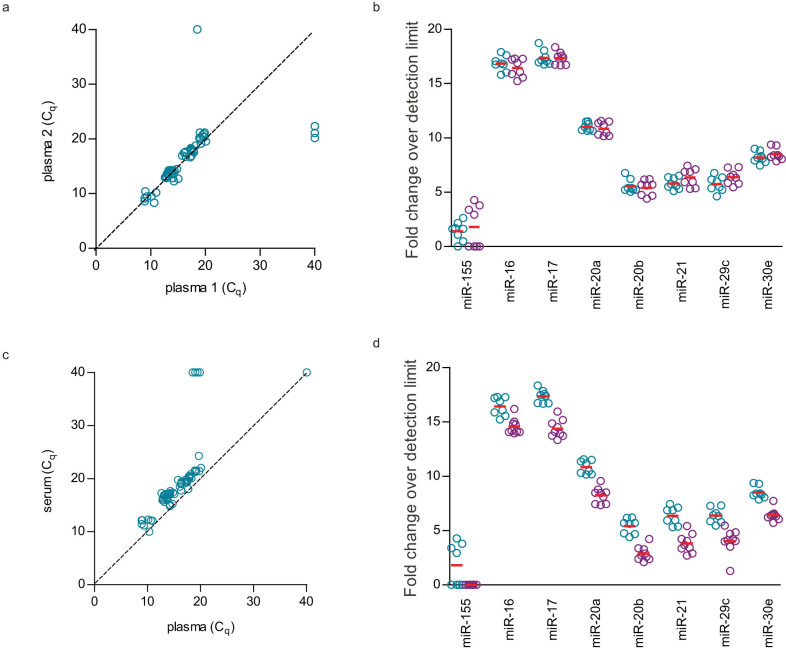
MicroRNAs regulate gene expression at the post-transcriptional level. Differential expression of miRNAs can potentially be used as biomarkers for early diagnosis and prediction for outcomes. Failure in validation of miRNA profiles is often caused by variations in experimental parameters. In this study, the performance of five extraction kits and three RT-qPCR systems were evaluated using BioMark high-throughput platform and the effects of different experimental parameters on circulating miRNA levels were determined. Differences in the performance of extraction kits as well as varying accuracy, sensitivity and reproducibility in qPCR systems were observed. Normalisation of RT-qPCR data to spike-in controls can reduce extraction bias. However, the extent of correlation for different qPCR systems varies in different assays. At different time points, there was no significant fold change in eight of the plasma miRNAs that we evaluated. Higher level of miRNAs was detected in plasma as compared to serum of the same cohort. In summary, we demonstrated that high-throughput RT-qPCR with pre-amplification step had increased sensitivity and can be achieved with accuracy and high reproducibility through stringent experimental controls. The information provided here is useful for planning biomarker validation studies involving circulating miRNAs.
Conflict of interest statement
Yes, there is potential competing interest. Newer version of Plasma/Serum Circulating RNA Purification kit (slurry format) for 10 reactions and SR1 reagent used in this study were provided free by the manufacturers.
Figures
Similar articles
-
Comparison of RNA isolation and associated methods for extracellular RNA detection by high-throughput quantitative polymerase chain reaction.Anal Biochem. 2016 May 15;501:66-74. doi: 10.1016/j.ab.2016.02.019. Epub 2016 Mar 10. Anal Biochem. 2016. PMID: 26969789
-
Variability in microRNA recovery from plasma: Comparison of five commercial kits.Anal Biochem. 2015 Nov 1;488:28-35. doi: 10.1016/j.ab.2015.07.018. Epub 2015 Aug 10. Anal Biochem. 2015. PMID: 26271186
-
Normalization of circulating microRNA expression data obtained by quantitative real-time RT-PCR.Brief Bioinform. 2016 Mar;17(2):204-12. doi: 10.1093/bib/bbv056. Epub 2015 Aug 3. Brief Bioinform. 2016. PMID: 26238539 Free PMC article.
-
Study Design and qPCR Data Analysis Guidelines for Reliable Circulating miRNA Biomarker Experiments: A Review.Clin Chem. 2018 Sep;64(9):1308-1318. doi: 10.1373/clinchem.2017.285288. Epub 2018 Jun 14. Clin Chem. 2018. PMID: 29903876 Review.
-
qPCR-based methods for expression analysis of miRNAs.Biotechniques. 2019 Oct;67(4):192-199. doi: 10.2144/btn-2019-0065. Epub 2019 Sep 6. Biotechniques. 2019. PMID: 31560239 Review.
Cited by
-
Epigenetic biomarkers: Current strategies and future challenges for their use in the clinical laboratory.Crit Rev Clin Lab Sci. 2017 Nov-Dec;54(7-8):529-550. doi: 10.1080/10408363.2017.1410520. Epub 2017 Dec 11. Crit Rev Clin Lab Sci. 2017. PMID: 29226748 Free PMC article. Review.
-
Circulating microRNAs as Reliable Tumor Biomarkers: Opportunities and Challenges Facing Clinical Application.J Pharmacol Exp Ther. 2023 Jan;384(1):35-51. doi: 10.1124/jpet.121.000896. Epub 2022 Jul 9. J Pharmacol Exp Ther. 2023. PMID: 35809898 Free PMC article. Review.
-
Challenges and opportunities in exosome research-Perspectives from biology, engineering, and cancer therapy.APL Bioeng. 2019 Mar 27;3(1):011503. doi: 10.1063/1.5087122. eCollection 2019 Mar. APL Bioeng. 2019. PMID: 31069333 Free PMC article. Review.
-
An automated DNA computing platform for rapid etiological diagnostics.Sci Adv. 2022 Nov 25;8(47):eade0453. doi: 10.1126/sciadv.ade0453. Epub 2022 Nov 25. Sci Adv. 2022. PMID: 36427311 Free PMC article.
-
Plasma-derived parasitic microRNAs have insufficient concentrations to be used as diagnostic biomarker for detection of Onchocerca volvulus infection or treatment monitoring using LNA-based RT-qPCR.Parasitol Res. 2017 Mar;116(3):1013-1022. doi: 10.1007/s00436-017-5382-5. Epub 2017 Jan 22. Parasitol Res. 2017. PMID: 28111713 Free PMC article.
References
Publication types
MeSH terms
Substances
LinkOut - more resources
Full Text Sources
Other Literature Sources
