. 2015 Apr 6;212(4):447-56.
doi: 10.1084/jem.20141539. Epub 2015 Mar 23.

A dynamic spectrum of monocytes arising from the in situ reprogramming of CCR2+ monocytes at a site of sterile injury

Affiliations

A dynamic spectrum of monocytes arising from the in situ reprogramming of CCR2+ monocytes at a site of sterile injury

Daniela Dal-Secco et al. J Exp Med. .

Abstract

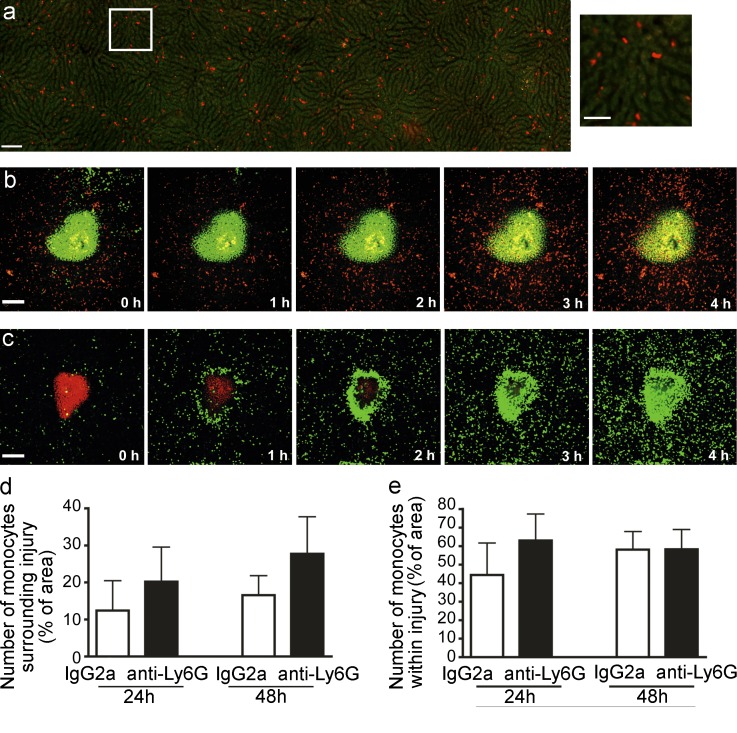
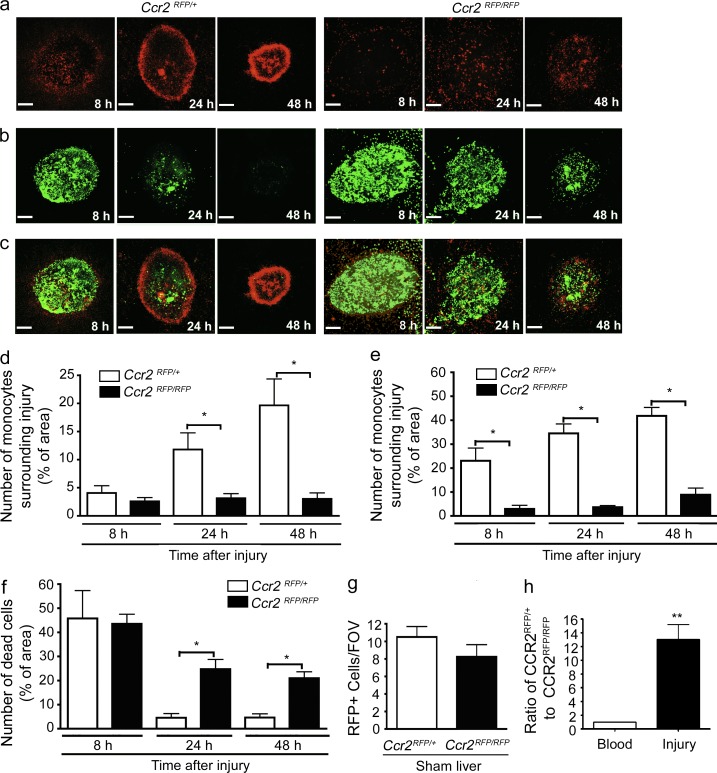
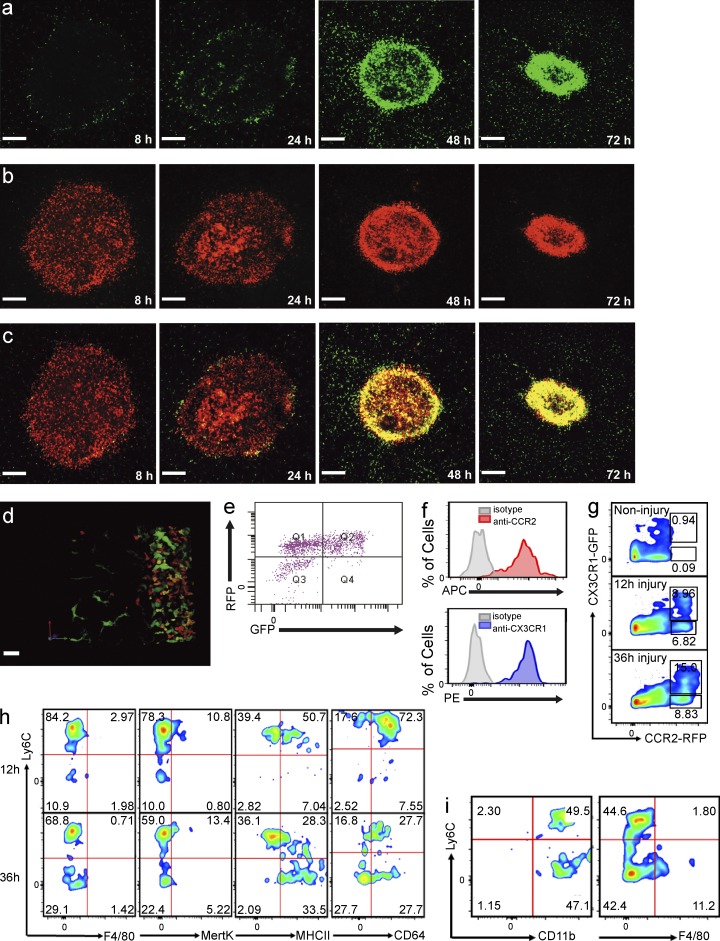
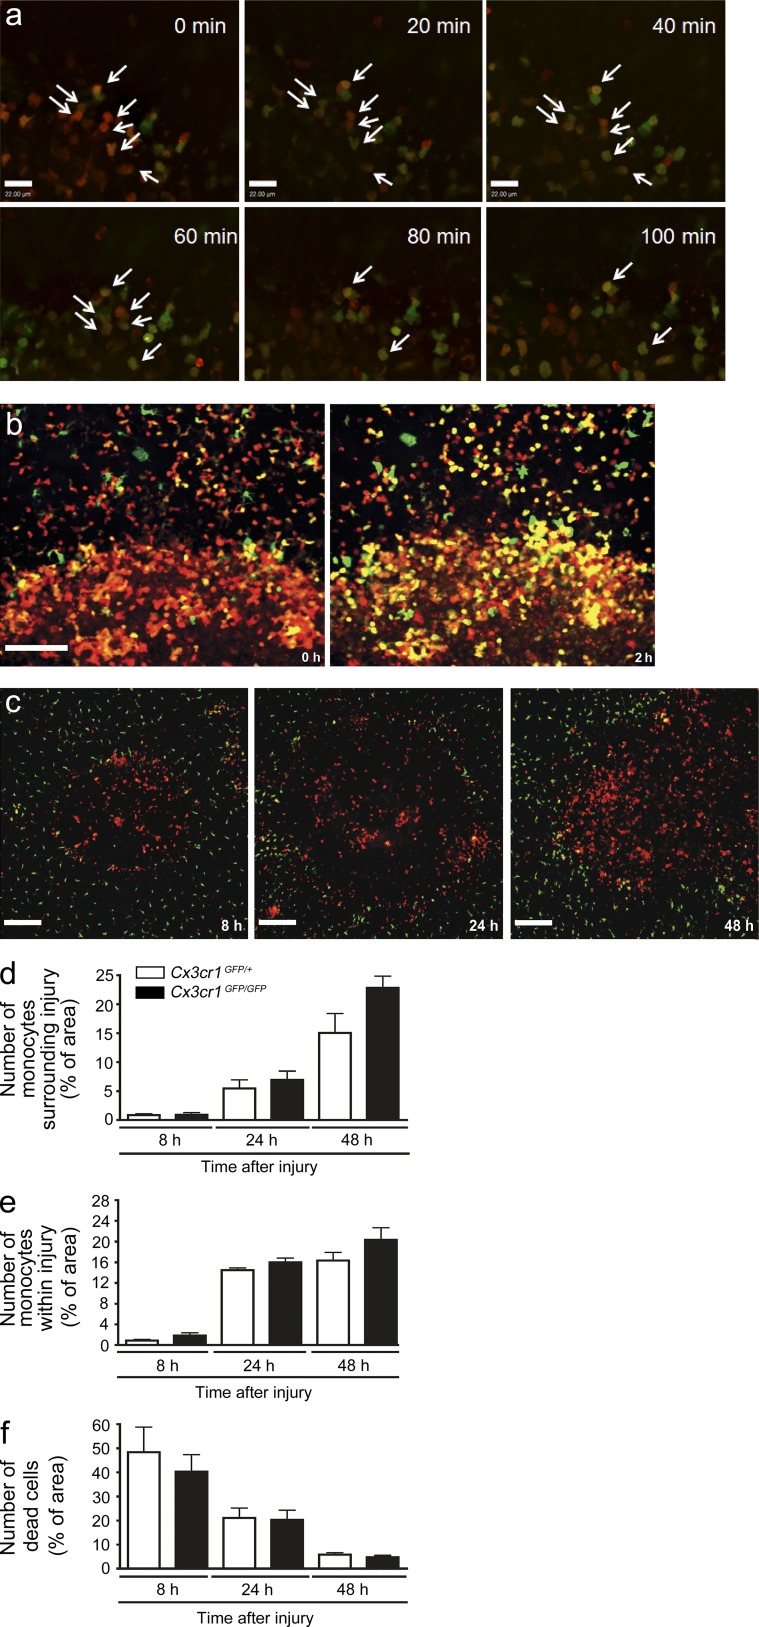
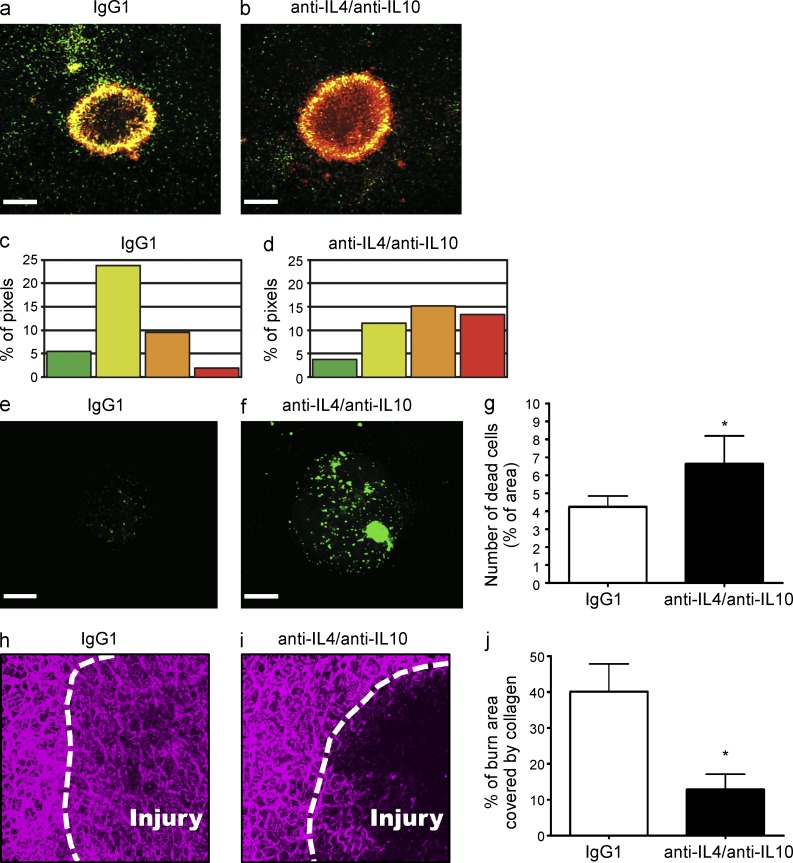
Monocytes are recruited from the blood to sites of inflammation, where they contribute to wound healing and tissue repair. There are at least two subsets of monocytes: classical or proinflammatory (CCR2(hi)CX3CR1(low)) and nonclassical, patrolling, or alternative (CCR2(low)CX3CR1(hi)) monocytes. Using spinning-disk confocal intravital microscopy and mice with fluorescent reporters for each of these subsets, we were able to track the dynamic spectrum of monocytes that enter a site of sterile hepatic injury in vivo. We observed that the CCR2(hi)CX3CR1(low) monocytes were recruited early and persisted for at least 48 h, forming a ringlike structure around the injured area. These monocytes transitioned, in situ, from CCR2(hi)Cx3CR1(low) to CX3CR1(hi)CCR2(low) within the ringlike structure and then entered the injury site. This phenotypic conversion was essential for optimal repair. These results demonstrate a local, cytokine driven reprogramming of classic, proinflammatory monocytes into nonclassical or alternative monocytes to facilitate proper wound-healing.


Figures

Figure 1.
Figure 1.
Neutrophils and monocytes traffic to site of hepatic sterile injury. (a, left) Mosaic of high-power images of CCR2+ cells in livers of Ccr2RFP/+ mice visualized by SD-IVM. Autofluorescent hepatocytes (green); RFP+ cells (red). Bar, 100 µm. (right) Magnification of area outlined in white. Bar, 50 µm. (b and c) Time lapse (0 to 4 h) images from a Ccr2RFP/+ (b) or a LysM-eGFP mouse (c) demonstrating the response of CCR2+ monocytes (red, b) or neutrophils (green, c) to focal hepatic injury (Sytox; green in b; propidium iodide; red in c). Bars, 200 µm. (d and e) Quantification of RFP+ monocytes (measured by % of area covered by RFP) either surrounding lesion (d) or within the lesion (e) following focal injury in Ccr2RFP/+ mice. Mice were pretreated with anti-Ly6G to deplete neutrophils or with Rat IgG2a as control. Error bars are the SEM. (d and e) Data are representative of at least four independent experiments.
Figure 2.
Figure 2.
Proinflammatory monocytes home to site of sterile injury and facilitate tissue repair. (a–c) Images from 8 to 48 h after focal necrotic injury of the liver demonstrating the response of Ccr2RFP/+ (left) and Ccr2RFP/RFP monocytes (right). (a) CCR2-RFP monocytes (red), (b) necrotic cells (green), (c) overlay. Bars, 200 µm. Data are representative of at least four independent experiments. (d and e) Quantification of RFP monocytes in Ccr2RFP/+ and Ccr2RFP/RFP mice (measured by percentage of area covered by RFP) either surrounding lesion (d) or within the lesion (e). Data are representative of at least two independent experiments, each with three mice per group. (f) Quantification of dead cells (measured as percentage of area covered by Sytox green) within the lesion. (g) Quantification of monocytes per field of view (FOV) in the liver from sham-operated Ccr2RFP/+ and CcrRFP/RFP mice. (d–g) n = 6 mice per group; error bars are the SEM. (h) Monocytes were harvested from the bone marrow of Ccr2RFP/+ and Ccr2RFP/RFP mice, mixed 1:1 and i.v. transferred to a WT recipient 6 h after focal injury. 24 h after transfer, the ratio of Ccr2RFP/+:Ccr2RFP/RFP monocytes were measured in the blood and surrounding the liver injury. Data are representative of one experiment with three mice per group.
Figure 3.
Figure 3.
CCR2+CX3CR1+ double-positive monocytes surround and enter the site of hepatic sterile injury. (a-c) Representative images taken 8 to 72 h after focal injury to the liver of Ccr2RFP/+/Cx3cr1GFP/+ mice. (a) GFP, (b) RFP, and (c) overlay. Bars, 200 µm. (d) Extended focus image generated from a z-stack of the monocytic ring surrounding a focal injury in the liver of a Ccr2RFP/+/Cx3cr1GFP/+ mouse demonstrating a spectrum of monocytes (red, orange, yellow, and green). (a–d) Images are representative of at least six independent experiments. (e) Representative FACS analysis of cells isolated from biopsy punches of the focal necrotic injury sites 48 h after injury, confirming the presence of a spectrum of monocytes. Pregated on size to exclude debris, viability, and CD11b+Ly6C+. (f) FACS analysis of cells obtained from the injury showing surface expression of CCR2 (top) and CX3CR1 (lower). Cells pregated on size, viability, Ly6GCD45+, and RFP+GFP+ followed by measurement of APC-conjugated anti-CCR2 labeling (top) or pregated on size, viability, and Ly6GCD45+, CCR2+GFP+, followed by measurement of PE-conjugated anti-CX3CR1 labeling (lower). (g) FACS analysis of CCR2+CX3CR1+ cells within the injury at the indicated time points. Cells pregated on size, viability, and Ly6GCD45+. (h) FACS phenotyping of the CCR2+CX3CR1+ cells 12 and 36 h after focal liver injury. Cells pregated on size, viability, and Ly6GCD45+. (i) FACS analysis of cells obtained 72 h after injury showing CD11b, Ly6C, and F4/80 expression. Cells pregated on size, viability, and Ly6GCD45+RFP+GFP+. All FACS data are representative of at least three independent experiments.
Figure 4.
Figure 4.
Accumulation of reparative CX3CR1+ monocytes at the site of sterile injury is independent of the CX3CR1 receptor. (a) A 2 mm × 1 mm biopsy punch of the sterile injury site was harvested from a Ccr2RFP/+/Cx3cr1GFP/+ mouse 24 h after injury, maintained at 37°C, and 5% CO2 and imaged. Time-lapsed images demonstrate a shift from red to green in individual cells (arrows). Bar, 22 µm. Data are representative of two independent experiments. (b) Image of the injury border immediately after tissue harvest (left) and again after 2 h of culture at 37°C and 5% CO2 (right). Bar, 100 µm. Data representative of two independent experiments. (c) Representative images taken from 8 to 48 h after focal liver injury demonstrating failure to recruit Ccr2RFP/RFP cells to a site of injury results in the lack of appearance of GFP+ cells in Ccr2RFP/RFP/Cx3cr1GFP/+ mice. (d and e) Quantification of GFP monocytes in Cx3cr1GFP/+ and Cx3cr1GFP/GFP mice (measured by percentage of area covered by GFP) either surrounding lesion (d) or within the lesion (e). (f) Quantification of dead cells (measured by percentage of area covered by Sytox orange) within the lesion. (d–f) n = 6 mice per group; error bars are the SEM.
Figure 5.
Figure 5.
CCR2+ monocytes transition into CCR2+CX3CR1+ monocytes at a site of sterile injury in the liver. (a and b) Conversion of RFP+ monocytes to RFP+GFP+ monocytes 48 h after focal liver injury in Ccr2RFP/+/Cx3cr1GFP/+ mice (a) or Ccr2RFP/+/Cx3cr1GFP/+ mice treated with anti–IL-4 and anti–IL-10-blocking antibodies (b). (c and d) Quantification of the percentage of each image corresponding to each of denoted hue in Ccr2RFP/+/Cx3cr1GFP/+ mice (c) or Ccr2RFP/+/Cx3cr1GFP/+ mice treated with anti–IL-4 and anti–IL-10 blocking antibodies (d). (e and f) Clearance of cellular debris 48 h after injury in control mice (e) and in anti–IL-4– and anti–IL-10–treated mice (f). (g) Quantification of dead cells (measured by percentage of area covered by Sytox green) within the lesion 48 h after injury. Bars, 200 µm; data are representative of three independent experiments. (h and i). Representative images of collagen in the liver of WT mice 72 h after focal injury. Mice treated with either an isotype control antibody (h) or anti–IL-4 and anti–IL-10-blocking antibodies (i). Injury border delineated with a dashed white line. (j) Quantification of collagen deposition within the burn 72 h after injury. Values expressed as a percentage of burn area covered by collagen. n > 3 mice per group; error bars, SEM. (h–j) Data representative of two independent experiments.

References

    1. Arnold L., Henry A., Poron F., Baba-Amer Y., van Rooijen N., Plonquet A., Gherardi R.K., and Chazaud B.. 2007. Inflammatory monocytes recruited after skeletal muscle injury switch into antiinflammatory macrophages to support myogenesis. J. Exp. Med. 204:1057–1069 10.1084/jem.20070075 - DOI - PMC - PubMed
    1. Auffray C., Fogg D., Garfa M., Elain G., Join-Lambert O., Kayal S., Sarnacki S., Cumano A., Lauvau G., and Geissmann F.. 2007. Monitoring of blood vessels and tissues by a population of monocytes with patrolling behavior. Science. 317:666–670 10.1126/science.1142883 - DOI - PubMed
    1. Carlin L.M., Stamatiades E.G., Auffray C., Hanna R.N., Glover L., Vizcay-Barrena G., Hedrick C.C., Cook H.T., Diebold S., and Geissmann F.. 2013. Nr4a1-dependent Ly6C(low) monocytes monitor endothelial cells and orchestrate their disposal. Cell. 153:362–375 10.1016/j.cell.2013.03.010 - DOI - PMC - PubMed
    1. Chtanova T., Schaeffer M., Han S.J., van Dooren G.G., Nollmann M., Herzmark P., Chan S.W., Satija H., Camfield K., Aaron H., et al. . 2008. Dynamics of neutrophil migration in lymph nodes during infection. Immunity. 29:487–496 10.1016/j.immuni.2008.07.012 - DOI - PMC - PubMed
    1. Engel D.R., Maurer J., Tittel A.P., Weisheit C., Cavlar T., Schumak B., Limmer A., van Rooijen N., Trautwein C., Tacke F., and Kurts C.. 2008. CCR2 mediates homeostatic and inflammatory release of Gr1(high) monocytes from the bone marrow, but is dispensable for bladder infiltration in bacterial urinary tract infection. J. Immunol. 181:5579–5586 10.4049/jimmunol.181.8.5579 - DOI - PubMed

Publication types