. 2015 Mar 24;10(11):1836-49.
doi: 10.1016/j.celrep.2015.02.051.

Activation of necroptosis in multiple sclerosis

Activation of necroptosis in multiple sclerosis

Dimitry Ofengeim et al. Cell Rep. .

Abstract

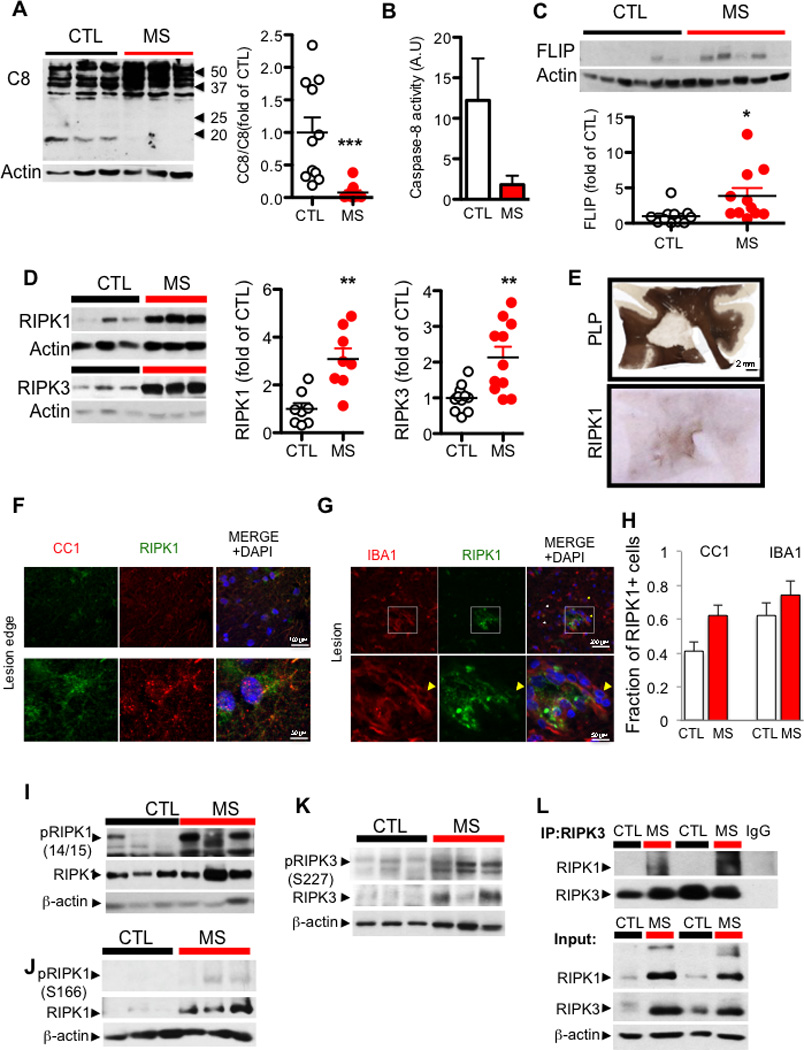
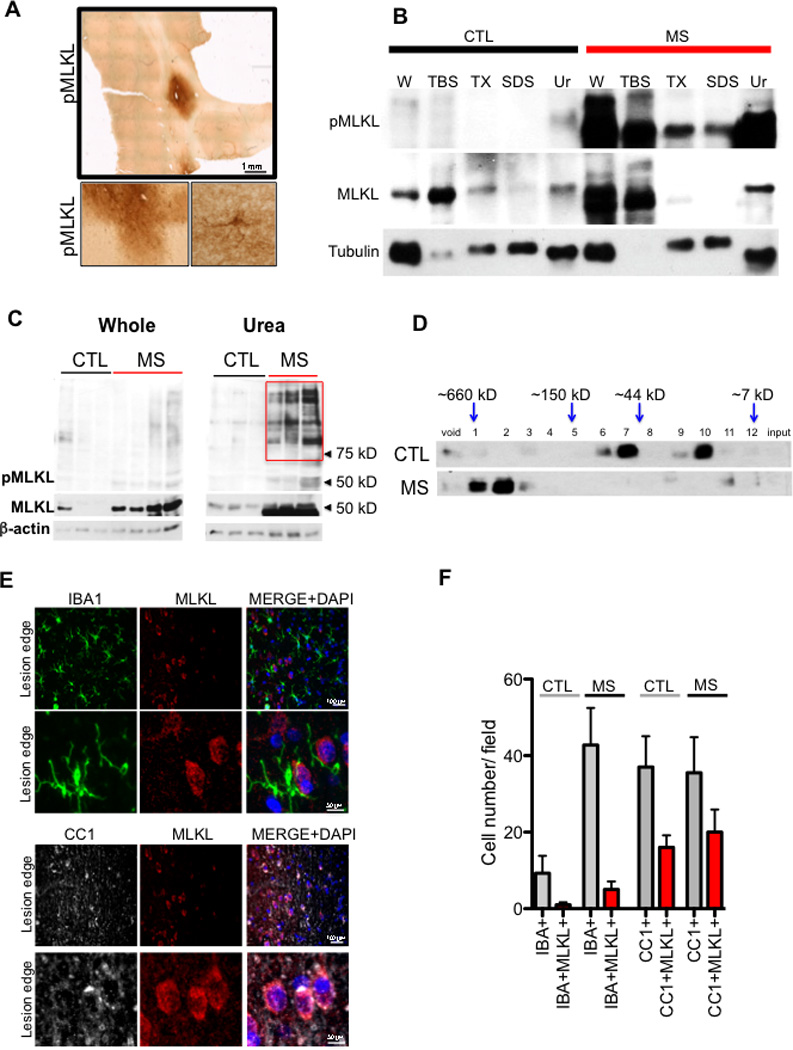
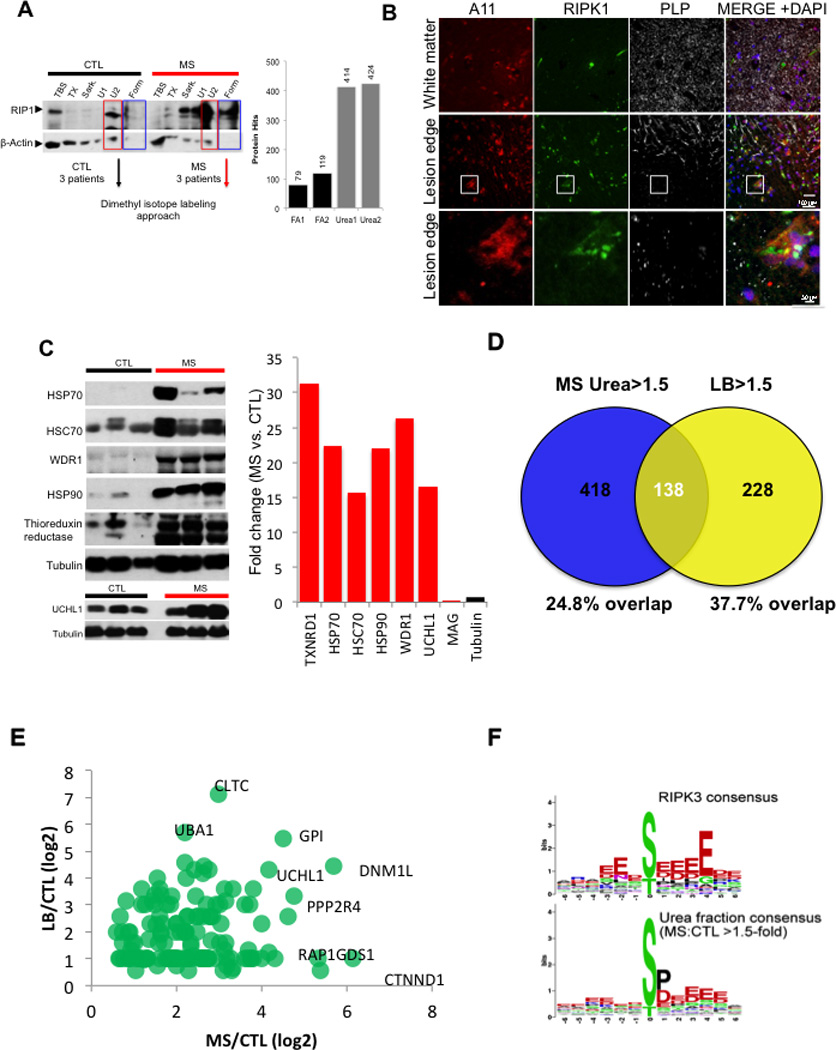
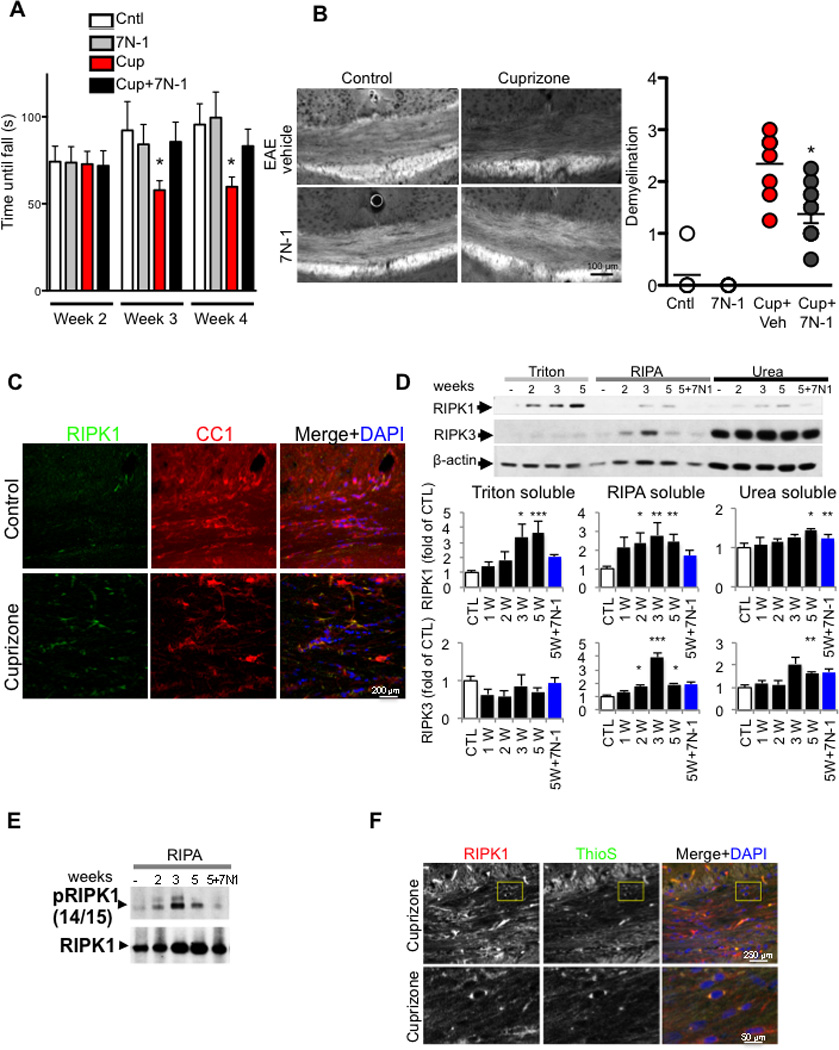
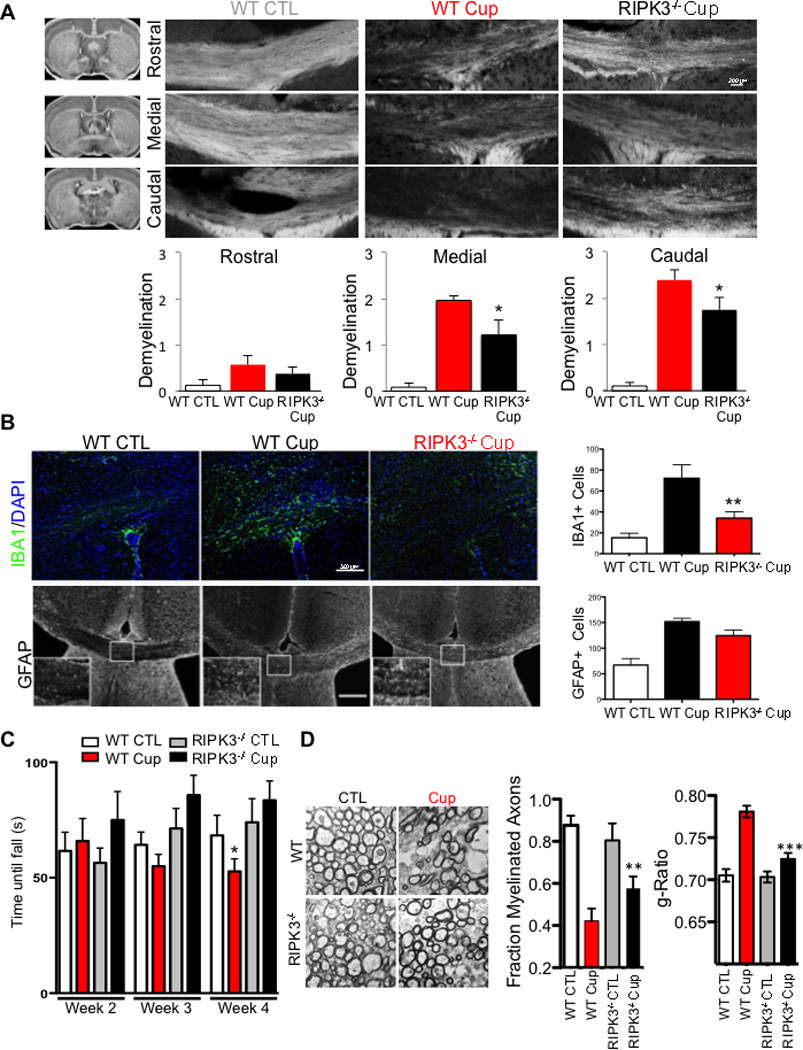
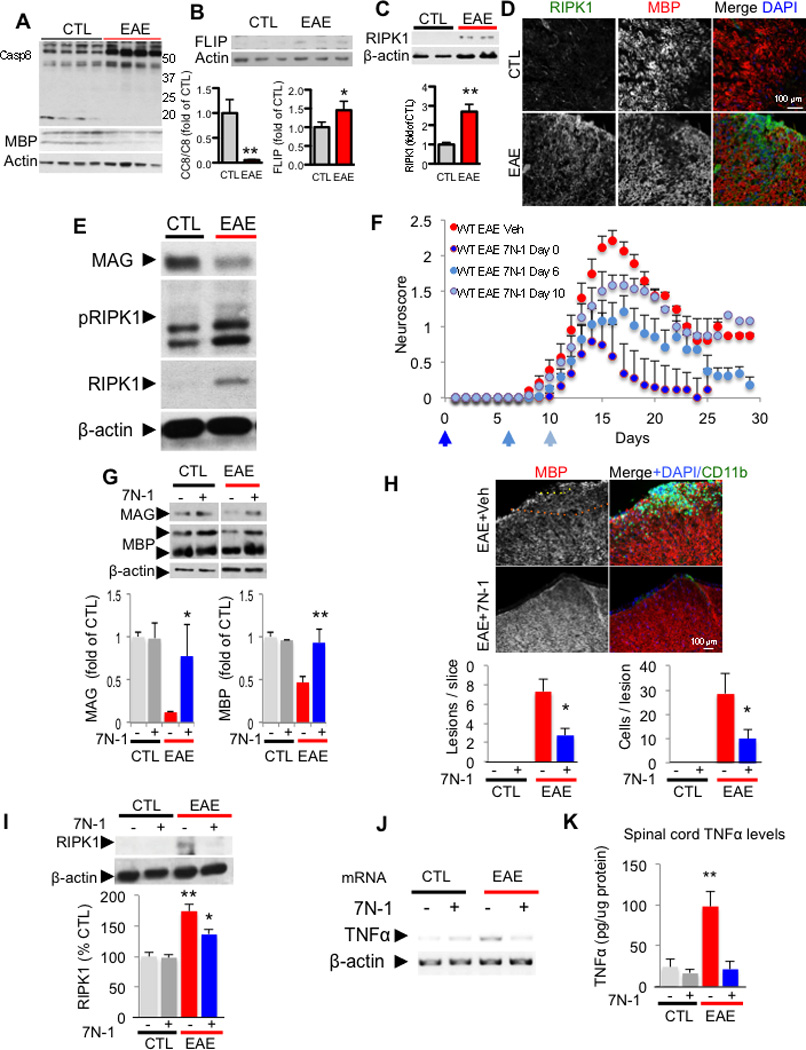
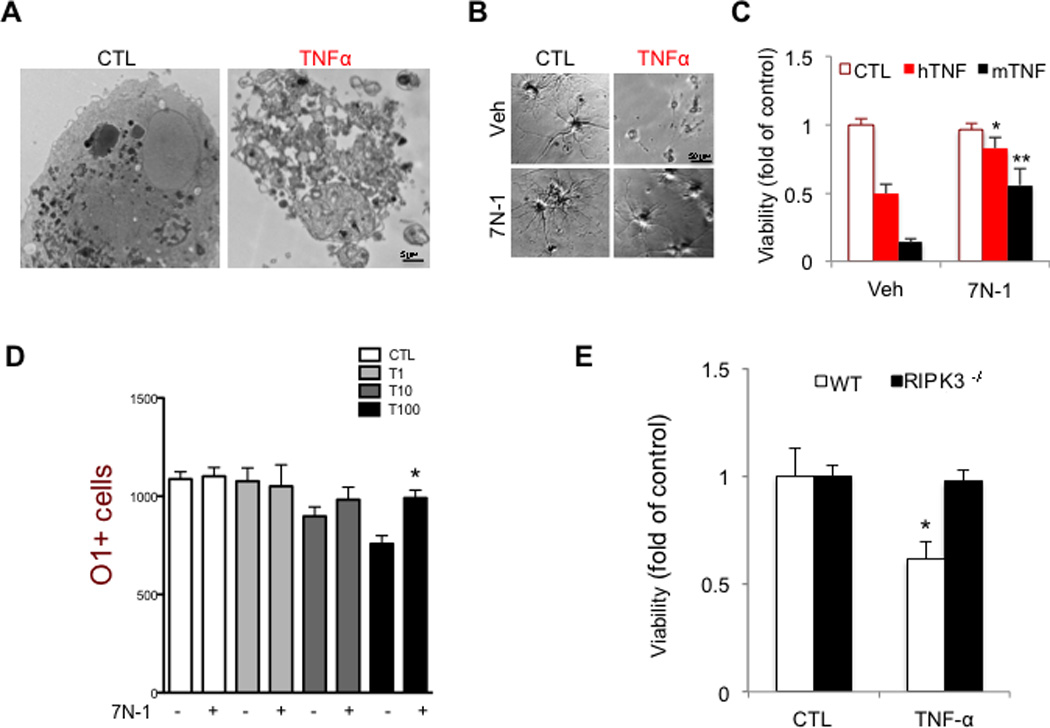
Multiple sclerosis (MS), a common neurodegenerative disease of the CNS, is characterized by the loss of oligodendrocytes and demyelination. Tumor necrosis factor α (TNF-α), a proinflammatory cytokine implicated in MS, can activate necroptosis, a necrotic cell death pathway regulated by RIPK1 and RIPK3 under caspase-8-deficient conditions. Here, we demonstrate defective caspase-8 activation, as well as activation of RIPK1, RIPK3, and MLKL, the hallmark mediators of necroptosis, in the cortical lesions of human MS pathological samples. Furthermore, we show that MS pathological samples are characterized by an increased insoluble proteome in common with other neurodegenerative diseases such as Alzheimer's disease (AD), Parkinson’s disease (PD), and Huntington's disease (HD). Finally, we show that necroptosis mediates oligodendrocyte degeneration induced by TNF-α and that inhibition of RIPK1 protects against oligodendrocyte cell death in two animal models of MS and in culture. Our findings demonstrate that necroptosis is involved in MS and suggest that targeting RIPK1 may represent a therapeutic strategy for MS.


Figures

Figure 1
Figure 1. Dysregulation of the apoptotic and necroptotic machinery in cortical white matter lesions of MS patients
(A) Western blotting analysis and quantifications of brain lysates from 11 control and 11 white matter lesions of MS cases probed with antibodies against caspase-8 and β-actin. The quantification is shown as bar graphs to the right. Data are represented as the normalized means ± SEM, n=11 replicates per group (*p<0.05, **p<0.01, ***p<0.001). (B) The caspase-8 specific activity (arbitrary units/ µg of brain tissue) was assessed in cell lysates from control and MS tissue. (C) Representative western blot analyses and quantifications of samples from 11 control and 11 white matter lesions of MS cases probed with antibodies against c-FLIP and β-actin. The quantification is shown as bar graphs at the bottom. Data are represented as the normalized means ± SEM, n=11 replicates per group (*p<0.05, **p<0.01, ***p<0.001). (D) Western blotting analysis of control and MS white matter lesion tissues for RIPK1 and RIPK3 levels in urea soluble fraction from 3 control and 4 MS patients (left). The bar graphs on the right quantified western blotting data from 11 control and 11 MS cases probed with antibodies against RIPK1 and RIPK3 and normalized to actin loading control. Data are represented as the normalized means ± SEM, n=11 replicates per group (**p<0.01). (E) PLP and RIPK1 immunostaining of a large MS lesion within the cortical white matter from a patient with primary progressive MS which showed strong reactivity for RIPK1 of all the tissues examined. (F) Immunostaining using anti-RIPK1 and CC1 antibody, an oligodendrocyte marker (upper panels). Higher magnification images of a CC1+ cell with RIPK1 expression (lower panels). (G) Immunostaining using anti-RIPK1 and IBA1 within the lesion (top panels); lower panels show higher magnification images highlighted in the white square. (H) Quantifications of RIPK1+ oligodendrocytes and microglia in normal white matter (CTL) tissues and in MS lesions (MS) were shown as bar graphs to the right. Data are represented as the normalized means ± SEM, n=4–6 images per group replicates per group. (I) A western blot of the urea soluble fraction from control and MS samples probed with antibodies against phospho-RIPK1 serine 166, total RIPK1, and β-actin. (J) A western blot of the urea soluble fraction from control and MS samples probed with antibodies against phospho-RIPK1 serine 14/15, total RIPK1 and β-actin. (K) A western blot of the urea soluble fraction from control and MS samples probed with antibodies against phospho-RIPK3 serine 227, total RIPK3, and β-actin. (L) The lysates from control and MS brain samples were immunoprecipitated with antibody against RIPK3 followed by western blotting analysis with antibodies against RIPK1 and RIPK3 (top); the input whole cell lysates were probed with the same antibodies, as well as β-actin.
Figure 2
Figure 2. Activation of MLKL in cortical white matter lesions of MS patients
(A) phospho-MLKL immunostaining in the cortical white matter lesion from a post mortem MS sample. Higher magnification images are shown below. (B) A sequential solubility analysis of MLKL from a control and a white matter lesion of a MS patient. The fractions – TBS soluble (TBS), 1% Triton soluble (TX), 2% SDS soluble (SDS) and 8M urea soluble (Ur). (C) A western blot of the whole cell lysate (left) and 8M urea soluble fraction (right) from control and MS samples probed with antibodies against phospho-MLKL, total MLKL, and β-actin. The red box in the urea fraction depicts higher molecular weight pMLKL+ bands found in the urea fraction of MS samples. (D) Brain lysates from 3 control individuals and 3 MS patients were subjected to fractionation using size exclusion column chromatography and the fractions were then analyzed by western blotting using anti-MLKL. (E-F) Immunostaining of MS cortical lesions using anti-MLKL, CC1 and IBA1 antibodies (E). A quantification of the cells that are positive for both IBA1/MLKL and CC1/MLKL (F). Higher magnification images of IBA1+ cells that lack of MLKL reactivity and CC1+ cells that show MLKL reactivity (lower panels on both IBA1 and CC1 immunostaining).
Figure 3
Figure 3. An increased insoluble proteomes in MS
(A) A sequential solubility analysis of RIPK1 in brain lysates from 3 control individuals and 3 MS patients. The fractions – TBS soluble (TBS), 1% Triton soluble (TX), 1% sarkosyl soluble (Sark), 8M urea soluble (U1), 2% SDS soluble (U2) and 70% formic acid soluble (Form). Full length RIPK1 is ∼75 kDa. Combined samples from 3 MS patients and 3 control individuals extracted with 8M urea were used for quantitative mass spectrometry analysis. (B) Immunostaining using anti-A11, RIPK1 and PLP at the lesion edge (top panels); lower panels show higher magnification images highlighted in the white square. (C) Western blotting analysis of the crude insoluble fraction from control and MS samples used to confirm the quantitative data obtained using mass spectrometry; the data in the bar graph is the average fold of enrichment of proteins identified by proteomic analysis in 8M urea fractions in MS vs. control samples. (D-E) Proteins enriched at least 1.5 fold in urea fraction of MS samples in common with the proteins associated with Lewy body in PD. The percentage of overlap (D) and a scatter plot of the common hits between MS and Lewy body in PD (E). (F) Consensus of proteins phosphorylated in MS is similar to the consensus of RIP3K substrates. Phosphopeptides increased by >1.5-fold in MS urea fraction compared to control urea fraction were analyzed by WebLogo software (http://weblogo.berkeley.edu/) to generate the consensus graph of urea soluble phosphoproteome. RIPK3 substrate consensus was obtained from PhosphoNetworks (http://www.phosphonetworks.org/).
Figure 4
Figure 4. Inhibition of RIPK1 kinase protects oligodendrocytes from necroptosis induced by cuprizone in vivo
(A) Mice were fed either control or 0.2 % cuprizone containing diet with vehicle or 7N-1 and assessed for motor deficit with rotarod test in double blind manner. The time until mice fell off the rotarod was measured. Data are means ± SEM, n=10–18 per group. (*p<0.05). (B) Representative images of sections from medial corpus callosum show the marked reduction of fluoromyelin fluorescence intensity following 5 weeks of cuprizone treatment. The images were scored in a double blind fashion and quantified for demyelination. Data are means ± SEM, n=5–8 per group. (*p<0.05). (C) Representative images of corpus callosum (CC) sections from control and cuprizone treated animals were immunostained by anti-RIPK1 and CC1, a marker for oligodendrocytes. (D) Mice were fed either control or 0.2 % cuprizone containing diet for the indicated times; CC was microdissected, lysed and sequentially separated as Triton (1%) soluble, RIPA soluble and urea soluble fractions and analyzed by western blot analysis using antibodies against RIPK1 and RIPK3 as indicated and normalized to β-actin. The quantifications were shown as bar graphs below. Data are represented as the normalized means ± SEM, n=5–8 replicates per group (*p<0.05, **p<0.01, ***p<0.001). (E) RIPA soluble fractions from CC of mice after 2, 3, or 5 weeks of cuprizone diet, or 5 weeks of cuprizone diet with 7N-1 were analyzed by western blotting for anti-RIPK1 and anti-p-S14/15 RIPK1. (F) Representative images of sections from medial CC show the increase of RIPK1 reactivity and ThioS staining, in cuprizone treated animals as compared to control treated animals following 5 weeks of cuprizone treatment.
Figure 5
Figure 5. RIPK3 deficiency protects against demyelination in the corpus callosum after cuprizone treatment
(A) Wild-type or RIPK3−/− mice were fed a normal diet with or without 0.2% cuprizone for 5 weeks to induce demyelination. Coronal sections were stained for myelin with fluoromyelin at rostral, medial and caudal parts of the CC, as indicated to the right of the images with a diagram from the Mouse Brain Library. The images were scored in a double blind fashion and quantified for demyelination. Data are means ± SEM, n=11–14 per group. (B) Coronal sections were stained with antibodies against the microglial marker IBA1 and the astrocyte marker GFAP. The amount of IBA1- and GFAP-positive cells/100 µm2 in the CC was quantified (Data are means ± SEM, n=5–6 per group). (C) Mice were fed either control diet or 0.2% cuprizone containing diet with vehicle or 7N-1 administration and assessed for motor deficit on the rotarod test in double blind manner. The time until mice fell off the rotarod was measured. Data are means ± SEM, n=10–12 per group (*p<0.05). (D) Ultrastructure of myelination in the CC was examined using electron microscopy. Representative images from WT and RIPK3−/− in both control and cuprizone treated groups are shown. Both the number of myelinated axons and the g-ratio of myelinated axons are quantified. n=2 animals per group, 30 images per animals and ∼200 axons quantified; data are means ± SEM, n=10–12 per group (*p<0.05).
Figure 6
Figure 6. Caspase-8 deficiency and RIPK1 activation in EAE
Western blotting analysis of control and EAE spinal cords (20 days post immunization) for caspase-8 (A), c-FLIPL (B). MBP and actin are used as a loading control. The graphs below represent the quantification of western blot results of caspase-8 full length and c-FLIPL in EAE spinal cords (15–20 days post immunization. Data are means ± SEM, n=6–8 animals per group). (C) Western blotting analysis of control and EAE spinal cord lysates for the expression of RIPK1 and bar graph quantification (below). (D) Representative images of spinal cord sections immunostained with anti-RIPK1, anti-MBP (myelin basic protein) and DAPI to show low RIPK1 reactivity in control untreated mice (CTL, upper panels) and increased RIPK1 immunostaining in the white matter after induction of EAE within an inflammatory lesion (lower panels; 17 days post immunization; 10–12 animals were used in each experimental group). (E) Western blotting analysis of control and EAE (15–17 days postimmunization) spinal cord lysates for anti-RIPK1 and anti-phospho-S14/15 RIPK1. β-actin is used as a loading control. (F) Clinical scores (scored in double blind manner) of vehicle (veh) and 7N-1 treated animals starting day 0, 6 or 10 after immunization of MOG 35–55 in CFA as indicated. Data from 3 independent experiments are summarized as the normalized mean ± SEM; n = 7–18 animals per group. (*p<0.05, **p<0.01, assessed by both one way ANOVA and t-test). (G) Western blotting analysis of spinal cord from either vehicle or 7N-1 treated control animals or vehicle 15–18 day post-induction of EAE with anti-MBP, anti-MAG (myelin associated glycoprotein) and anti-β-actin antibodies. Quantification of the levels of MAG and MBP normalized to β-actin is represented in graphs as ± SEM; n = 4–8 animals per group. (H) Representative images and quantification of spinal cord lesions and immunostaining with anti-MBP and anti-CD11b from control vehicle and 7N-1 treated (6 days after immunization) animals. The lesions were defined as >5 CD11b+ cells within an area of 2502 µm in the spinal cord white matter. The quantification is represented in graphs as ± SEM; n = 5 animals per group, 1–2 slices per animal from the same region of lumbar spinal cord (*p<0.05). (I) Western blotting analysis of spinal cords from either vehicle or 7N-1 treated control animals, 15–18 day post-induction of EAE with anti-RIPK1 and anti-β-actin antibodies and quantified to that of β-actin as % of the control, vehicle treated group± SEM. The quantification was from western blot data of n = 4–7 animals per group (*p<0.05, **p<0.01). The levels of TNFα mRNA (J) and protein (K) in the spinal cords of the control and treatment groups after 15–17 days of treatment were determined by RT-PCR and ELISA, respectively. The quantification is represented ± SEM; n = 6–9 animals per group (**p<0.01) in the graph.
Figure 7
Figure 7. Inhibition of RIPK1 kinase and RIPK3 protects oligodendrocytes from necroptosis induced by TNFα in vitro
(A) Electron micrographs of control and TNFα (8h) treated rat oligodendrocytes shows non-apoptotic morphology of a dying oligodendrocyte. Images were taken at 2900x direct magnification. (B-C) Rat oligodendrocytes (DIV 8) were treated with human (hTNF, 50 ng/mL) or mouse (mTNF, 10ng/mL) TNFα (24–36 h) and viability was assessed by using the CellTiterGlo assay (Promega). Representative images are shown. Data are represented as the normalized means ± SEM, n=5–9 replicates per group (*p<0.05). (D) Oligodendrocytes were plated in 96 well plates and treated with increasing amounts of mTNFα (as indicated: T1= 1ng/ml; T10=10ng/ml; T100=100ng/ml) for 48 h in the presence or absence of 7N-1. The cells were fixed and stained with DAPI and O1-antigen specific antibody. High throughput imaging and quantification was used to count the number of cells in each condition. (E) Murine oligodendrocytes, isolated from either wild-type or RIPK3−/− mice, were treated with mTNFα (50 ng/mL, 24–36 h). The cell viability was assessed using CellTiterGlo assay. Data are represented as the normalized means ± SEM, n=10–15 wells per group and repeated 2–4 times.

References

    1. Arai T, Hasegawa M, Akiyama H, Ikeda K, Nonaka T, Mori H, Mann D, Tsuchiya K, Yoshida M, Hashizume Y, et al. TDP-43 is a component of ubiquitin-positive taunegative inclusions in frontotemporal lobar degeneration and amyotrophic lateral sclerosis. Biochem Biophys Res Commun. 2006;351:602–611. - PubMed
    1. Arnett HA, Fancy SP, Alberta JA, Zhao C, Plant SR, Kaing S, Raine CS, Rowitch DH, Franklin RJ, Stiles CD. bHLH transcription factor Olig1 is required to repair demyelinated lesions in the CNS. Science. 2004;306:2111–2115. - PubMed
    1. Berger SB, Kasparcova V, Hoffman S, Swift B, Dare L, Schaeffer M, Capriotti C, Cook M, Finger J, Hughes-Earle A, et al. Cutting Edge: RIP1 kinase activity is dispensable for normal development but is a key regulator of inflammation in SHARPIN-deficient mice. J Immunol. 2014;192:5476–5480. - PMC - PubMed
    1. Blakemore WF. Observations on oligodendrocyte degeneration, the resolution of status spongiosus and remyelination in cuprizone intoxication in mice. J Neurocytol. 1972;1:413–426. - PubMed
    1. Buck D, Hemmer B. Treatment of multiple sclerosis: current concepts and future perspectives. J Neurol. 2011;258:1747–1762. - PubMed

Publication types

MeSH terms