. 2015 Mar 31;10(12):1992-2005.
doi: 10.1016/j.celrep.2015.02.058. Epub 2015 Mar 19.

Origins and impacts of new mammalian exons

Affiliations

Origins and impacts of new mammalian exons

Jason J Merkin et al. Cell Rep. .

Abstract

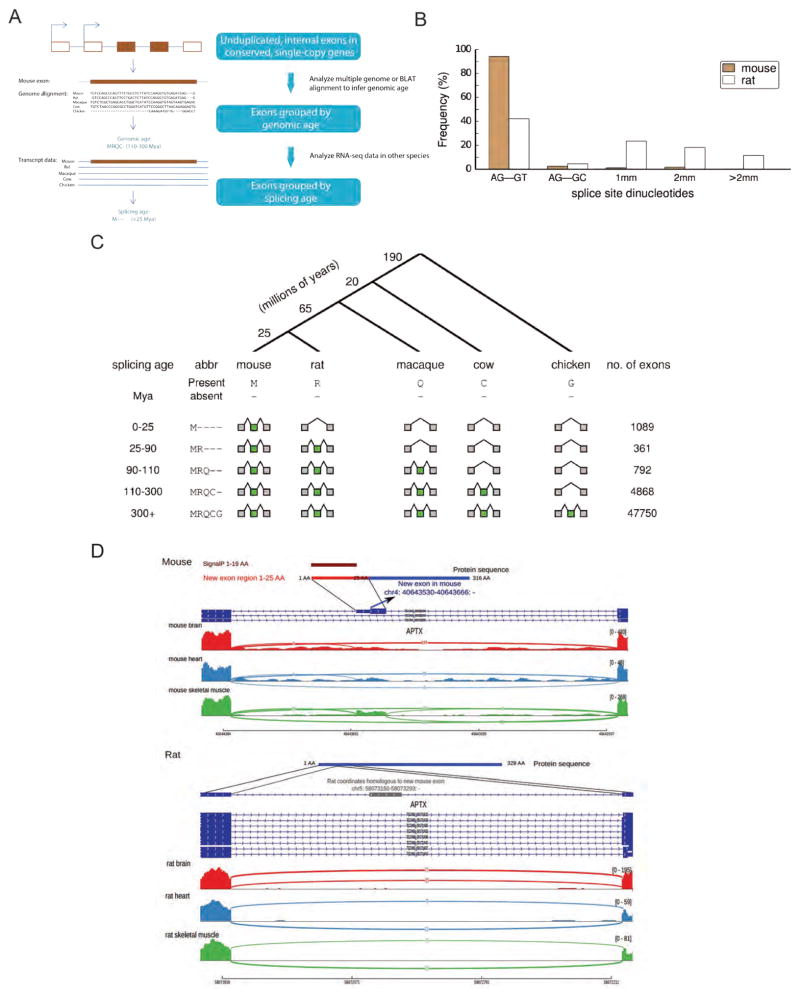
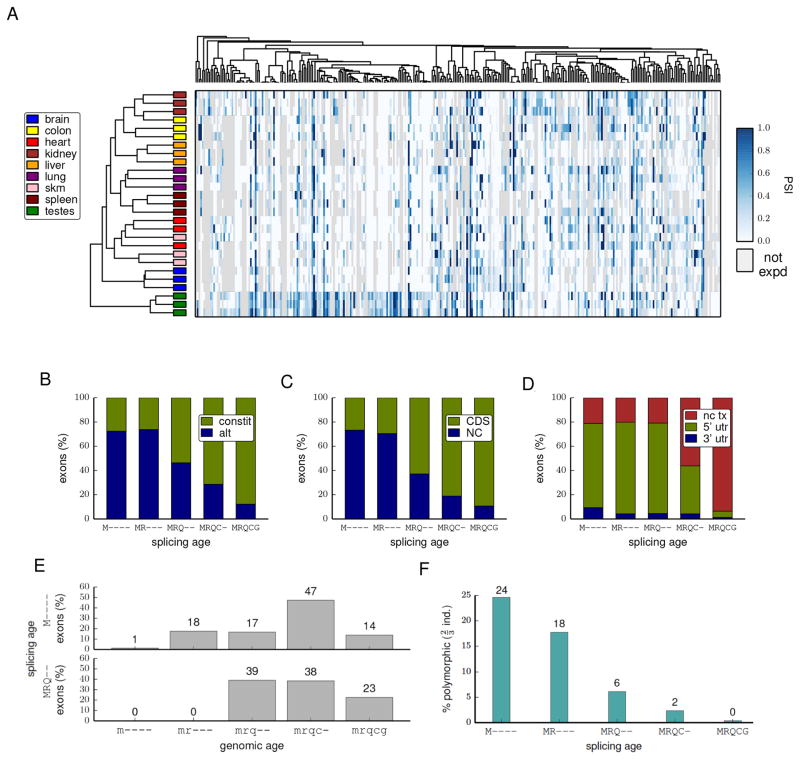
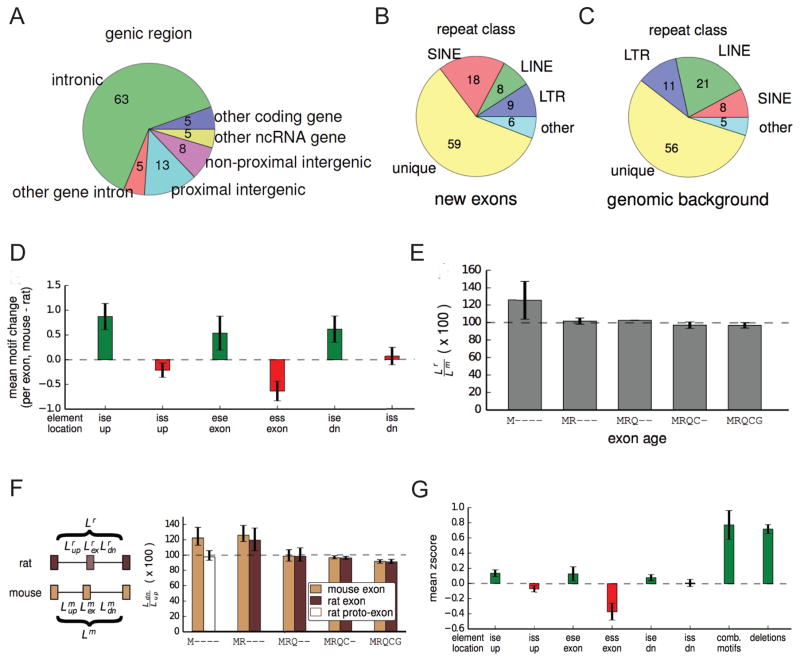
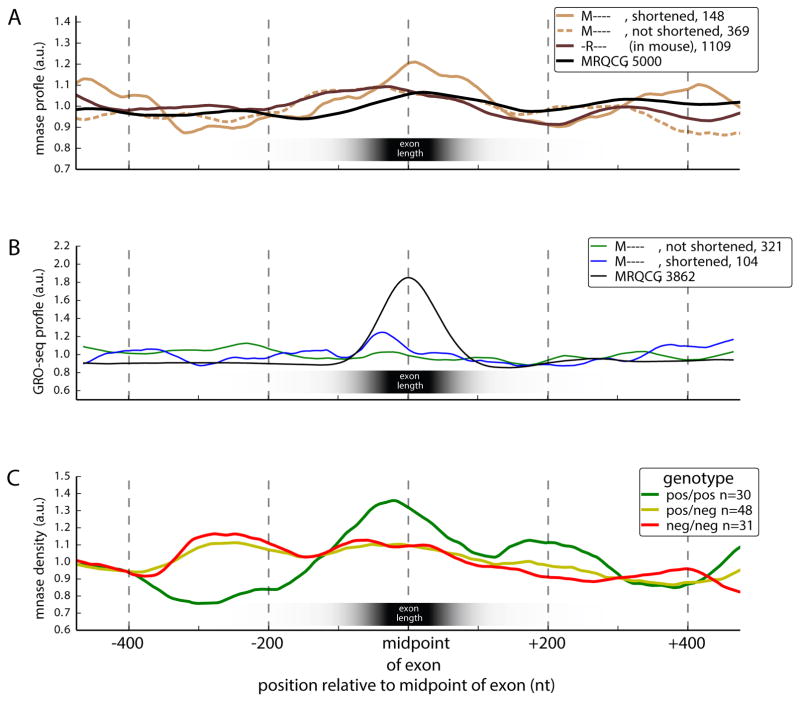
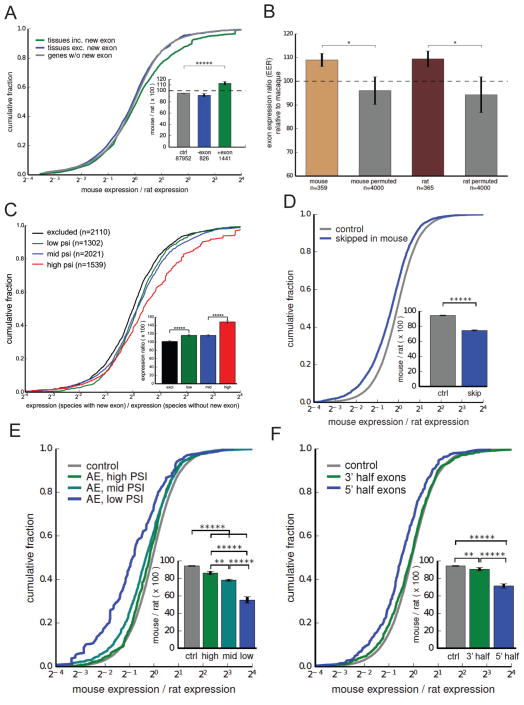
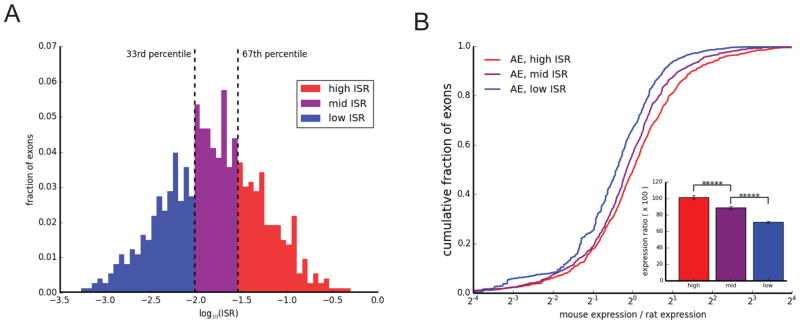
Mammalian genes are composed of exons, but the evolutionary origins and functions of new internal exons are poorly understood. Here, we analyzed patterns of exon gain using deep cDNA sequencing data from five mammals and one bird, identifying thousands of species- and lineage-specific exons. Most new exons derived from unique rather than repetitive intronic sequence. Unlike exons conserved across mammals, species-specific internal exons were mostly located in 5' UTRs and alternatively spliced. They were associated with upstream intronic deletions, increased nucleosome occupancy, and RNA polymerase II pausing. Genes containing new internal exons had increased gene expression, but only in tissues in which the exon was included. Increased expression correlated with the level of exon inclusion, promoter proximity, and signatures of cotranscriptional splicing. Altogether, these findings suggest that increased splicing at the 5' ends of genes enhances expression and that changes in 5' end splicing alter gene expression between tissues and between species.


Figures

Figure 1
Figure 1. Identification and classification of species- and lineage-specific exons
(A) A schematic of our bioinformatic pipeline to identify species- and lineage-specific exons (Methods). We considered all internal exons in each target species (here, mouse) and aligned to other exons in the same gene to exclude cases of exon duplication (Kondrashov and Koonin, 2001). Multiple alignments of orthologous gene sets were used to assign an orthologous region to each exon in other species, and the pattern of genomic presence/absence was used to assign the genomic age by parsimony. Presence/absence of RNA-seq evidence of an overlapping exon in the orthologous region in each species was then used to determine the splicing age, again using parsimony. (B) The proportion of mouse-specific exons and corresponding rat proto-exons with specific dinucleotide sequences at the 3' and 5' splice sites (1mm indicates one mismatch relative to the AG-GY consensus, 2mm = 2 mismatches, etc.). (C) Top: a phylogenetic tree presenting the main species used for dating exons and the branch lengths in millions of years. Bottom: mouse exons of increasing splicing age, their pattern of presence/absence in various species, and the number of each class of exons identified. (D) Example of a mouse-specific exon that encodes a predicted N-terminal signal peptide by SignalP (Bendtsen et al., 2004). A portion of the mouse aprataxin (Aptx) gene is shown (Ensembl ID ENSMUSG00000028411), together with homologous sequences from rat. Transcript structures shown in dark blue (the gray box in rat is the genomic segment homologous to the mouse-specific exon), with RNA-seq read density from three tissues shown below (arcs represent splice junction reads). See also Figure S1, Table S3.
Figure 2
Figure 2. Evolutionarily young exons differ from older exons in many properties
(A) Average-linkage hierarchical agglomerative clustering of samples (horizontal axis) or exons (vertical axis) based solely upon PSI values of mouse-specific exons. The tissue of origin of each sample is colored according to the key at left and the PSI value is visualized in the heat map on a white-blue scale (gray indicates gene not expressed in tissue). (B) The proportions of exons of various ages that are alternatively or constitutively spliced. (C) The proportion exons of various ages that contain coding sequence (CDS) or are entirely non-coding (NC) is shown. (D) The proportions of non-coding exons of various ages that are located in non-coding transcripts (nc tx), or in 5' or 3' UTRs of coding transcripts. (E) The distributions of genomic ages of exons with splicing ages M---- or MRQ--. Genomic age is represented by the same five-letter code in lowercase. (F) The proportion of mouse exons of various ages that were detected in only 2 out of 3 individuals or where the splicing status (alternative or constitutive) in one individual differed from the other two mice. See also Table S4.
Figure 3
Figure 3. A variety of genomic changes are associated with novel exon splicing
(A) Proportion of mouse-specific exons that map to different classes of genomic regions in rat. Mouse-specific exons that mapped to intergenic regions were further classified as proximal intergenic if they were closer to the orthologous gene than any other gene, or otherwise non-proximal intergenic. (B) Proportion of mouse-specific exons that overlap with various classes of repeats. (C) Proportion of mouse genome that belongs to various repeat categories. (D) The change in SRE number in various regions in and around a new exon associated with its creation (mean ± SEM). (E) The change in length of the entire intron region between rat and mouse (see diagram in (F)). The length in rat is plotted as a percentage of the length in mouse (mean ± SEM). (F) The relative length of the downstream intron as a percentage of the upstream intron (mouse) or the downstream aligned intron/region as a percentage of the upstream aligned intron/region (rat) (mean ± SEM). The rat bar in the M---- class is hatched to indicate that the region is not an exon in rat. (G) The magnitude of each change associated with splicing of M---- exons was converted into a z-score based upon the distribution of such changes between mouse and rat in MRQCG exons. Motifs that are expected to promote splicing are colored in green and changes that are expected to inhibit splicing are shown in red. See also Figures S2, S3, S4.
Figure 4
Figure 4. Upstream intronic deletions are associated with increased exonic nucleosome occupancy and transcription pausing
(A) Nucleosome positioning (measured by MNase protection) around various sets of exons. (B) Density of global run-on sequencing (GRO-seq) reads, showing the position of elongating RNA Pol II. (C) Nucleosome positioning (measured by protection from MNase treatment) around exons with a structural sQTL in the upstream intron binned by sQTL genotype. See also Figure S4, S5.
Figure 5
Figure 5. Inclusion of new exons is associated with increased species-specific gene expression changes
Throughout the figure, statistical significance by Mann-Whitney U test is indicated by asterisks (* P < 0.05, ** P < 0.01, *** P < 0.001, **** P < 0.0001, ***** P < 0.00001). (A) Fold change in gene expression between mouse and rat. Inset: mean ± SEM of displayed distributions. (B) Mean EEI values, calculated as the ratio of the mean gene expression in tissues where a novel exon is included to the mean expression in tissues where inclusion of the exon is not detected. This ratio is calculated in a related species with matched tissues, and the ratio of these two values is plotted (mean ± SEM). (C) Fold change in gene expression of mouse- and rat-specific exons between species with new exons (mouse, rat) and aligned closest species without new exon (rat, mouse, respectively), binned by the PSI of the exon in the tissue. (D) Fold change in gene expression between mouse and rat in genes where an ancestrally present exon has become skipped in mouse. (E) Fold change in gene expression between mouse and rat in genes where an old exon has become skipped in mouse, binned by the PSI of the exon in the tissue. (F) Fold change in gene expression between mouse and rat in genes where an old exon has become skipped in mouse, binned by location of the exon within the gene. See also Figure S6.
Figure 6
Figure 6. Increase in species-specific gene expression is associated with a lower ISR (Incomplete Splicing Ratio)
(A) Histogram of ISR values (on a log-scale) of rat constitutive exons which are ancestrally present but have become skipped in mouse. (B) Fold change in gene expression between mouse and rat in genes where an ancient exon has become skipped in mouse, binned by ISR as in (A). Statistical significance by Mann-Whitney U test is indicated by asterisks, as in Figure 5 (***** P < 0.00001).

References

    1. ABECASIS GR, AUTON A, BROOKS LD, DEPRISTO MA, DURBIN RM, HANDSAKER RE, KANG HM, MARTH GT, MCVEAN GA. An integrated map of genetic variation from 1,092 human genomes. Nature. 2012;491:56–65. - PMC - PubMed
    1. ALEKSEYENKO AV, KIM N, LEE CJ. Global analysis of exon creation versus loss and the role of alternative splicing in 17 vertebrate genomes. RNA. 2007;13:661–70. - PMC - PubMed
    1. BARBOSA-MORAIS NL, IRIMIA M, PAN Q, XIONG HY, GUEROUSSOV S, LEE LJ, SLOBODENIUC V, KUTTER C, WATT S, COLAK R, KIM T, MISQUITTA-ALI CM, WILSON MD, KIM PM, ODOM DT, FREY BJ, BLENCOWE BJ. The evolutionary landscape of alternative splicing in vertebrate species. Science. 2012;338:1587–93. - PubMed
    1. BENDTSEN JD, NIELSEN H, VON HEIJNE G, BRUNAK S. Improved prediction of signal peptides: SignalP 3.0. Journal of molecular biology. 2004;340:783–95. - PubMed
    1. BENTLEY DL. Coupling mRNA processing with transcription in time and space. Nature reviews. Genetics. 2014;15:163–75. - PMC - PubMed

Publication types