. 2015 Apr 16;58(2):371-86.
doi: 10.1016/j.molcel.2015.02.002. Epub 2015 Mar 19.

High-resolution chromatin dynamics during a yeast stress response

Affiliations

High-resolution chromatin dynamics during a yeast stress response

Assaf Weiner et al. Mol Cell. .

Abstract

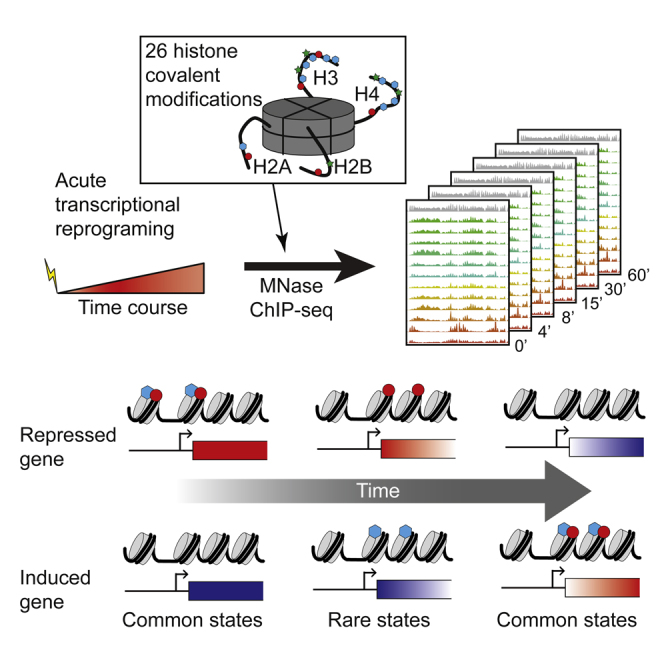
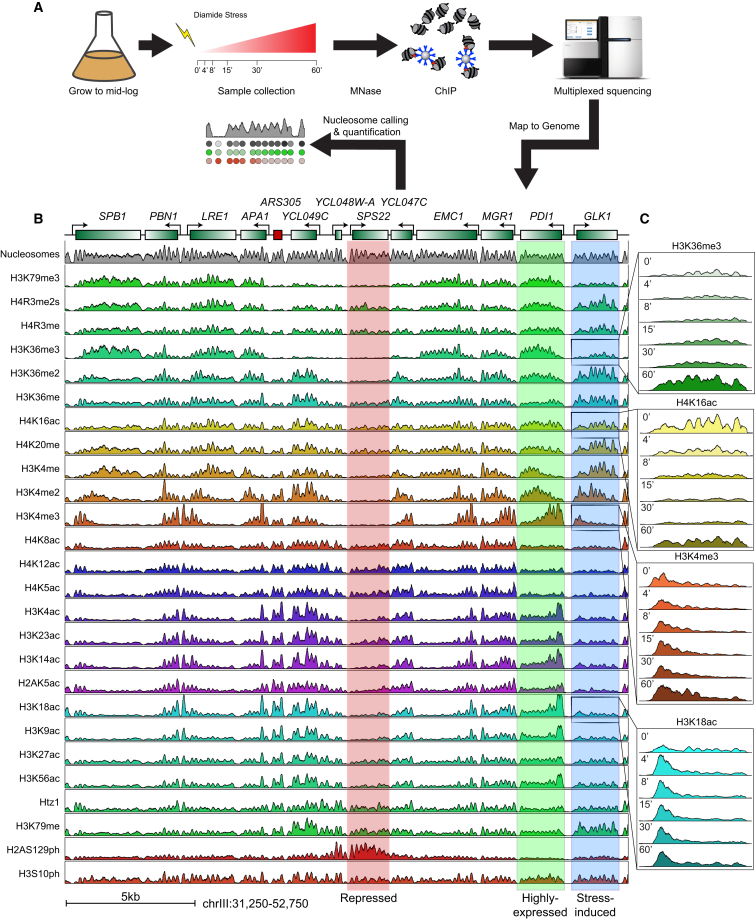
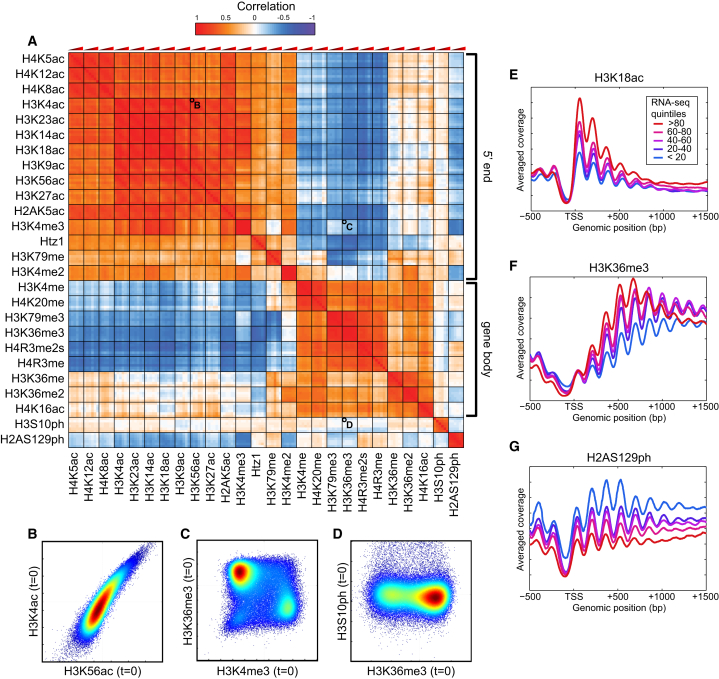
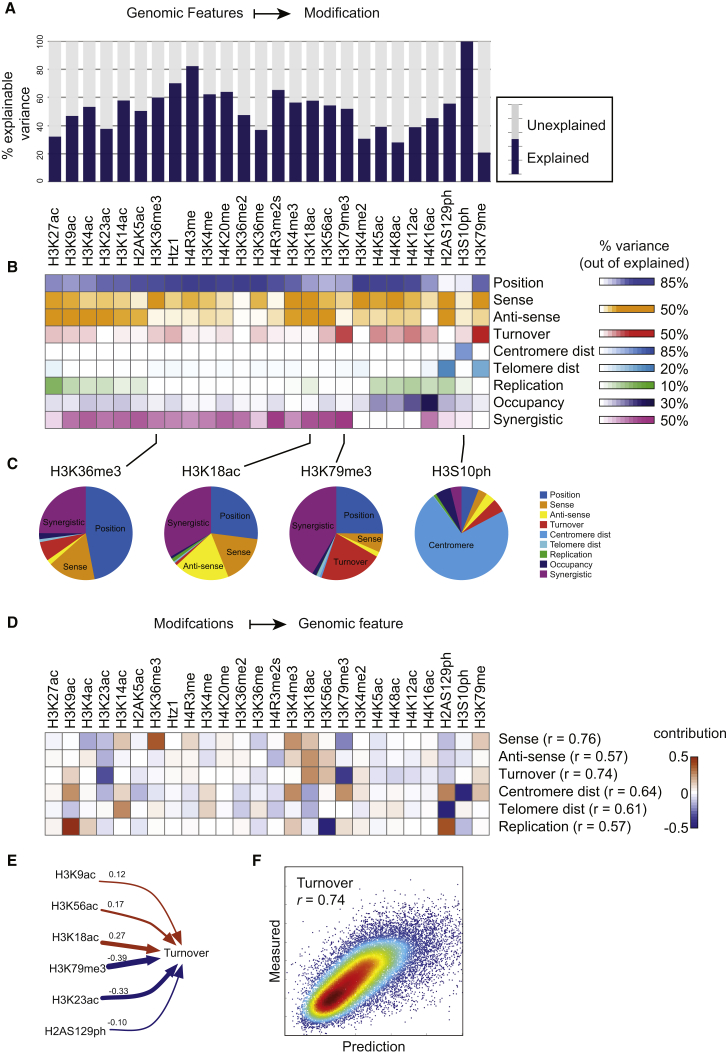
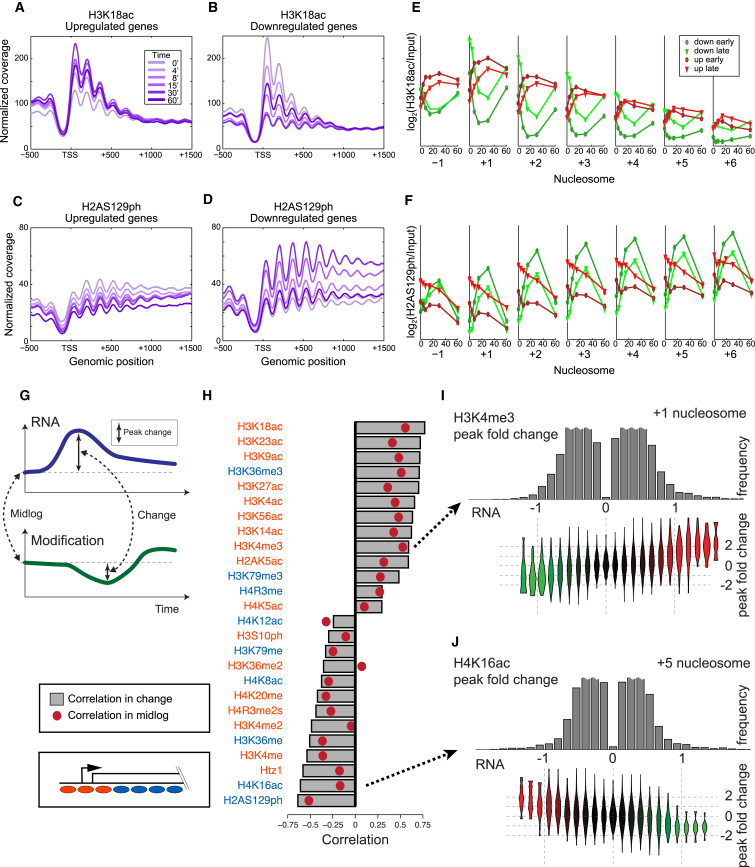
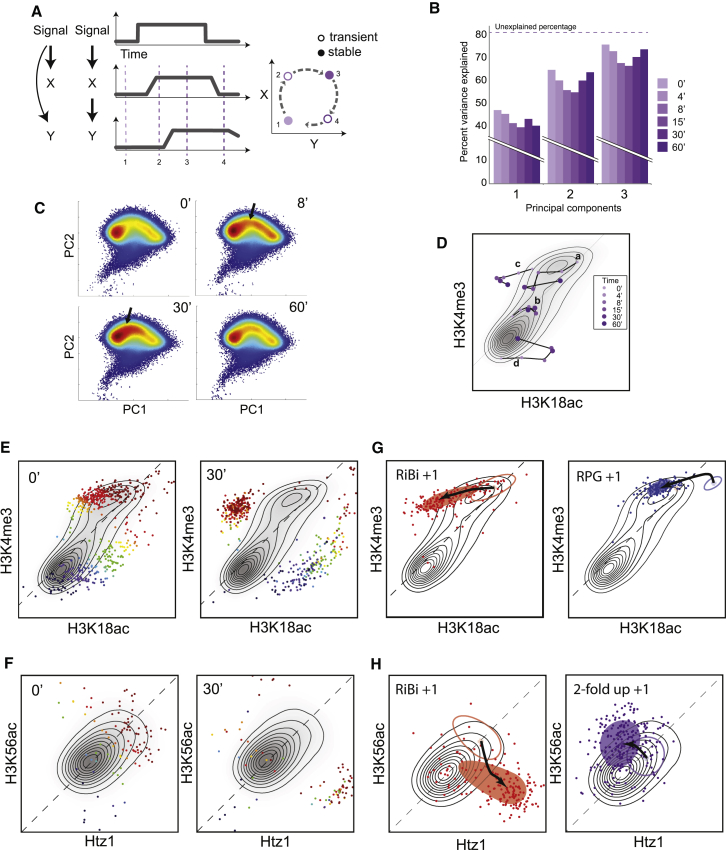
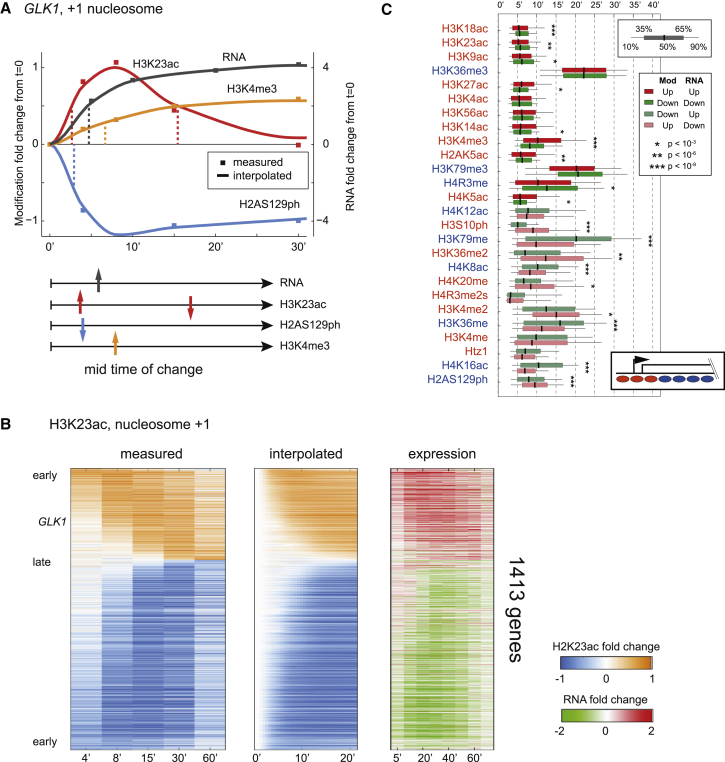
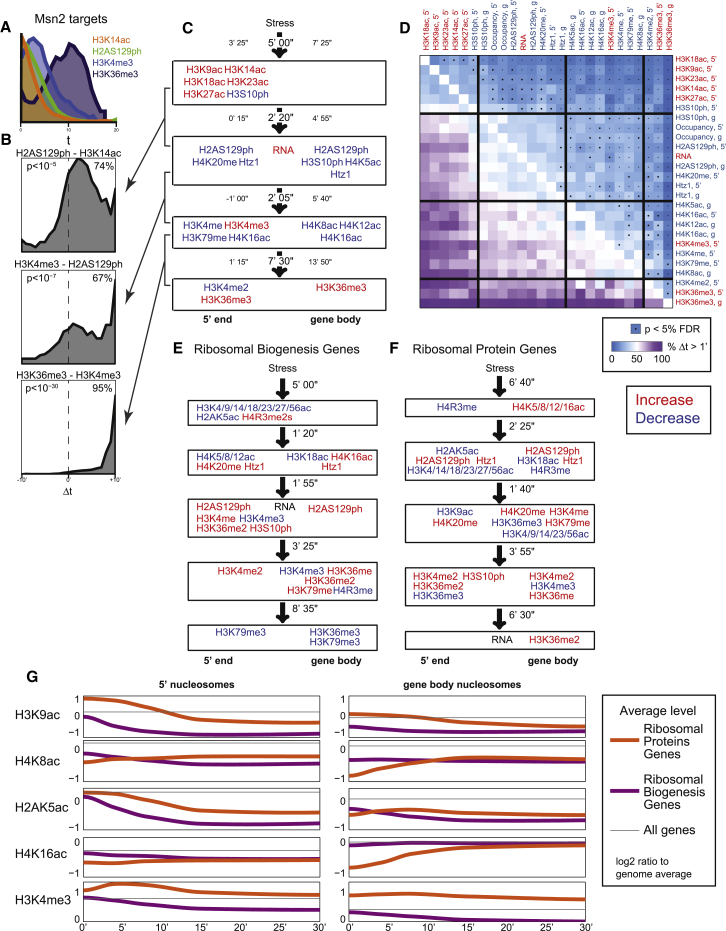
Covalent histone modifications are highly conserved and play multiple roles in eukaryotic transcription regulation. Here, we mapped 26 histone modifications genome-wide in exponentially growing yeast and during a dramatic transcriptional reprogramming-the response to diamide stress. We extend prior studies showing that steady-state histone modification patterns reflect genomic processes, especially transcription, and display limited combinatorial complexity. Interestingly, during the stress response we document a modest increase in the combinatorial complexity of histone modification space, resulting from roughly 3% of all nucleosomes transiently populating rare histone modification states. Most of these rare histone states result from differences in the kinetics of histone modification that transiently uncouple highly correlated marks, with slow histone methylation changes often lagging behind the more rapid acetylation changes. Explicit analysis of modification dynamics uncovers ordered sequences of events in gene activation and repression. Together, our results provide a comprehensive view of chromatin dynamics during a massive transcriptional upheaval.


Figures

None
Graphical abstract
Figure 1
Figure 1
Epigenomic Landscape of a Yeast Stress Response (A) Experimental outline. Yeast were subject to 1.5 mM diamide stress, and cultures were harvested for MNase-ChIP-seq mapping at the indicated time points. (B) Steady-state histone modification landscape for budding yeast. ChIP-Seq signal for 26 histone modifications and nucleosome mapping data. Top panel shows genomic annotations. (C) Histone modification dynamics over GLK1, a typical stress-induced gene. Data are shown for six time points following diamide stress.
Figure 2
Figure 2
Characterization of Histone Modification Patterns during Mid-Log Growth (A) Correlation matrix for 26 histone modifications. For each modification, six time points are arranged from t = 0 to t = 60 from left to right. (B–D) Scatterplots for strongly correlated (B), uncorrelated (C), and anticorrelated (D) pairs of modifications. Each scatterplot compares levels of the two modifications, normalized to nucleosome occupancy, for 66,360 individual nucleosomes in the yeast genome at t = 0. Colors indicate density. (E–G) Metagene profiles for exemplary histone modifications. For each modification, data were aligned by the transcription start site (TSS) of annotated genes, grouped according to transcription rate (Churchman and Weissman, 2011).
Figure 3
Figure 3
Determinants of the Steady-State Modification Landscape (A) Predicting modification data from genomic features. A model incorporating genomic features (sense and antisense transcription (Churchman and Weissman, 2011), nucleosome turnover rate (Dion et al., 2007), distance from centromere and telomere, replication timing (Raghuraman et al., 2001), and nucleosome position) predicts genomic patterns of all 26 histone marks. Plot shows the percent of signal explained per histone modification (see Figure S2B). (B) Contribution of genomic processes to explanatory power of the model. Heatmap shows the percentage of explained signal that is lost when a given process is removed from the model. Synergistic refers to remaining explained variance not lost upon removing any single feature. (C) Pie charts showing the variance explained by different aspects of the model for the indicated modifications. (D) Predicting genomic features from modification data. For each entry, the heatmap shows the sparse linear regression coefficient for the mark in question. (E) Turnover model parameters from (D) are shown here in numeric form. (F) Turnover model accurately captures turnover rates genome-wide. Model predictions (x axis) are scatterplotted against experimental turnover data (y axis).
Figure 4
Figure 4
Dynamics of Histone Modifications during the Stress Response (A and B) Metagenes showing levels of the transcription-correlated H3K18ac mark, averaged for upregulated (A) or downregulated (B) genes in response to diamide stress. (C and D) As in (A) and (B), for the repression-correlated H2AS129ph modification. (E and F) Dynamics of H3K18ac (E) or H2AS129ph (F) changes over time are shown averaged for various nucleosome positions along a gene body—the −1, +1, +2, etc. nucleosomes—as indicated. For each nucleosome, time course data for the modification in question are averaged for genes upregulated, or downregulated, relatively rapidly or slowly (Experimental Procedures). (G) Schematic of approach to correlations between histone modification dynamics and transcriptional dynamics. (H) Correlations calculated as shown in (G), with red dots showing mid-log correlations, and gray bars showing correlations between diamide-induced change in modification and change in transcription. (I and J) The correspondence between modification changes during diamide stress and transcription changes. In each case, a specific nucleosome location (+1, +5) is indicated. (Top panel) Histogram of the maximal change in the listed modification in response to diamide. (Bottom panel) Violin plots of changes in mRNA abundance for the genes carrying the nucleosomes in the bins above.
Figure 5
Figure 5
Changes in Histone Modification Space during Stress (A) Schematic showing one potential mechanism leading to increased combinatorial complexity during a transient response. Briefly, if two histone marks are correlated but exhibit different relative response kinetics, then early during a change in transcription the nucleosomes will carry the rapid mark but lack the lagging mark. (B) Principal Component Analysis of all 26 histone modifications. Percent variance explained for different time points. (C) Transient population of low-density modification space during stress. Density of nucleosomes across the first two Principal Components at the indicated diamide time points. Arrows show regions that are more highly populated from t = 8 to 30 than during mid-log growth. (D) Visualization of histone modification trajectories. Contour map shows the predominant locations of nucleosomes in the indicated two-dimensional modification space at t = 0. Arrows indicate the paths of four specific nucleosomes during the diamide time course. (E) Transient population of new regions of histone modification space. (Left panel) Two-dimensional contour map for nucleosomes at t = 0 for H3K4me3 and H3K18ac. Nucleosomes that will fall significantly (Experimental Procedures) outside this contour during stress are color coded according to their location at t = 0. (Right panel) The t = 30 locations of nucleosomes that move to rare regions, with the t = 0 contour. (F) As in (E), but for Htz1 and H3K56ac. (G and H) Coherent groups of nucleosomes account for the unusual nucleosomes during stress. Trajectories for specific sets of nucleosomes as indicated, with the t = 0 domain marked by an empty oval, and the stress domain marked by points and a filled oval.
Figure 6
Figure 6
Analysis of Histone Modification Dynamics (A) Extraction of kinetic parameters from time course data. RNA abundance and the indicated modification levels for the GLK1 +1 nucleosome. For each time course we extracted the maximal response (h) and the time to half-maximal response (t1/2). (B) Comparison of measurements with extracted kinetic data, with rows showing individual genes. (Left panel) Time course data for H3K23ac levels at the +1 nucleosome sorted by t1/2; (middle panel) interpolated data; (right panel) mRNA abundance changes. (C) Genome-wide kinetic offsets for up- and downregulated genes. For each modification, boxplot of the t1/2 is shown for up- or downregulated genes, as indicated.
Figure 7
Figure 7
Cascades of Chromatin Events Differ between Gene Sets (A) Distribution of t1/2 values for the four indicated marks for all MSN2-induced genes. (B) Gene-by-gene analysis for differences in modification onset times. The distribution of the difference in t1/2 is calculated for all individual genes in the MSN2-dependent gene set for the indicated modification pair. (C) Four “epochs” in the MSN2 induction cascade. Groups of histone modification changes: modifications in each group roughly co-occur, but differ significantly in timing in pairwise comparisons from the other groups. For each box, the mean and 25th and 75th percentile values are shown for the distribution of differences in t1/2 between modifications in adjacent boxes. (D) Heatmap showing all pairwise comparisons for MSN2-dependent upregulated genes. Each row/column represents a modification and a genic location (5′ end, or gene body) that changes coherently for MSN2-upregulated genes. Heavy lines show demarcation for the boxes summarized in (C). (E and F) Summary diagrams, as in (C), for RiBi genes and RPGs, as indicated. (G) Interpolated time course data for RiBi genes and RPGs for 30 min of stress response. The shown modification levels are averages, for genes in each group, of the log2 ratio to genome-wide mean at t = 0.

References

    1. Adkins M.W., Carson J.J., English C.M., Ramey C.J., Tyler J.K. The histone chaperone anti-silencing function 1 stimulates the acetylation of newly synthesized histone H3 in S-phase. J. Biol. Chem. 2007;282:1334–1340. - PubMed
    1. Blecher-Gonen R., Barnett-Itzhaki Z., Jaitin D., Amann-Zalcenstein D., Lara-Astiaso D., Amit I. High-throughput chromatin immunoprecipitation for genome-wide mapping of in vivo protein-DNA interactions and epigenomic states. Nat. Protoc. 2013;8:539–554. - PubMed
    1. Buratowski S. Progression through the RNA polymerase II CTD cycle. Mol. Cell. 2009;36:541–546. - PMC - PubMed
    1. Celic I., Masumoto H., Griffith W.P., Meluh P., Cotter R.J., Boeke J.D., Verreault A. The sirtuins hst3 and Hst4p preserve genome integrity by controlling histone h3 lysine 56 deacetylation. Curr. Biol. 2006;16:1280–1289. - PubMed
    1. Churchman L.S., Weissman J.S. Nascent transcript sequencing visualizes transcription at nucleotide resolution. Nature. 2011;469:368–373. - PMC - PubMed

Publication types

MeSH terms

Associated data