. 2015 May 1;194(9):4122-9.
doi: 10.4049/jimmunol.1401328. Epub 2015 Mar 23.

T cell-extrinsic CD18 attenuates antigen-dependent CD4+ T cell activation in vivo

Affiliations

T cell-extrinsic CD18 attenuates antigen-dependent CD4+ T cell activation in vivo

Xingxin Wu et al. J Immunol. .

Abstract

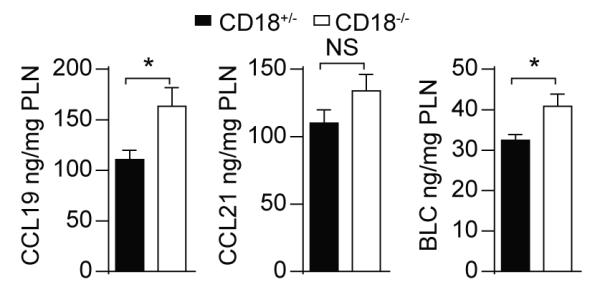
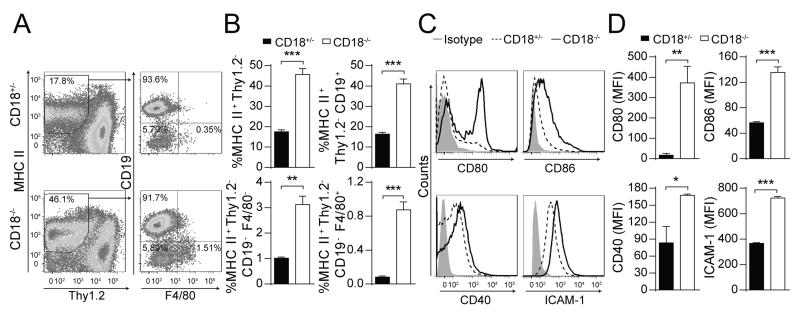
The β2 integrins (CD11/CD18) are heterodimeric leukocyte adhesion molecules expressed on hematopoietic cells. The role of T cell-intrinsic CD18 in trafficking of naive T cells to secondary lymphoid organs and in Ag-dependent T cell activation in vitro and in vivo has been well defined. However, the T cell-extrinsic role for CD18, including on APC, in contributing to T cell activation in vivo is less well understood. We examined the role for T cell-extrinsic CD18 in the activation of wild-type CD4(+) T cells in vivo through the adoptive transfer of DO11.10 Ag-specific CD4(+) T cells into CD18(-/-) mice. We found that T cell-extrinsic CD18 was required for attenuating OVA-induced T cell proliferation in peripheral lymph nodes (PLN). The increased proliferation of wild-type DO11.10 CD4(+) T cells in CD18(-/-) PLN was associated with a higher percentage of APC, and these APC demonstrated an increased activation profile and increased Ag uptake, in particular in F4/80(+) APC. Depletion of F4/80(+) cells both reduced and equalized Ag-dependent T cell proliferation in CD18(-/-) relative to littermate control PLN, demonstrating that these cells play a critical role in the enhanced T cell proliferation in CD18(-/-) mice. Consistently, CD11b blockade, which is expressed on F4/80(+) macrophages, enhanced the proliferation of DO11.10 CD4(+) T cells in CD18(+/-) PLN. Thus, in contrast to the T cell-intrinsic essential role for CD18 in T cell activation, T cell-extrinsic expression of CD18 attenuates Ag-dependent CD4(+) T cell activation in PLN in vivo.


Figures

Figure 1
Figure 1. Antigen-mediated T cell proliferation is more efficient in CD18−/− lymph nodes
CD4+ T cells (0.5×10⁶) from Thy1.1+ DO11.10 mice were CFSE stained and adoptively transferred into CD18+/− or CD18−/− Thy1.2+ mice. (A-F) 24h later mice were immunized s.c. with (A-B) 25 μg OVA + 25 μg LPS (n=3/group; representative of 3 independent experiments), (C-D) 25 μg endotoxin-free OVA (n=3/group), or (E-F) 10 μg OVA323-339 peptide (n=3/group). (G-H) 24h later mice were immunized i.v. with 25 μg OVA + 25μg LPS (n=3/group; representative of 2 independent experiments). (A-H) PLN were harvested 3d after immunization and analyzed for late divisions as assessed by CFSE in Thy1.1+DO11.10+CD4+ T cells. Shown are representative flow plots and summary graphs with % cells in late divisions (A,C,E,G) and % DO11.10+ Thy1.1+ CD4+ T cells within PLN (B, D, F, H). Mean + SEM. *, p<0.05; **, p<0.01; ***, p<0.001.
Figure 2
Figure 2. CD18−/− lymph nodes are hypocellular with intact germinal centers, but do not result in increased lymphopenia-induced proliferation
(A) PLN from CD18+/− and CD18−/− mice were examined by H&E. Images are representative of 5 mice each. Scale bar = 100 μM. (B) An inguinal LN was harvested and total cells were counted (n=3/group). (C) CD4+ T cells (0.5×10⁶) from Thy1.1+ DO11.10 mice were CFSE stained and adoptively transferred into CD18+/− or CD18−/− Thy1.2+ mice. 4d later PLN were harvested and examined for divisions as assessed by CFSE. (Left) Representative flow plots with % undivided cells and (right) summary graph of % undivided cells. Mean + SEM for n=3/group (representative of 3 independent experiments). NS, not significant; ***, p<0.001.
Figure 3
Figure 3. CD18−/− lymph nodes express increased chemokines
CD18+/− (n=11) and CD18−/− (n=9) PLN were harvested and assessed for expression of CCL19, CCL21 and BLC. Data are expressed as ng/mg of PLN. Mean + SEM. NS, not significant; *, p<0.05.
Figure 4
Figure 4. CD18−/− lymph nodes have an increased percentage of adoptively transferred WT antigen-specific CD4+ T cells compared to CD18+/− lymph nodes
CD4+ T cells (0.5×10⁶) from Thy1.1+ DO11.10 mice were CFSE stained and adoptively transferred into CD18+/− or CD18−/− Thy1.2+ mice. 18h later PLN were harvested and examined for DO11.10+ CD4+ T cells. (A) (left) Representative flow plots and (right) summary graph of %DO11.10+ CD4+ T cells within gated CD4+ T cells. (B) %DO11.10+ CD4+ T cells within overall PLN. Mean + SEM for n=3/group (representative of 4 independent experiments). **, p<0.01.
Figure 5
Figure 5. CD18−/− BMDC are equivalent to CD18+/− BMDC in Ag-induced CD4+ T cell activation in vitro
DO11.10+ CD4+ T cells were co-cultured at a ratio of 10:1 or 40:1 with (A) immature or (B) mature (1μg/ml LPS x 1d) BMDC from CD18+/− or CD18−/− mice, and with increasing doses of OVA323-339 peptide as indicated. Thymidine incorporation was assessed. Mean + SEM. Samples were run in triplicate and are representative of 2 independent experiments.
Figure 6
Figure 6. CD18−/− PLN have an increased percentage of activated APC
(A-B) PLN from CD18+/− and CD18−/− mice were examined for the percentage of MHCII+Thy1.2, MHCII+Thy1.2-CD19+, MHCII+Thy1.2CD19F4/80 and MHCII+Thy1.2CD19F4/80+ cells. (A) Representative flow cytometry plots. (B) Summary graphs of percentages of each cellular subset. (C-D) PLN from CD18+/− and CD18−/− mice were gated on MHCII+Thy1.2 cells and examined for surface expression of CD80, CD86, CD40 and ICAM-1. (C) Representative flow cytometry plots. (D) Summary graphs of surface marker expression (MFI). Mean + SEM for n=3/group (representative of at least two independent experiments). *, p<0.05; **, p<0.01; ***, p<0.001.
Figure 7
Figure 7. A higher percentage of APC in CD18−/− lymph nodes express antigen after s.c. immunization
CD18+/− or CD18−/− mice were injected s.c. with 25 μg DQ-OVA and 4h later PLN were harvested and gated on MHCII+Thy1.2 cells. The percentage of MHCII+, MHCII+CD19+, MHCII+CD19F4/80, MHCII+CD19F4/80+ cells expressing DQ-OVA was assessed. (A) Representative flow cytometry plots for the initial two subsets to demonstrate gating. (B) %DQOVA expressing cells within each APC subset. (C) %DQ-OVA expressing APC within overall PLN population. Mean + SEM for n=3/group (representative of 4 independent experiments). **, p<0.01; ***, p<0.001.
Figure 8
Figure 8. PLN macrophage depletion decreases antigen-mediated CD4+ T cell proliferation to equivalent levels in CD18+/− and CD18−/− PLN
200 μl of clodronate-liposome or PBS-liposome was injected s.c. into Thy1.2+ CD18+/− or CD18−/− mice to deplete macrophages from PLN. 5d later, 0.5×10⁶ CD4+ T cells from Thy1.1+ DO11.10 mice were CFSE stained and adoptively transferred into the mice. 24h later mice were immunized s.c. with 25 μg OVA + 25 μg LPS. PLN were harvested 3d after immunization and analyzed for (A) late divisions as assessed by CFSE in Thy1.1+ DO11.10+ CD4+ T cells. (left) Representative flow plots and (right) summary graphs of % Thy1.1+ DO11.10+ CD4+ T cells in late divisions. (B) %DO11.10+ CD4+ T cells in PLN. Mean + SEM for n=3/group (representative of 2 independent experiments). Comparisons are between PBS-liposomes and clodronate-liposomes in the same genotype or as indicated. NS, not significant; *, p < 0.05; **, p < 0.01.
Figure 9
Figure 9. CD11b inhibits antigen-mediated CD4+ T cell proliferation in vivo
0.5×10⁶ CD4+ T cells from Thy1.1+ DO11.10 mice were CFSE stained and adoptively transferred into WT Balb/c mice. 18h after transfer 200 μg anti-CD11b (blocking antibody) or 200 μg isotype control (rat IgG2b) was injected i.p., and 24h after initial transfer, mice were immunized s.c. with 25μg OVA + 25μg LPS. PLN were harvested 3d after immunization and analyzed for late divisions as assessed by CFSE in Thy1.1+ DO11.10+ CD4+ T cells. (A) (left) Representative flow plots with % cells in late divisions and (right) summary graphs of % cells in late divisions. (B) % Thy1.1+ DO11.10+ CD4+ T cells within PLN. *, p<0.05. Mean + SEM (n=3/group; repeated in two independent experiments).

References

    1. Hynes RO. Integrins: bidirectional, allosteric signaling machines. Cell. 2002;110:673–687. - PubMed
    1. Larson RS, Springer TA. Structure and function of leukocyte integrins. Immunol Rev. 1990;114:180–217. - PubMed
    1. Bunting M, Harris ES, McIntyre TM, Prescott SM, Zimmerman GA. Leukocyte adhesion deficiency syndromes: adhesion and tethering defects involving beta 2 integrins and selectin ligands. Curr Opin Hematol. 2002;9:30–35. - PubMed
    1. Kishimoto TK, Hollander N, Roberts TM, Anderson DC, Springer TA. Heterogeneous mutations in the beta subunit common to the LFA-1, Mac-1, and p150,95 glycoproteins cause leukocyte adhesion deficiency. Cell. 1987;50:193–202. - PubMed
    1. Villablanca EJ, Cassani B, von Andrian UH, Mora JR. Blocking lymphocyte localization to the gastrointestinal mucosa as a therapeutic strategy for inflammatory bowel diseases. Gastroenterology. 2011;140:1776–1784. - PMC - PubMed

Publication types