. 2015;59(6):3606-10.
doi: 10.1128/AAC.05186-14. Epub 2015 Mar 23.

Trends in susceptibility of Escherichia coli from intra-abdominal infections to ertapenem and comparators in the United States according to data from the SMART program, 2009 to 2013

Affiliations

Trends in susceptibility of Escherichia coli from intra-abdominal infections to ertapenem and comparators in the United States according to data from the SMART program, 2009 to 2013

Sibylle H Lob et al. Antimicrob Agents Chemother. 2015.

Abstract

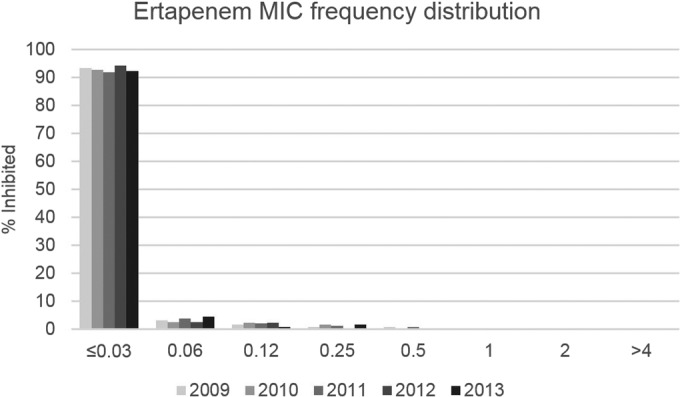
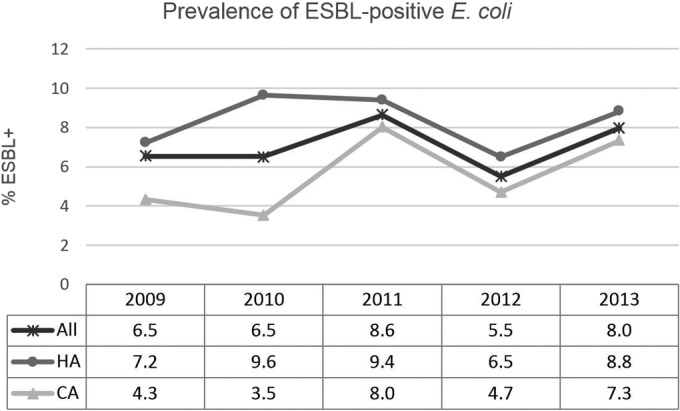
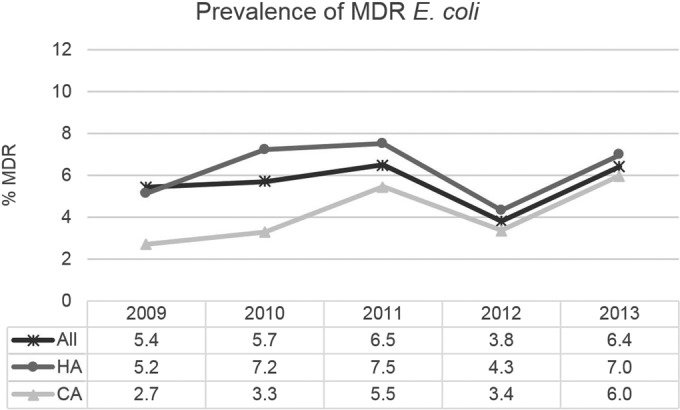
Antimicrobial resistance in Enterobacteriaceae, including resistance to carbapenems, is increasing worldwide. However, using U.S. Study for Monitoring Antimicrobial Resistance Trends (SMART) data for 2009 to 2013, no statistically significant decreasing susceptibility trends were found overall for Escherichia coli isolates from patients with intra-abdominal infections. In the subset of isolates from community-associated infections, susceptibility to levofloxacin decreased significantly and the increasing rate of multidrug-resistant E. coli approached statistical significance. In 2013, ertapenem, imipenem, and amikacin showed the highest susceptibility rates (≥99%) and fluoroquinolones the lowest (<70%). The 10 non-ertapenem-susceptible isolates (0.3% of all E. coli isolates) encoded one or more carbapenemases, extended-spectrum β-lactamases (ESBLs), AmpC β-lactamases, or non-ESBL β-lactamases.


Figures

FIG 1
FIG 1
Frequency distribution of ertapenem MICs (in micrograms per milliliter) for E. coli isolates from IAIs in the United States in 2009 to 2013. No statistically significant trends in MICs were noted in the main or sensitivity analyses (P > 0.05). E. coli sample sizes were as follows: 2009, 551 isolates; 2010, 613 isolates; 2011, 554 isolates; 2012, 603 isolates; 2013, 576 isolates.
FIG 2
FIG 2
Trends in the prevalence of genotypically ESBL-positive isolates of E. coli from IAIs in the United States in 2009 to 2013. No statistically significant trends were noted in main (all 29 sites) or sensitivity (12 continuously participating sites) analyses (all P > 0.05). HA, hospital-associated; CA, community-associated. E. coli sample sizes (denominators) were as follows: all (including isolates from HA and CA IAIs, as well as isolates for which the time of collection postadmission was not reported), 2009, 551 isolates; 2010, 613 isolates; 2011, 554 isolates; 2012, 603 isolates; 2013, 576 isolates; HA, 2009, 291 isolates; 2010, 249 isolates; 2011, 213 isolates; 2012, 277 isolates; 2013, 258 isolates; CA, 2009, 184 isolates; 2010, 334 isolates; 2011, 311 isolates; 2012, 326 isolates; 2013, 318 isolates.
FIG 3
FIG 3
Trends in the prevalence of multidrug-resistant isolates of E. coli from IAIs in the United States in 2009 to 2013. No statistically significant trends were noted in main (all 29 sites) or sensitivity (12 continuously participating sites) analyses (all P > 0.05). MDR, multidrug-resistant; HA, hospital-associated; CA, community-associated. E. coli sample sizes (denominators) were as follows: all (including isolates from HA and CA IAIs, as well as isolates for which the time of collection postadmission was not reported), 2009, 551 isolates; 2010, 613 isolates; 2011, 554 isolates; 2012, 603 isolates; 2013, 576 isolates; HA, 2009, 291 isolates; 2010, 249 isolates; 2011, 213 isolates; 2012, 277 isolates; 2013, 258 isolates; CA, 2009, 184 isolates; 2010, 334 isolates; 2011, 311 isolates; 2012, 326 isolates; 2013, 318 isolates.

References

    1. Vardakas KZ, Tansarli GS, Petros I, Rafailidis PI, Falagas ME. 2012. Carbapenems versus alternative antibiotics for the treatment of bacteraemia due to Enterobacteriaceae producing extended-spectrum β-lactamases: a systematic review and meta-analysis. J Antimicrob Chemother 67:2793–2803. doi:10.1093/jac/dks301. - DOI - PubMed
    1. Solomkin JS, Mazuski JE, Bradley JS, Rodvold KA, Goldstein EJC, Baron EJ, O'Neill PJ, Chow AW, Patchen Dellinger E, Eachempai SR, Gorbach S, Hilfiker M, May AK, Nathens AB, Sawyer RG, Bartlett JG. 2010. Diagnosis and management of complicated intra-abdominal infection in adults and children: guidelines by the Surgical Infection Society and the Infectious Diseases Society of America. Surg Infect 11:79–109. doi:10.1089/sur.2009.9930. - DOI - PubMed
    1. Malloy AM, Campos JM. 2011. Extended-spectrum beta-lactamases: a brief clinical update. Pediatr Infect Dis J 30:1092–1093. doi:10.1097/INF.0b013e31823c0e9d. - DOI - PubMed
    1. Nordmann P, Naas T, Poirel L. 2011. Global spread of carbapenemase-producing Enterobacteriaceae. Emerg Infect Dis 17:1791–1798. doi:10.3201/eid1710.110655. - DOI - PMC - PubMed
    1. Guh AY, Limbago BM, Kallen AJ. 2014. Epidemiology and prevention of carbapenem-resistant Enterobacteriaceae in the United States. Expert Rev Anti Infect Ther 12:565–580. doi:10.1586/14787210.2014.902306. - DOI - PMC - PubMed

Publication types