. 2015;59(6):3306-16.
doi: 10.1128/AAC.00238-15. Epub 2015 Mar 23.

Brincidofovir (CMX001) inhibits BK polyomavirus replication in primary human urothelial cells

Affiliations

Brincidofovir (CMX001) inhibits BK polyomavirus replication in primary human urothelial cells

Garth D Tylden et al. Antimicrob Agents Chemother. 2015.

Abstract

BK polyomavirus (BKPyV)-associated hemorrhagic cystitis (PyVHC) complicates 5 to 15% of allogeneic hematopoietic stem cell transplantations. Targeted antivirals are still unavailable. Brincidofovir (BCV; previously CMX001) has shown inhibitory activity against diverse viruses, including BKPyV in a primary human renal tubule cell culture model of polyomavirus-associated nephropathy. We investigated the effects of BCV in BKPyV-infected and uninfected primary human urothelial cells (HUCs), the target cells of BKPyV in PyVHC. The BCV concentrations causing 50 and 90% reductions (EC50 and EC90) in the number of intracellular BKPyV genome equivalents per cell (icBKPyV) were 0.27 μM and 0.59 μM, respectively. At 0.63 μM, BCV reduced viral late gene expression by 90% and halted progeny release. Preinfection treatment for only 24 h reduced icBKPyV similarly to treatment from 2 to 72 h postinfection, while combined pre- and postinfection treatment suppressed icBKPyV completely. After investigating BCV's effects on HUC viability, mean selectivity indices at 50 and 90% inhibition (SI50 and SI90) calculated for cellular DNA replication were 2.7 and 2.9, respectively, those for mitochondrial activity were 8.9 and 10.4, those for total ATP were 8.6 and 8.2, and those for membrane integrity were 25.9 and 16.7. The antiviral and cytostatic effects, but less so the cytotoxic effects, were inversely related to cell density. The cytotoxic effects at concentrations of ≥10 μM were rapid and likely related to BCV's lipid moiety. After carefully defining the antiviral, cytostatic, and cytotoxic properties of BCV in HUCs, we conclude that a preemptive or prophylactic approach in PyVHC is likely to give the best results.


Figures

FIG 1
FIG 1
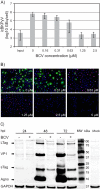
Effect of brincidofovir (BCV) on BKPyV replication in HUCs. (A) Effect of BCV on BKPyV DNA replication. Cells were seeded at 20,000 cells/cm2 and infected 24 h later with purified BKPyV at 2 FFU/cell. Infected cells, treated with the indicated concentrations of BCV, were harvested 72 hpi (70 hpt), and icBKPyV (number of genome equivalents [Geq]/cell) was measured by qPCR. The mean icBKPyV values from three independent experiments conducted and analyzed in triplicate (27 quantification reactions per mean) are presented. Error bars indicate the standard deviations of means between experiments. (B) Effect of BCV on BKPyV expression of early and late proteins at 72 hpi. Immunofluorescence micrographs of BKPyV-infected HUCs treated with the indicated BCV concentrations are shown. The cells were fixed and subsequently stained using polyclonal rabbit antiagnoprotein serum (green) for visualization of agnoprotein and the SV40 LTag monoclonal Pab416 for the visualization of early LTag (red). Cell nuclei (blue) were stained with DRAQ5. Pictures were taken with a fluorescence microscope (10× objective). (C) Effect of BCV on temporal expression of BKPyV early and late proteins. Western blot of lysates of BKPyV infected HUCs treated with 0.63 μM BCV (+) and buffer only (−). Treatment was initiated 2 h after infection, and cells were lysed at the indicated times postinfection. Electrophoresis was performed with 5.2 μg total protein per well. The membrane was stained with polyclonal rabbit anti-LTag serum, anti-agnoprotein, and anti-VP1 serum and with a mouse monoclonal antibody directed against the housekeeping protein glyceraldehyde-3-phosphate dehydrogenase (GAPDH). Lane MW, molecular weight markers.
FIG 2
FIG 2
Calculation of the 50% and 90% effective concentrations (EC50 and EC90) of BCV. (A) Effect of cell density on the EC90. Cells were seeded at 10,000, 20,000, and 40,000 cells/cm2 and infected 24 h later with purified BKPyV at 2 FFU/cell. Infected cells, treated with various concentrations of BCV 2 hpi, were harvested 72 hpi (70 hpt), and the icBKPyV was measured by qPCR. Each dilution was tested between 2 and 12 times in independent experiments with 2 or 3 replicates, each of which was amplified in triplicate, giving between 12 and 63 individual quantification results per point in the plot. The mean percent inhibition of the icBKPyV is plotted against the BCV concentration. The value for medium containing only buffer was set as 0% inhibition, and that for the input viral load was set as 100% inhibition. Dotted vertical lines indicate the EC90 values resulting from the different cell densities. The error bars shown represent standard deviations of the mean percent inhibition between experiments carried out with 20,000 cell/cm2 are shown. Error bars for other cell densities were excluded for clarity. (B) Combined titration results at all three cell densities presented in panel A. As described above, the mean percent inhibition of the icBKPyV is plotted against the BCV concentration. The value for medium containing only buffer was set as 0% inhibition, and that for the input viral load was set as 100% inhibition. Error bars indicate the standard deviations of means between experiments. The EC50 and EC90 are indicated by dotted lines.
FIG 3
FIG 3
Effect of BCV on release of infectious progeny. Supernatants harvested at 72 hpi from HUCs seeded at 40,000 and 10,000 cells/cm2 and infected with 2 FFU/cell were diluted 1:10 and inoculated into fresh cultures of HUCs, seeded at 20,000 cells/cm2. The cells were fixed at 72 hpi and stained using polyclonal rabbit anti-agnoprotein serum (green) for visualization of agnoprotein and the SV40 LTag monoclonal Pab416 for LTag (red). Cell nuclei (blue) were stained with DRAQ5. Pictures were taken with a fluorescence microscope (10× objective).
FIG 4
FIG 4
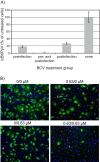
Effect of pre- and postinfection treatment with BCV. HUCs were seeded at 20,000 cells/cm2, incubated for 24 h, and then treated with 0.63 μM BCV or buffer only for 24 h prior to infection with purified BKPyV at 2 FFU/cell for 2 h. Following infection, the cells were washed with medium and then replenished with medium containing 0.63 μM BCV or buffer only. Cells were harvested for extraction of DNA (A) or fixed at 72 hpi (B). (A) The icBKPyV is plotted as a percentage of that in wells treated with buffer only (100%). Bars represent means from 3 individual experiments conducted and quantified in triplicate, giving 27 quantification reactions per mean. Error bars represent standard deviations. (B) Immunofluorescence micrographs of HUCs fixed at 72 hpi and stained using polyclonal rabbit anti-agnoprotein serum (green) for visualization of agnoprotein and the SV40 LTag monoclonal Pab416 for the visualization of early LTag (red). Cell nuclei (blue) were stained with DRAQ5. Pictures were taken with a fluorescence microscope (10× objective).
FIG 5
FIG 5
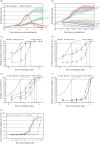
Cytostatic and cytotoxic effects of BCV. (A and B) Concentration-dependent temporal effects of BCV on the cell index (a measure of electrical impedance) in infected and mock-infected HUCs. HUCs were seeded and incubated for 24 h prior to either infection with purified BKPyV at 5 FFU/cell or mock infection and simultaneous treatment with BCV or buffer only. Electrical impedance in cell culture monolayers was measured using the xCELLigence system from seeding, 24 h before infection, until 96 to 120 hpi/hpt. Cell index was normalized at the point of infection/treatment. Experiments were repeated 7 times in triplicate, and results of a representative experiment are presented. (A) Comparison of cell index for infected and mock-infected, BCV- and buffer-only-treated HUCs seeded at 60,000 cells/cm2. (B) Temporal effects of increasing concentrations of BCV on the cell index of mock-infected HUCs seeded at 30,000 cells/cm2. (C, D, E, and F) Concentration-dependent effects of BCV on viability of HUCs in endpoint assays. Inhibition of cellular DNA replication (BrdU incorporation assay) (C) and inhibition of mitochondrial activity (resazurin reduction assay) (D) both at 20,000 (red) and 40,000 (gray) cells/cm2, as well as inhibition of total ATP levels (CellTiter-Glo luminescent cell viability assay) (E) and loss of membrane integrity (CellTox Green cytotoxicity assay) (F) both at 10,000 (green), 20,000 (red), and 40,000 (gray) cells/cm2, are shown. The curve for inhibition of icBKPyV (blue) is included for reference. Dotted lines indicate EC90 and CC90. All viability measurements were performed at 72 hpt in uninfected HUCs. Mean values from 3 experiments carried out with 6 parallels are presented. Error bars represent standard deviations between experiments. (G) Daily measurement of the loss of membrane integrity in uninfected HUCs with increasing concentrations of BCV. Cells were seeded at 20,000 cells/cm2 and incubated for 24 h before addition of CellTox Green cyanine dye and treatment with the indicated concentrations of BCV, buffer only, or lysis buffer. Fluorescence, indicating nuclear penetration and binding to the DNA by the cyanine dye, was recorded at 0.5, 24, 48, and 72 hpt. Mean values from 3 experiments carried out with 6 parallels are presented. Error bars represent standard deviations between experiments.
FIG 6
FIG 6
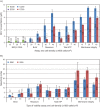
Graphic representation of the selectivity profile of BCV for inhibition of BKPyV in HUCs. (A) EC90, EC50, CC90, and CC50 of BCV. (B) SI50 and SI90. The icBKPyV and endpoint viability were measured at 72 hpi/hpt. EC90 and CC90 values and their 95% confidence intervals were calculated using the curve-fitting software XLfit with a 4-parameter logistic model (model 208). Selectivity indices were calculated by dividing CC by EC. Confidence intervals for selectivity indices were calculated as follows: lower limit = (CCx – 95% CI)/(ECx + 95% CI); upper limit = (CCx + 95% CI)/(ECx – 95% CI).

Similar articles

Cited by

References

    1. Rinaldo CH, Tylden GD, Sharma BN. 2013. The human polyomavirus BK (BKPyV): virological background and clinical implications. APMIS 121:728–745. doi:10.1111/apm.12134. - DOI - PubMed
    1. Hirsch HH, Randhawa P. 2013. BK polyomavirus in solid organ transplantation. Am J Transplant 13(Suppl 4):179–188. doi:10.1111/ajt.12110. - DOI - PubMed
    1. Rorije NM, Shea MM, Satyanarayana G, Hammond SP, Ho VT, Baden LR, Antin JH, Soiffer RJ, Marty FM. 2014. BK virus disease after allogeneic stem cell transplantation: a cohort analysis. Biol Blood Marrow Transplant 20:564–570. doi:10.1016/j.bbmt.2014.01.014. - DOI - PubMed
    1. Dropulic LK, Jones RJ. 2008. Polyomavirus BK infection in blood and marrow transplant recipients. Bone Marrow Transplant 41:11–18. doi:10.1038/sj.bmt.1705886. - DOI - PMC - PubMed
    1. Hirsch H. 2010. Polyoma and papilloma virus infections after hematopoietic stem cell or solid organ transplantation, p 465–482. In Bowden R, Ljungman P, Snydman DR (ed), Transplant infections, 3rd ed Lippincott Williams & Wilkins, Philadelphia, PA.

Publication types

LinkOut - more resources