

Variability and stability in the McGurk effect: contributions of participants, stimuli, time, and response type
- PMID: 25802068
- PMCID: PMC4580505
- DOI: 10.3758/s13423-015-0817-4
Variability and stability in the McGurk effect: contributions of participants, stimuli, time, and response type
Abstract
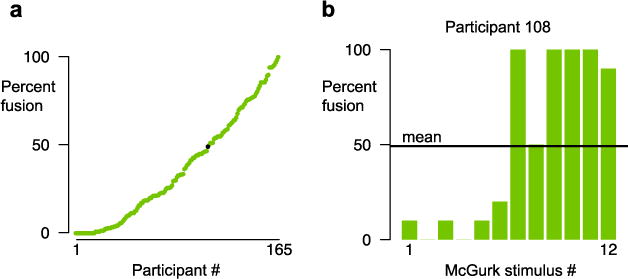
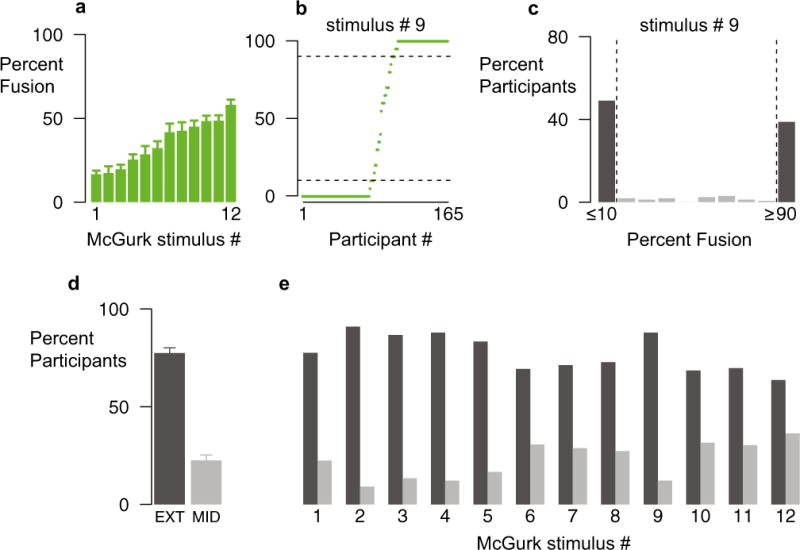
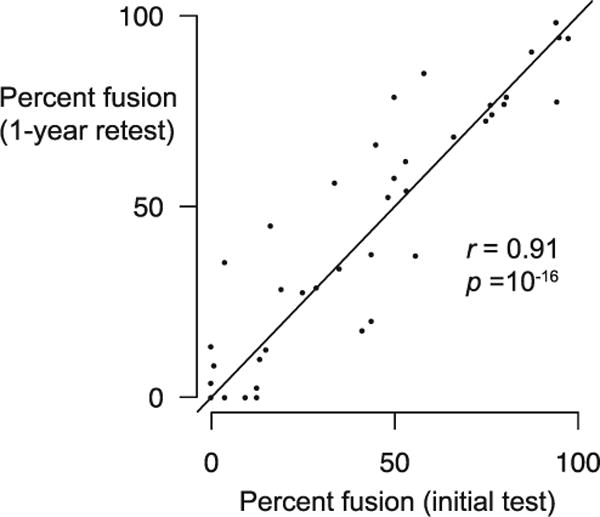
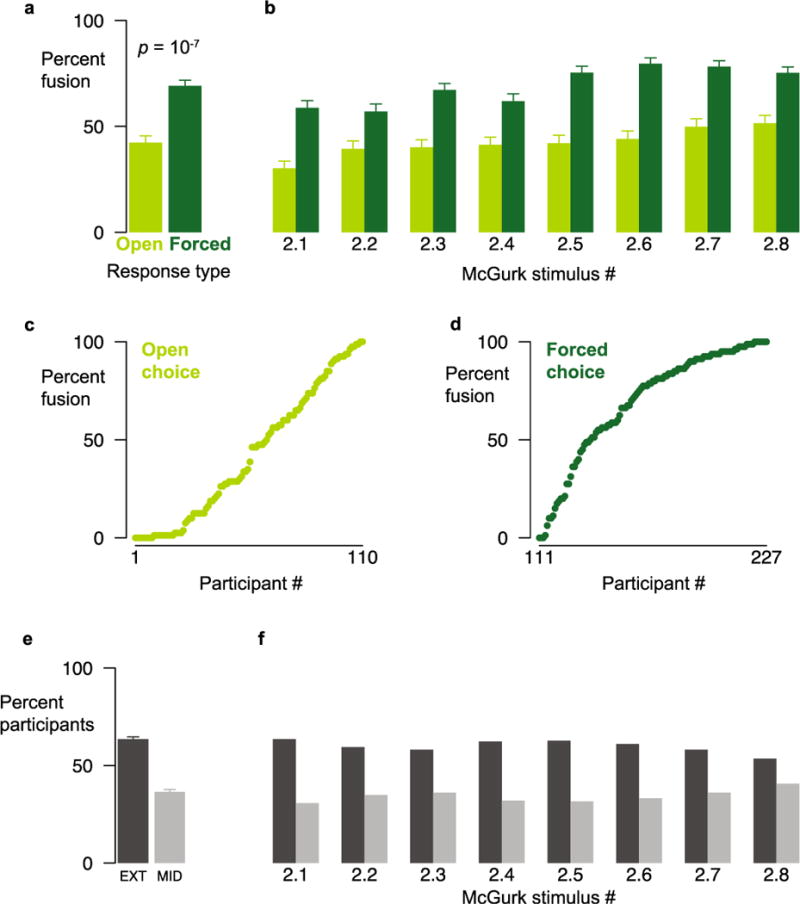
In the McGurk effect, pairing incongruent auditory and visual syllables produces a percept different from the component syllables. Although it is a popular assay of audiovisual speech integration, little is known about the distribution of responses to the McGurk effect in the population. In our first experiment, we measured McGurk perception using 12 different McGurk stimuli in a sample of 165 English-speaking adults, 40 of whom were retested following a one-year interval. We observed dramatic differences both in how frequently different individuals perceived the illusion (from 0 % to 100 %) and in how frequently the illusion was perceived across different stimuli (17 % to 58 %). For individual stimuli, the distributions of response frequencies deviated strongly from normality, with 77 % of participants almost never or almost always perceiving the effect (≤10 % or ≥90 %). This deviation suggests that the mean response frequency, the most commonly reported measure of the McGurk effect, is a poor measure of individual participants' responses, and that the assumptions made by parametric statistical tests are invalid. Despite the substantial variability across individuals and stimuli, there was little change in the frequency of the effect between initial testing and a one-year retest (mean change in frequency = 2 %; test-retest correlation, r = 0.91). In a second experiment, we replicated our findings of high variability using eight new McGurk stimuli and tested the effects of open-choice versus forced-choice responding. Forced-choice responding resulted in an estimated 18 % greater frequency of the McGurk effect but similar levels of interindividual variability. Our results highlight the importance of examining individual differences in McGurk perception instead of relying on summary statistics averaged across a population. However, individual variability in the McGurk effect does not preclude its use as a stable measure of audiovisual integration.
Keywords: Audiovisual integration; Individual differences; McGurk effect; Speech perception.
Conflict of interest statement
The authors report no conflicts of interest.
Figures
References
-
- Berger CC, Ehrsson HH. Mental imagery changes multisensory perception. Current Biology. 2013;23:1367–1372. - PubMed
-
- Binnie CA, Montgomery AA, Jackson PL. Auditory and visual contributions to the perception of consonants. Journal of speech, language, and hearing research. 1974;17:619–630. - PubMed
-
- Colin C, Radeau M, Deltenre P. Top-down and bottom-up modulation of audiovisual integration in speech. European Journal of Cognitive Psychology. 2005;17(4):541–560.
Publication types
MeSH terms
Grants and funding
LinkOut - more resources
Full Text Sources
Other Literature Sources
