. 2015 Apr;32(4):353-68.
doi: 10.1007/s10585-015-9714-5. Epub 2015 Mar 24.

Marrow adipocyte-derived CXCL1 and CXCL2 contribute to osteolysis in metastatic prostate cancer

Affiliations

Marrow adipocyte-derived CXCL1 and CXCL2 contribute to osteolysis in metastatic prostate cancer

Aimalie L Hardaway et al. Clin Exp Metastasis. 2015 Apr.

Abstract

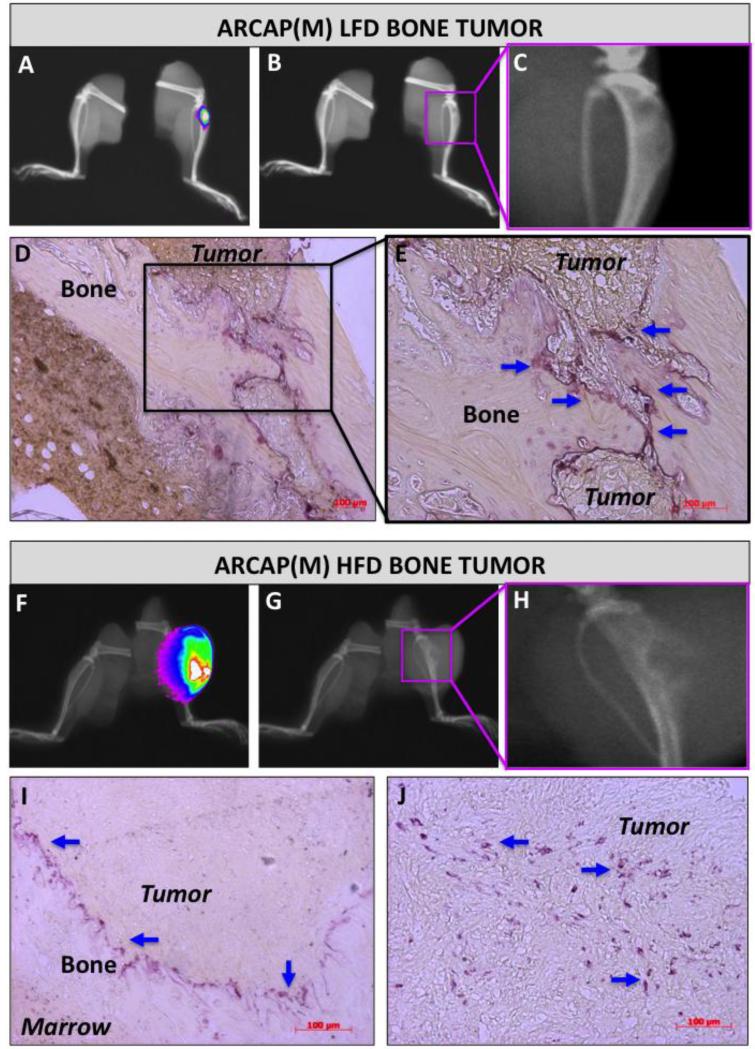
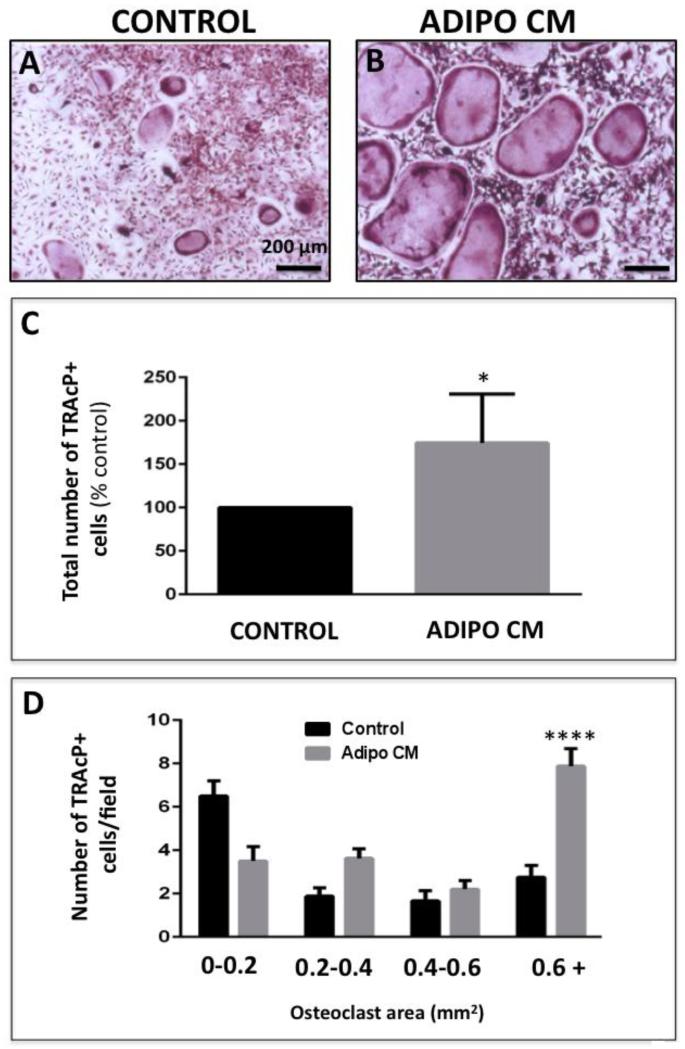
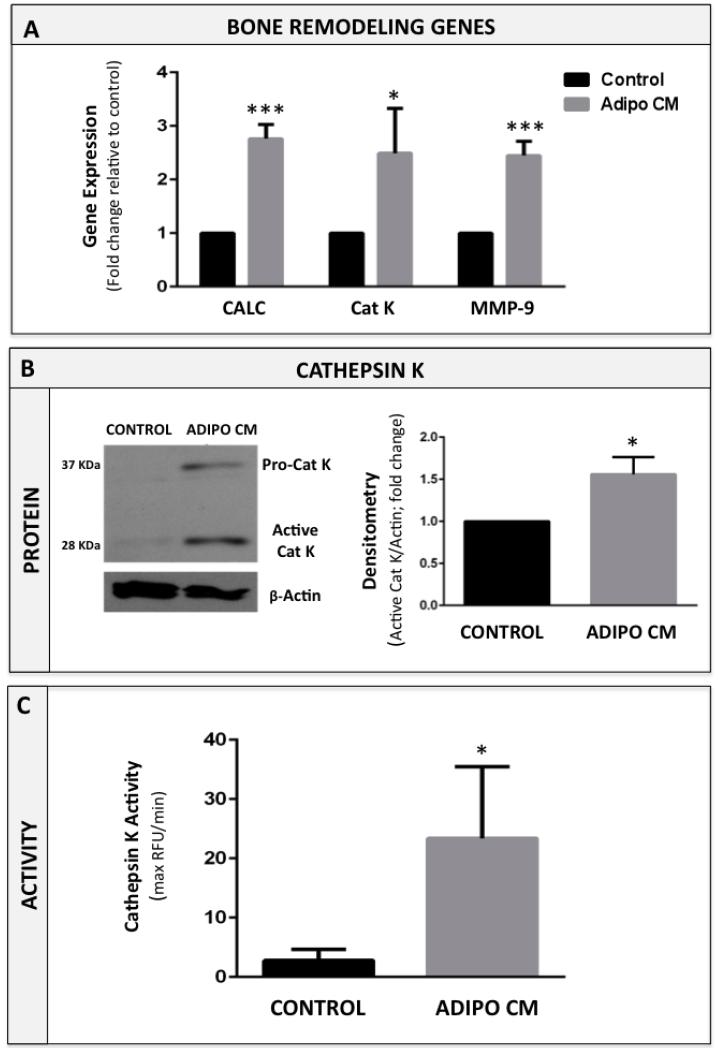
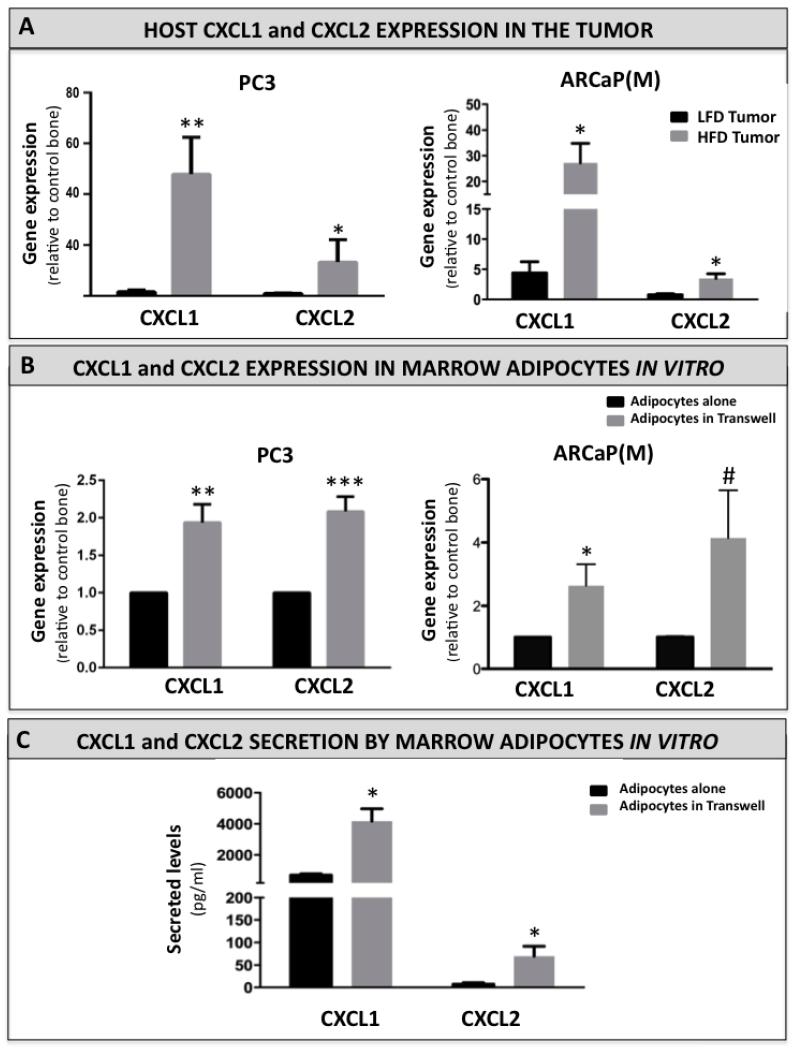
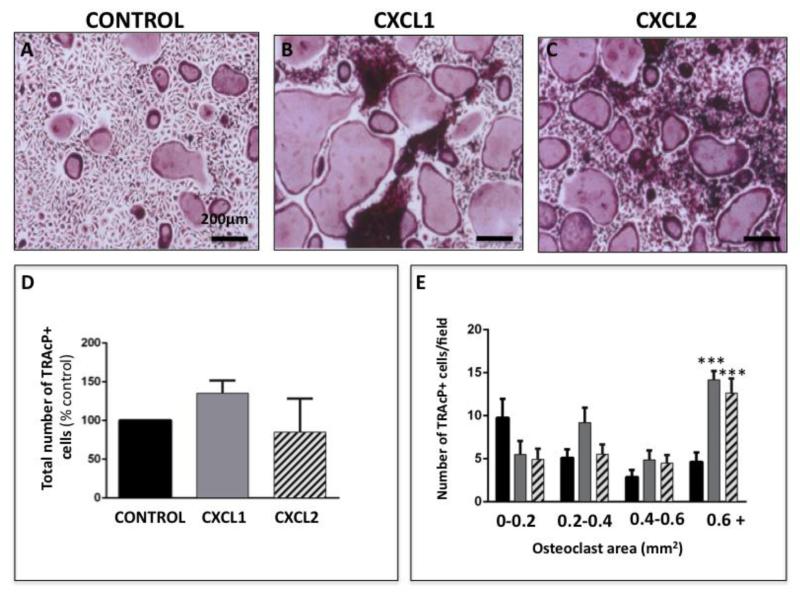
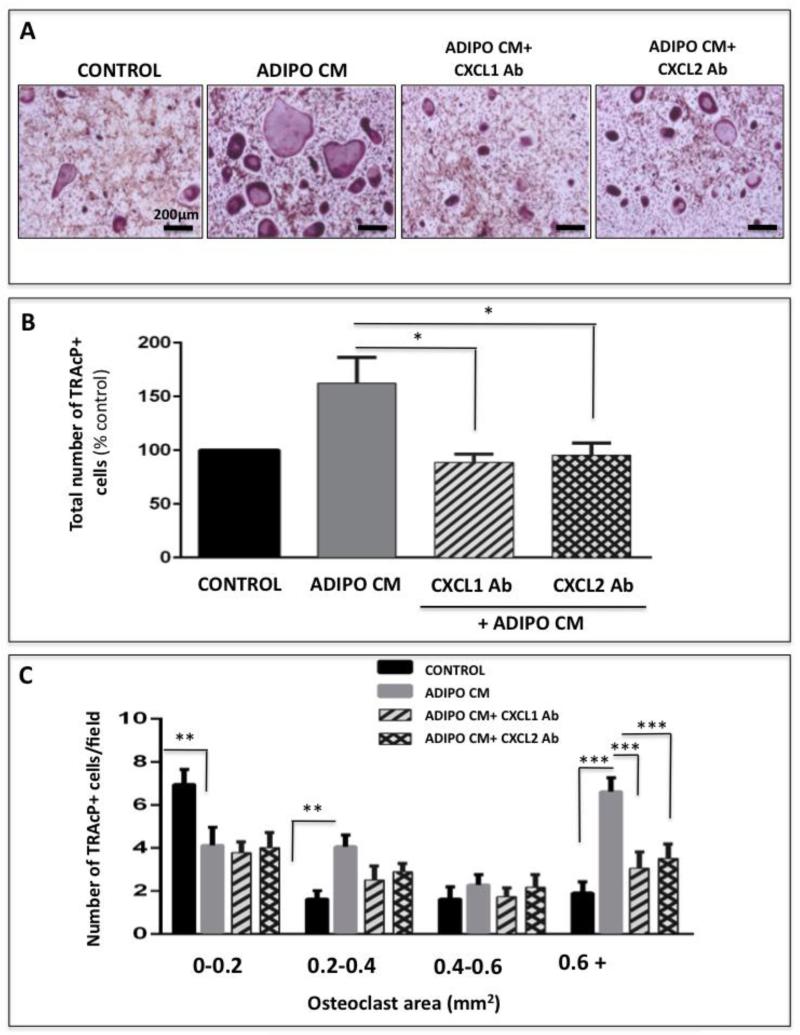
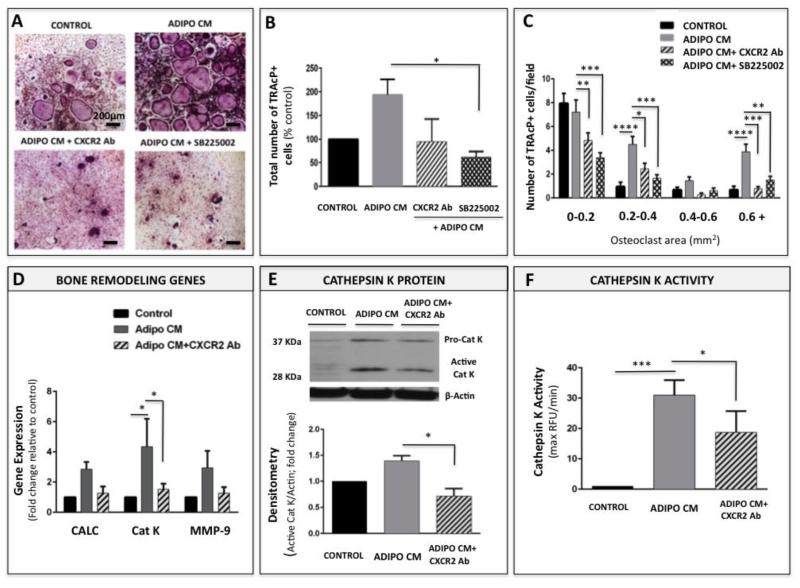
Increased bone marrow adiposity is a common feature of advanced age, obesity and associated metabolic pathologies. Augmented numbers of marrow adipocytes positively correlate with dysregulated bone remodeling, also a well-established complication of metastatic disease. We have shown previously that marrow adiposity accelerates prostate tumor progression in the skeleton and promotes extensive destruction of the bone; however, the factors behind adipocyte-driven osteolysis in the skeletal tumor microenvironment are not currently known. In this study, utilizing in vivo diet-induced models of bone marrow adiposity, we reveal evidence for positive correlation between increased marrow fat content, bone degradation by ARCaP(M) and PC3 prostate tumors, and augmented levels of host-derived CXCL1 and CXCL2, ligands of CXCR2 receptor. We show by in vitro osteoclastogenesis assays that media conditioned by bone marrow adipocytes is a significant source of CXCL1 and CXCL2 proteins. We also demonstrate that both the adipocyte-conditioned media and the recombinant CXCL1 and CXCL2 ligands efficiently accelerate osteoclast maturation, a process that can be blocked by neutralizing antibodies to each of the chemokines. We further confirm the contribution of CXCR2 signaling axis to adiposity-driven osteoclastogenesis by blocking fat cell-induced osteoclast differentiation with CXCR2 antagonist or neutralizing antibodies. Together, our results link CXCL1 and CXCL2 chemokines with bone marrow adiposity and implicate CXCR2 signaling in promoting effects of marrow fat on progression of skeletal tumors in bone.


Figures

Figure 1
Figure 1. Diet-induced marrow adiposity correlates with increased osteolysis in ARCaP(M) bone tumors
FVBN/N/N5 Rag−/− mice were fed a normal (LFD; A-E) or high fat (HFD; F-J) diets for 8 weeks followed by intratibial injections of ARCaP-DsRed cells into the right tibia. Tumors were imaged at 8 weeks post injection (N=9 mice/LFD group and N=11 mice/HFD group). The overlay of x-ray and 600nm RFP fluorescence (A,F). B,G: x-ray images depicting osteolytic changes in the bone occupied by tumor (pink rectangular area magnified in C and H). TRAcP staining (purple) of osteoclasts (blue arrows) in tibial cross sections of tumor-bearing mice on LFD (D,E) and HFD (I,J). TRAcP data are representative of at least 3 individual sections from 3 separate LFD and HFD tumors.
Figure 2
Figure 2. Bone marrow adipocyte-secreted factors promote osteoclastogenesis in vitro
TRAcP staining of osteoclasts differentiated in the absence (A; Control) or presence of Adipo CM (B). C: Quantification of total number of TRAcP positive cells using ImageJ software shown as percent of control (% control). D: The areas of osteoclasts (in mm2) were measured using ImageJ software and separated based on size from smallest (0-0.2mm2) to largest (0.6mm2+). Graph represents the total number of osteoclasts/field in each size group. Experiments are representative of at least three replicate experiments and shown as mean ± s.e.m; Values indicated by ****(p<0.0001) and * (p<0.05) are considered statistically significant.
Figure 3
Figure 3. Cathepsin K expression and activity are increased in Adipo CM-treated osteoclasts
A: Taqman RT-PCR analysis of bone remodeling genes: calcineurin (CALC), cathepsin K (CAT K), and matrix metalloproteinase-9 (MMP-9) in osteoclasts differentiated in the absence (CONTROL) or presence of Adipo CM (ADIPO CM). Data are normalized to 18S and are graphed as fold increase relative to control. B: Western blot of cathepsin K in osteoclasts (left panel). Levels of pro-cathepsin K (37 kD) and active cathepsin K (28 kD) are increased in osteoclasts treated with Adipo CM. Densitometric analysis of active cathepsin K levels in osteoclasts (right panel) measured as a ratio of 28 kDa band to β-actin (in AU/mm2) and represented as % control. C: Proteolytic activity of cathepsin K in cell lysates from osteoclasts differentiated in the absence and presence of Adipo CM. Assays were run against fluorescent cathepsin K substrate Z-Gyl-Pro-Arg-7-amido-4-methylcoumarin (Z-Gly-Pro-Arg-AMC) in a presence of 1 μM. cathepsin B inhibitor Ca074. Fluorescence was measured in maximum relative fluorescent units per minute (Max RFU per min). Data are representative of three replicate experiments. All values are shown as mean ± s.e.m. (*** p<0.001, *p<0.05 are considered statistically significant).
Figure 4
Figure 4. CXCL1 and CXCL2 expression and secretion are increased in adipocytes interacting with tumor cells in vivo and in vitro
A: Taqman RT-PCR analysis of host CXCL1 and CXCL2 expression in LFD and HFD mice bearing PC3 (left panel) and ARCAP(M) (right panel) tumors. Data are normalized to murine (host) HPRT1 and shown as fold increase relative to control bone. B: Taqman RT-PCR analysis of CXCL1 and CXCL2 expression in bone marrow adipocytes cultured alone (black bar) or in a transwell co-culture (grey bar) with PC3 (left panel) or ARCaP(M) cells (right panel). Data are normalized to HPRT1 and shown as fold increase relative to adipocytes alone. C: ELISA assay results for CXCL1 and CXCL2 secreted by the bone marrow adipocytes grown alone or in a transwell system with PC3 cells. Media samples were diluted based on DNA concentrations in cell lysates. Data are expressed in pg/mL. All data are representative of three replicate experiments. All values are shown as mean ± s.e.m. (*** p<0.001; **p<0.01 and *p<0.05 are considered statistically significant, #p =0.0792).
Figure 5
Figure 5. Recombinant CXCL1 and CXCL2 proteins accelerate osteoclastogenesis
A-C: TRAcP staining of osteoclasts differentiated in the absence (A; control) or presence of recombinant CXCL1 (B) and CXCL2 (C) proteins. D: Quantification of total number of TRAcP positive cells shown as percent of control (% control). E: Total number of osteoclast/field categorized based on size from the smallest (0-0.2mm2) to largest (0.6mm2+). Significantly larger osteoclasts were formed in the presence of CXCL1 and CXCL2. Values are shown as mean ± s.e.m and are representative of three replicate experiments. (*** p<0.005 is considered statistically significant)
Figure 6
Figure 6. Adipocyte-driven osteoclastogenesis is inhibited by neutralizing CXCL1 and CXCL2
A: TRAcP staining of osteoclasts differentiated under control conditions (far left panel), with Adipo CM (left middle panel) or with Adipo CM in the presence of neutralizing antibodies to CXCL1 and CXCL2 (right panels). B: Total number of TRAcP positive cells in each experimental condition shown as % control. C: Total number of osteoclasts/field categorized based on size for each experimental condition. Neutralization of CXCL1 and CXCL2 ligands inhibits Adipo CM-stimulated osteoclastogenesis. Data are representative of at least three replicate experiments. ***p<0.001; **p<0 .01 and *p<0.05 are considered statistically significant).
Figure 7
Figure 7. Blocking the CXCR2 receptor partially inhibits adipocyte-driven osteoclastogenesis
A: TRAcP staining of osteoclasts differentiated under control conditions (Control), with Adipo CM (Adipo CM) or with Adipo CM in the presence of neutralizing antibodies to CXCR2 (bottom left panel) or CXCR2 antagonist SB225002 (bottom right panel). B: The total number of TRAcP positive cells corresponding to each treatment shown as % control; C: Total number of osteoclasts/field categorized based on size for each experimental condition: Control, Adipo CM, Adipo CM + CXCR2 Ab, Adipo CM + SB225002. D: Taqman RT-PCR analysis of bone remodeling genes: calcineurin, cathepsin K, and MMP-9 in osteoclasts differentiated under control conditions, with Adipo CM, or with Adipo CM in the presence of neutralizing antibodies to CXCR2. Data are normalized to 18S and shown as fold increase relative to control. E: Immunoblot of pro- and active cathepsin K in osteoclasts differentiated under control conditions or with Adipo CM in the absence or presence of CXCR2 neutralizing antibody (top panel); Densitometric analysis of active cathepsin K levels in osteoclasts measured as a ratio of 28 kDa band to β-actin (in AU/mm2) and represented as % control (bottom panel). F: Proteolytic activity of cathepsin K in cell lysates from osteoclasts differentiated in the absence and presence of Adipo CM, or with Adipo CM plus CXCR2 neutralizing antibody. Assays were run against fluorescent cathepsin K substrate Z-Gly-Pro-Arg-AMC in the presence of 1 μM cathepsin B inhibitor Ca074. Fluorescence was measured in Max RFU per min. Data are representative of three replicate experiments (****p<0.0001; ***p<0.001; **p<0 .01 and *p <0.05 are considered statistically significant).

Similar articles

Cited by

References

    1. Hardaway AL, Herroon MK, Rajagurubandara E, Podgorski I. Bone marrow fat: linking adipocyte-induced inflammation with skeletal metastases. Cancer Metastasis Rev. 2014;33(2-3):527–43. - PMC - PubMed
    1. Raggatt LJ, Partridge NC. Cellular and molecular mechanisms of bone remodeling. J Biol Chem. 2010;285(33):25103–8. - PMC - PubMed
    1. Lecka-Czernik B, Rosen CJ, Kawai M. Skeletal aging and the adipocyte program: New insights from an “old” molecule. Cell Cycle. 2010;9(18):3648–54. - PMC - PubMed
    1. Rosen CJ, Ackert-Bicknell C, Rodriguez JP, Pino AM. Marrow fat and the bone microenvironment: developmental, functional, and pathological implications. Crit Rev Eukaryot Gene Expr. 2009;19(2):109–24. - PMC - PubMed
    1. Rosen CJ, Bouxsein ML. Mechanisms of disease: is osteoporosis the obesity of bone? Nature clinical practice. 2006;2(1):35–43. - PubMed

Publication types

MeSH terms