. 2015 Aug;168(4):1246-61.
doi: 10.1104/pp.114.252999. Epub 2015 Mar 23.

A Genome-Wide Chronological Study of Gene Expression and Two Histone Modifications, H3K4me3 and H3K9ac, during Developmental Leaf Senescence

Affiliations

A Genome-Wide Chronological Study of Gene Expression and Two Histone Modifications, H3K4me3 and H3K9ac, during Developmental Leaf Senescence

Judy A Brusslan et al. Plant Physiol. 2015 Aug.

Abstract

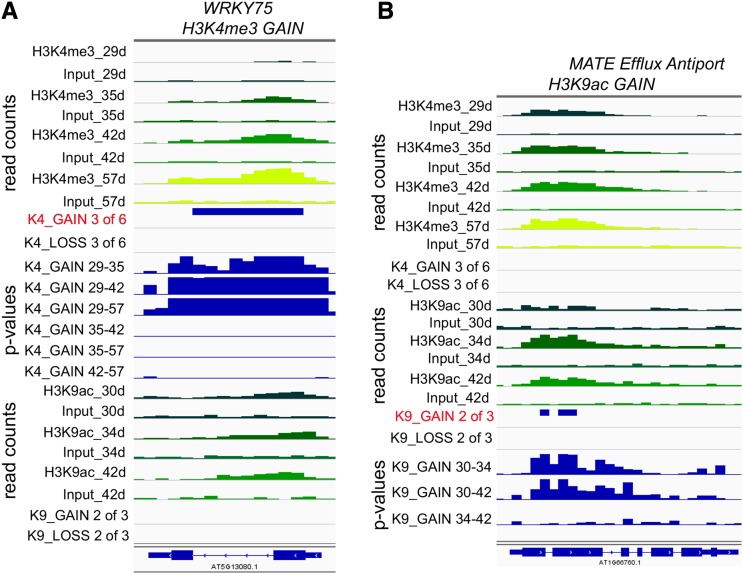
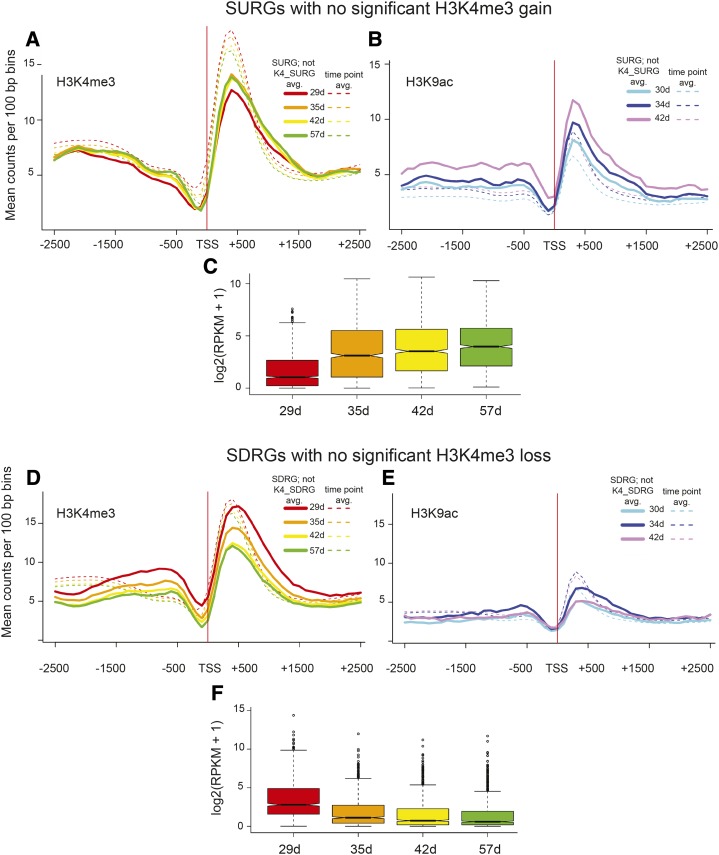
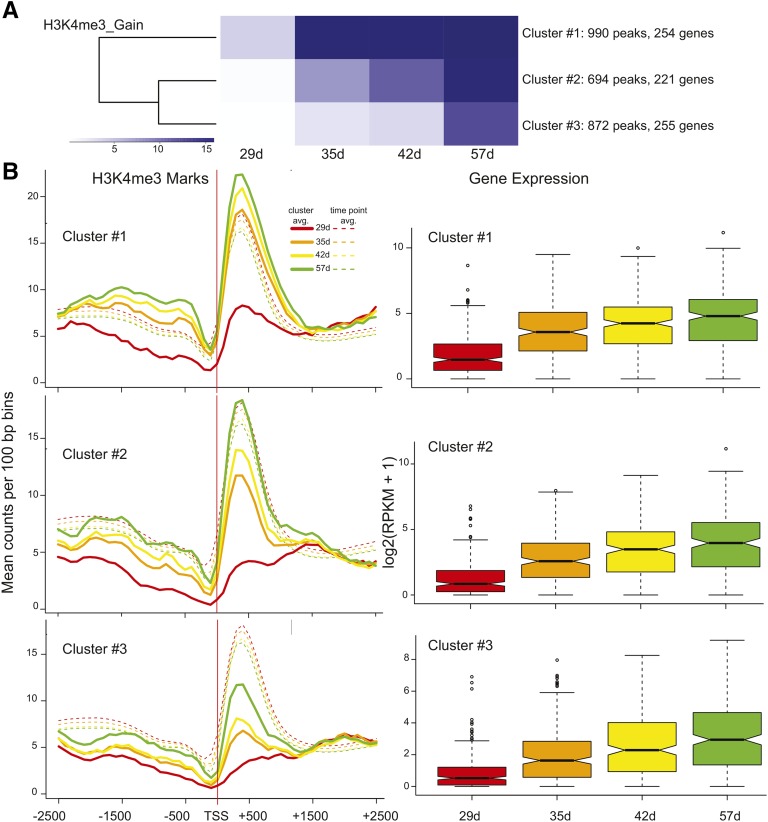
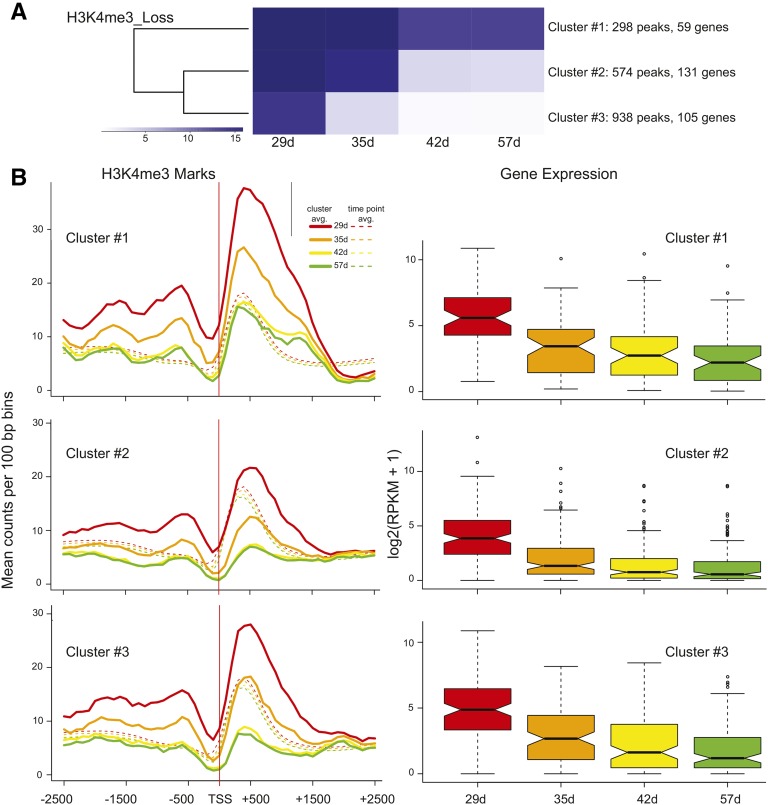
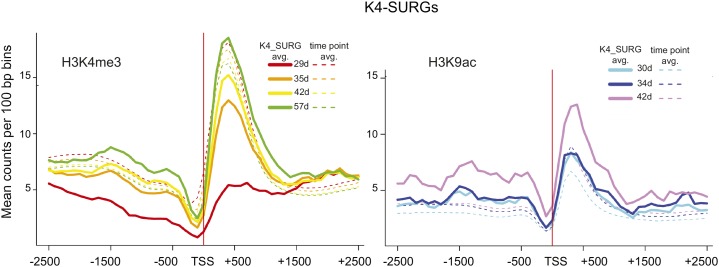
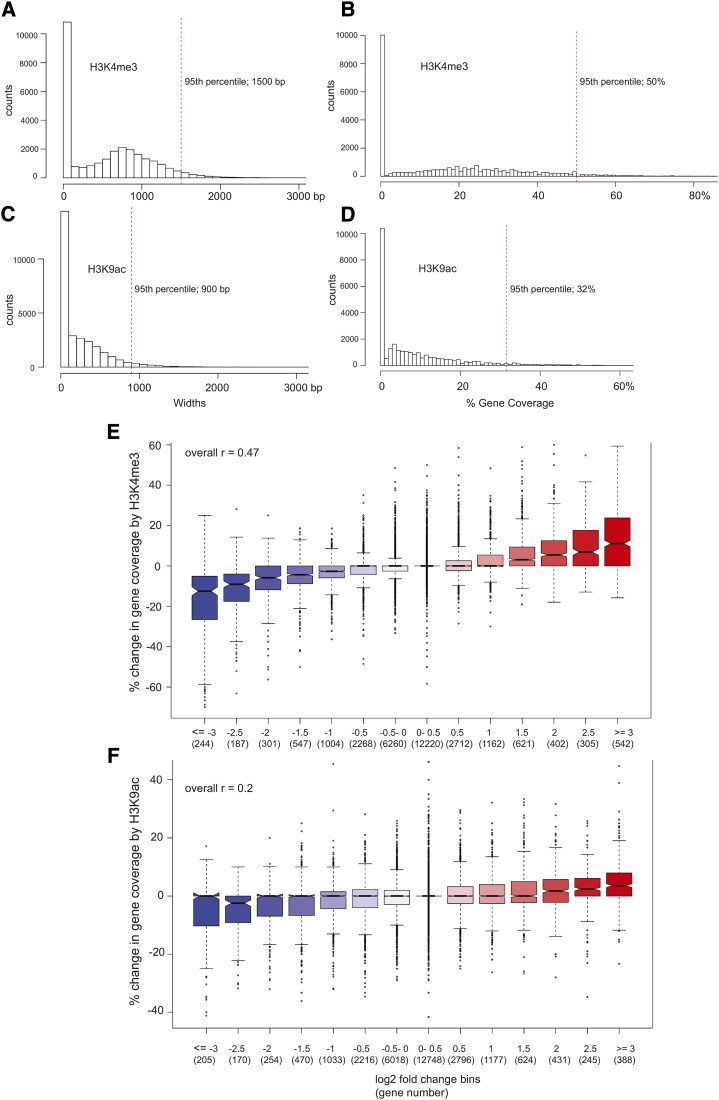
The genome-wide abundance of two histone modifications, H3K4me3 and H3K9ac (both associated with actively expressed genes), was monitored in Arabidopsis (Arabidopsis thaliana) leaves at different time points during developmental senescence along with expression in the form of RNA sequencing data. H3K9ac and H3K4me3 marks were highly convergent at all stages of leaf aging, but H3K4me3 marks covered nearly 2 times the gene area as H3K9ac marks. Genes with the greatest fold change in expression displayed the largest positively correlated percentage change in coverage for both marks. Most senescence up-regulated genes were premarked by H3K4me3 and H3K9ac but at levels below the whole-genome average, and for these genes, gene expression increased without a significant increase in either histone mark. However, for a subset of genes showing increased or decreased expression, the respective gain or loss of H3K4me3 marks was found to closely match the temporal changes in mRNA abundance; 22% of genes that increased expression during senescence showed accompanying changes in H3K4me3 modification, and they include numerous regulatory genes, which may act as primary response genes.


Figures

Figure 1.
Figure 1.
Gene expression differences during leaf senescence. A, Pearson correlation matrix of gene expression data [log2(read counts + 1)] from all RNA-seq libraries. The darker red boxes indicate a higher correlation. Dendrograms were generated by hierarchically clustering samples based on correlation values transformed into distance values (1 − r). B, Genes with significant (≥2-fold, P ≤ 0.05) increases in expression between adjacent ages are shown in the Venn diagram. C, Genes with significant (≥2-fold, P ≤ 0.05) decreases in expression between adjacent ages are shown in the Venn diagram. Box plots for SURGs (D), SDRGs (E), and non-SURG or -SDRG (F) gene expression. RNA-seq RPKM data (log2 scale) for genes are shown. Boxes represent first to third quartiles or interquartile range (IQR). Whiskers extend to the most extreme data points but no more than ±1.5 times the IQR from the box, beyond which outliers are plotted individually. Notches extend to ±1.58 IQR/formula image 
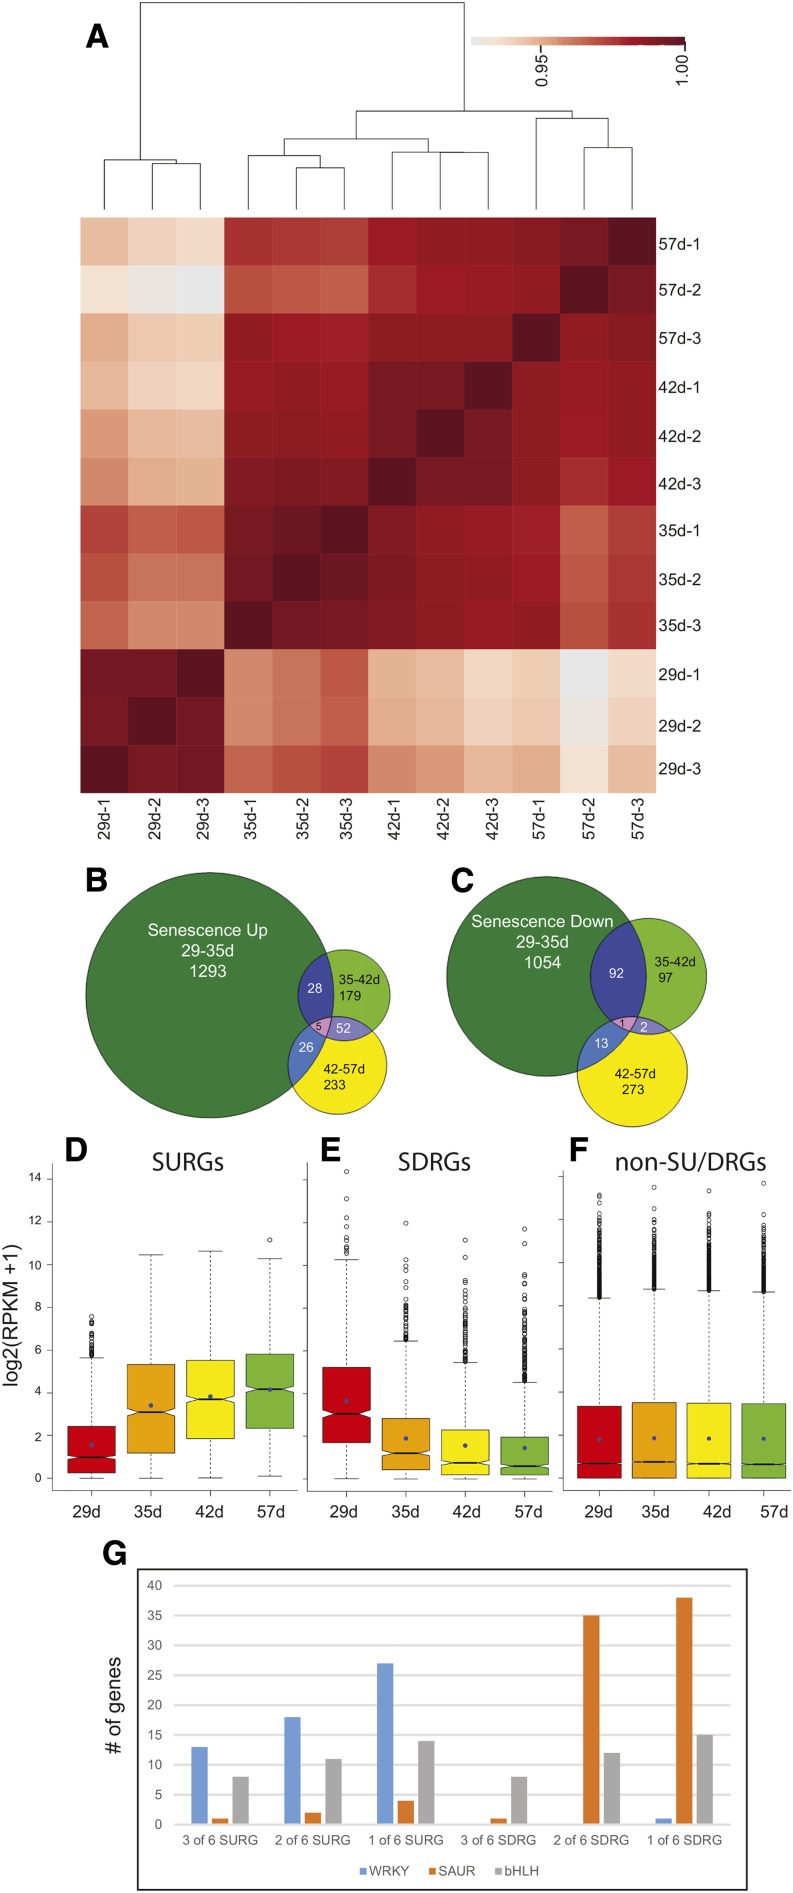
(Chambers et al., 1983). G, The abundance of three gene families for different thresholds used to classify SURGs and SDRGs is shown. bHLH, Basic helix-loop-helix.
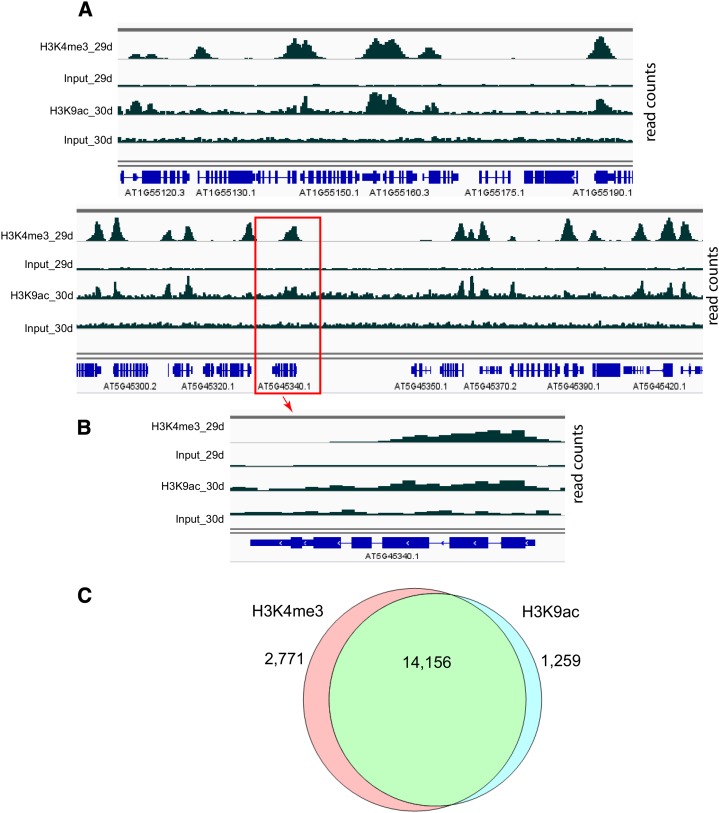
Figure 2.
Figure 2.
Coincidence of H3K4me3 and H3K9ac marks. A, ChIP-seq reads from two gene-rich regions of the Arabidopsis genome (upper, Chromosome 1 and lower, chromosome 5) are displayed using Integrated Genome Viewer. Data from 29 (H3K4me3) and 30 d (H3K9ac) are displayed in pairs of ChIP and input reads. The scale for H3K4me3 ChIP and input is 0 to 120, whereas the scale for H3K9ac ChIP and input is 0 to 60. Gene tracks with exons and introns are shown in blue below the read tracks. B, At5g45340 (the boxed gene in A) is shown in a zoomed-in view. The peaks for both histone modifications are colocalized to the 5′ ends of the gene. At5g45340 is transcribed from right to left and encodes an abscisic acid hydroxylase. C, ChIP reads were compared with input, and peaks were called as described in “Materials and Methods” for each histone modification. The Venn diagram shows the overlap between peaks comprising at least two sequential 100-bp bins exhibiting significant ChIP counts for each histone modification across all time points.
Figure 3.
Figure 3.
Histone modifications in leaves from differently aged plants. A, Integrated Genome Viewer (IGV) tracks for ChIP and input reads for the WRKY75 gene (At5g13080) that show a significant increase in H3K4me3 marks (K4_GAIN 3 of 6 track). The read count tracks show ChIP and input reads for the numbers of days of plant growth for each histone modification as indicated. Data from younger leaves are darker green, whereas data from older leaves are more yellow. The read range is 0 to 120 for H3K4me3 reads and 0 to 60 for H3K9ac reads. The criteria for significance are −log(P ) ≥ 6 in three of six pairwise comparisons, and P values for six pairwise comparisons are shown below (K4_GAIN 29–35 to K4_GAIN 42–57; P scale is 0–10). B, IGV tracks are the same as in A but for one member of the MATE Efflux transporter family (At1g66760), which shows a significant increase in H3K9ac marks. Significant changes in acetylation were identified as those that showed −log(P ) ≥ 6 in two of three comparisons (K9_GAIN 2 of 3 track). K9_GAIN 30 to 34 to K9_GAIN 34 to 42 tracks show −log(P ) for three pairwise comparisons on a 0 to 10 scale.
Figure 4.
Figure 4.
H3K4me3 and H3K9ac histone marks in SURGs and SDRGs that were not identified as K4-SURGs or K4-SDRGs. Histone modification profiles for 1,117 SURGs are shown as lines for H3K4me3 (A) and H3K9ac (B), excluding 315 K4-SURGs that had significant and consistent changes in H3K4me3 marks. The average counts per 100-bp bins for all genes at each time point are shown by dashed lines. C, The gene expression values are shown for this group of 1,117 genes below the histone modification profiles. Histone profiles for 825 SDRGs are shown as lines for H3K4me3 (D) and H3K9ac (E), excluding 139 K4-SDRGs. (F) The gene expression values are shown for this group of 825 genes below the histone modification profiles. The P values for pairwise comparisons of gene expression in C are all significant: 1.33E-62, 29 to 35 d; 2.54E-106, 29 to 42 d; 2.53E-134, 29 to 57 d; 2.92E-04, 35 to 42 d; 2.64E-09, 35 to 57 d; and 0.009, 42 to 57 d. The P values for pairwise comparisons of gene expression in F are:5.49E-57, 29 to 35 d; 3.47E-79, 29 to 42 d; 3.99E-89, 29 to 57 d; 3.81E-07, 35 to 42 d; 2.46E-10, 35 to 57 d; and 0.34, 42 to 57 d. Box plot representations are described in Figure 1E.
Figure 5.
Figure 5.
k-means clustering for H3K4me3 gain peaks and correlation to gene expression. A, Peaks with a significant gain in H3K4me3 marks were subjected to k-means clustering to generate three cluster groups with different temporal trends of acquisition. B, The mean counts per 100-bp bin were calculated for genes associated with peaks in each cluster (lines) as well as all genes at each time point (dashed lines) for clusters 1 to 3. Data are shown for the region comprising −2,500 to +2,500 bp in relation to the TSS. RNA-seq data for genes that coincided with each peak are shown in the box plots for each cluster. Box plot representations are described in Figure 1E.
Figure 6.
Figure 6.
k-means clustering for H3K4me3 loss peaks and correlation to gene expression. A, The same as in Figure 5A but for regions exhibiting a significant loss of H3K4me3. B, H3K4me3 marks and gene expression data are displayed as described in Figure 5B.
Figure 7.
Figure 7.
Average H3K4me3 and H3K9ac read count profiles for 387 K4-SURGs. Histone modification profiles as described in Figure 5B for 315 K4-SURGs. Both histone marks are shown for K4-SURGs. H3K4me3 marks increase consistently throughout leaf aging starting at a low level, whereas H3K9ac marks start at the whole-genome time point average and only increase at 42 d.
Figure 8.
Figure 8.
Breadth of histone modifications and gene expression during leaf senescence. The breadth of H3K4me3 modifications for 42-d samples are shown according to base pairs covered (A) or percentage of gene covered (B). The breadth of H3K9ac modifications for 42-d samples are shown according to base pair covered (C) or percentage of gene covered (D). Red dashed vertical lines delineate the top 95th percentile. E, The percentage change in H3K4me3 gene coverage from 29 to 57 d is plotted for gene expression bins. Genes are placed in bins according to the fold change in gene expression over the same time interval. Gene counts per bin are given in parentheses. For example, the bin labeled 0.5 includes 2,712 genes that display a log2 increase in gene expression greater than 0.5 to less than or equal to 1.0. The box plot representations are as described in Figure 1E. The overall Pearson correlation between percentage change in gene coverage and fold change in gene expression was 0.47 (upper left corner), with a 95% confidence interval of 0.463 to 0.481 (P < 2.2E-16). F, The percentage change in H3K9ac gene coverage from 30 to 42 d is plotted similarly to A, except that the expression time interval is from 29 to 42 d to better correspond to the H3K9ac time interval. The overall Pearson correlation in this case was 0.20, with a 95% confidence interval of 0.185 to 0.207 (P < 2.2E-16).

References

    1. Adrian J, Farrona S, Reimer JJ, Albani MC, Coupland G, Turck F (2010) cis-Regulatory elements and chromatin state coordinately control temporal and spatial expression of FLOWERING LOCUS T in Arabidopsis. Plant Cell 22: 1425–1440 - PMC - PubMed
    1. Alvarez-Venegas R, Abdallat AA, Guo M, Alfano JR, Avramova Z (2007) Epigenetic control of a transcription factor at the cross section of two antagonistic pathways. Epigenetics 2: 106–113 - PubMed
    1. Anders S, Pyl PT, Huber W (2015) HTSeq: a Python framework to work with high-throughput sequencing data. Bioinformatics 31: 166–169 - PMC - PubMed
    1. Anzola JM, Sieberer T, Ortbauer M, Butt H, Korbei B, Weinhofer I, Müllner AE, Luschnig C (2010) Putative Arabidopsis transcriptional adaptor protein (PROPORZ1) is required to modulate histone acetylation in response to auxin. Proc Natl Acad Sci USA 107: 10308–10313 - PMC - PubMed
    1. Ay N, Irmler K, Fischer A, Uhlemann R, Reuter G, Humbeck K (2009) Epigenetic programming via histone methylation at WRKY53 controls leaf senescence in Arabidopsis thaliana. Plant J 58: 333–346 - PubMed

Publication types

MeSH terms