

A Quantitative Measure of Field Illumination
- PMID: 25802488
- PMCID: PMC4365985
- DOI: 10.7171/jbt.15-2602-001
A Quantitative Measure of Field Illumination
Abstract
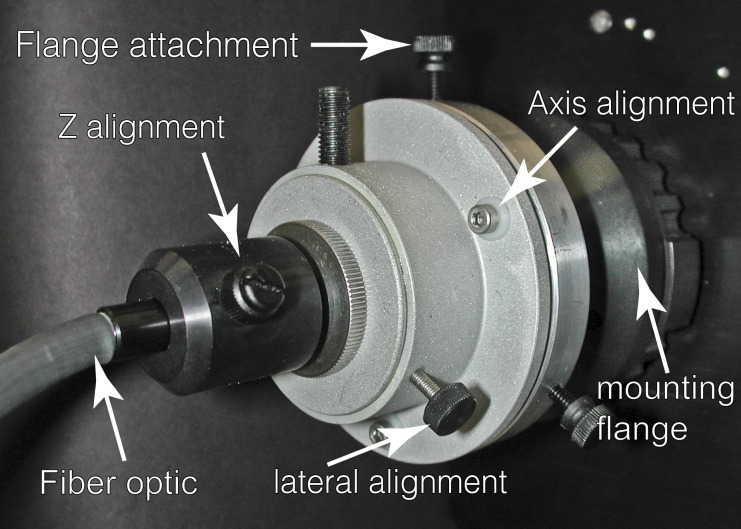
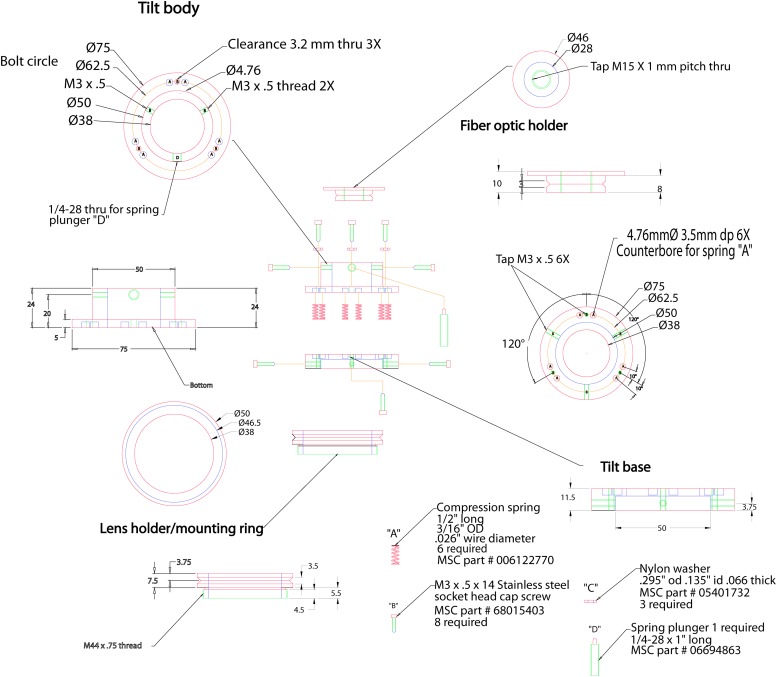
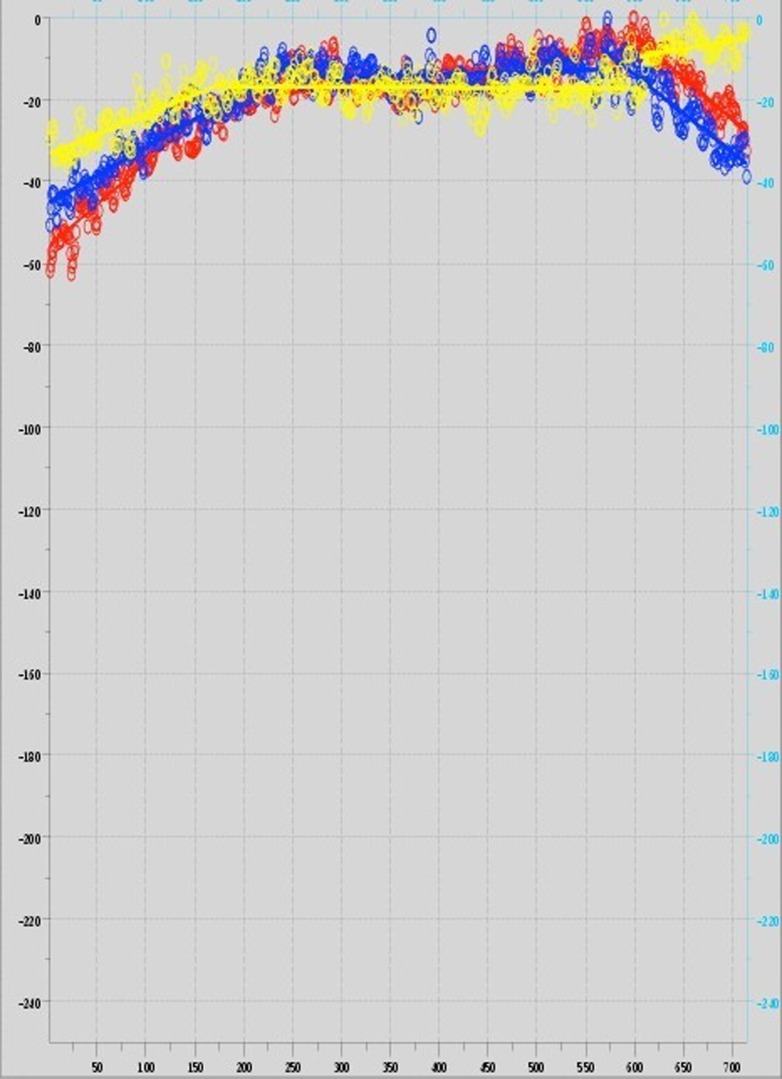
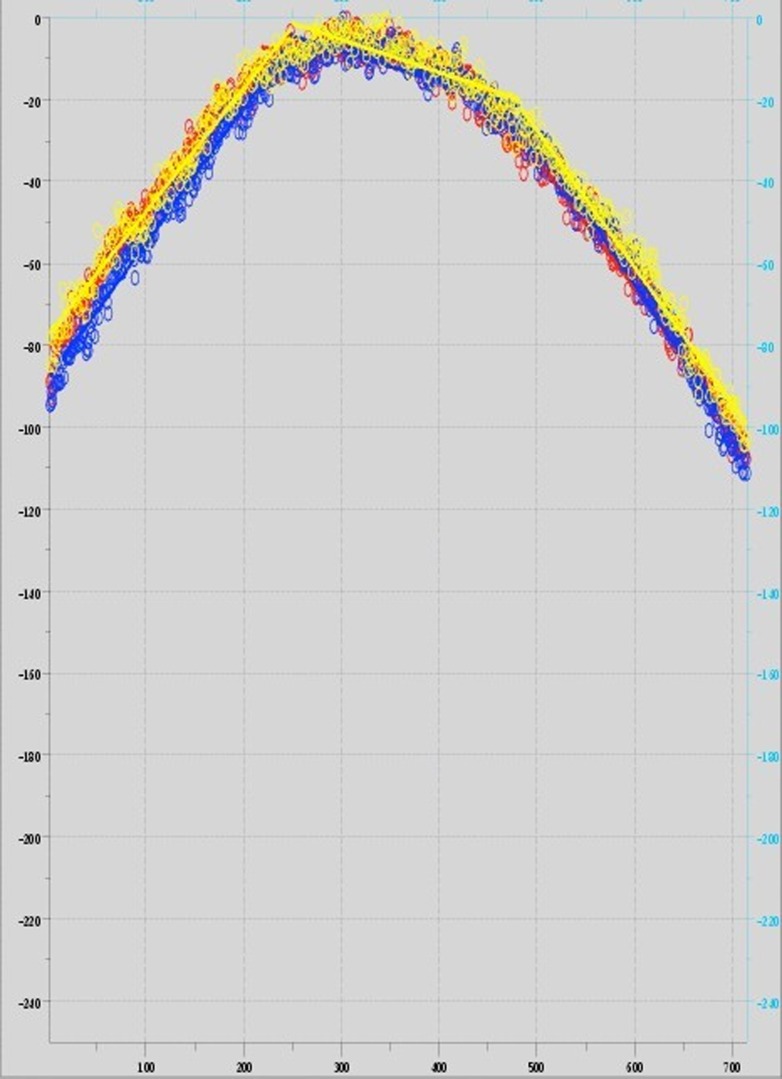
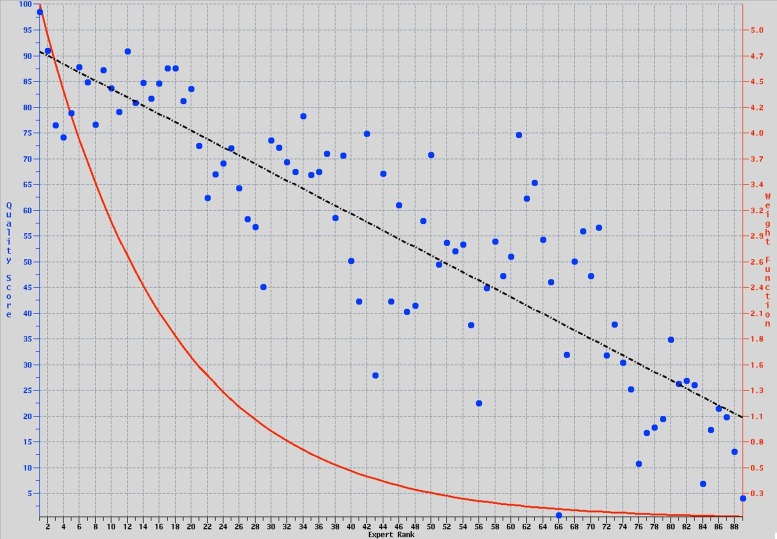
In this paper, we describe a statistically based algorithm to quantify the uniformity of illumination in an optical light microscopy imaging system that outputs a single quality factor (QF) score. The importance of homogeneous field illumination in quantitative light microscopy is well understood and often checked. However, there is currently no standard automatic quantitative measure of the uniformity of the field illumination. Images from 89 different laser-scanning confocal microscopes (LSCMs), which were collected as part of an international study on microscope quality assessment, were used as a "training" set to build the algorithm. To validate the algorithm and verify its robustness, images from 33 additional microscopes, including LSCM and wide-field (WF) microscopes, were used. The statistical paradigm used for developing the quality scoring scale was a regression approach to supervised learning. Three intensity profiles across each image-2 corner-to-corner diagonals and a center horizontal-were used to generate pixel-intensity data. All of the lines passed through the center of the image. The intensity profile data then were converted into a single-field illumination QF score in the range of 0-100, with 0 having extreme variation, and therefore, essentially unusable, and 100 having no deviation, i.e., straight lines with a constant uniform intensity. Empirically, a QF ≥ 83 was determined to be the minimum acceptable value based on manufacturer acceptance tests and reasonably achievable values. This new QF is an invaluable metric to ascertain objectively and easily the uniformity of illumination quality, provide a traceable reference for monitoring field uniformity over time, and make a direct comparison among different microscopes. The QF can also be used as an indicator of system failure and the need for alignment or service of the instrument.
Keywords: alignment; flat field; imaging; quality assessment; supervised learning.
Figures
References
-
- Model MA, Blank JL. Concentrated dyes as a source of two-dimensional fluorescent field for characterization of a confocal microscope. J Microsc 2008;229:12–16. - PubMed
-
- Kedziora KM, Prehn JH, Dobrucki J, Bernas T. Method of calibration of a fluorescence microscope for quantitative studies. J Microsc 2011;244:101–111. - PubMed
-
- Zucker RM, Price OT. Practical confocal microscopy and the evaluation of system performance. Methods 1999;18:447–458. - PubMed
-
- Matthews C, Cordelières FP. MetroloJ: an ImageJ plugin to help monitor microscopes' health. Image J User & Developer Conference. Mondorf-les-Bains, Luxembourg,2010.
-
- DeRose PC, Resch-Genger U. Recommendations for fluorescence instrument qualification: the new ASTM Standard Guide. Anal Chem 2010;82:2129–2133. - PubMed
Publication types
MeSH terms
LinkOut - more resources
Full Text Sources
Other Literature Sources