Comparative Study
. 2015 Jul;26(2):54-65.
doi: 10.7171/jbt.15-2602-003.

Any Way You Slice It-A Comparison of Confocal Microscopy Techniques

Affiliations
Comparative Study

Any Way You Slice It-A Comparison of Confocal Microscopy Techniques

James Jonkman et al. J Biomol Tech. 2015 Jul.

Abstract

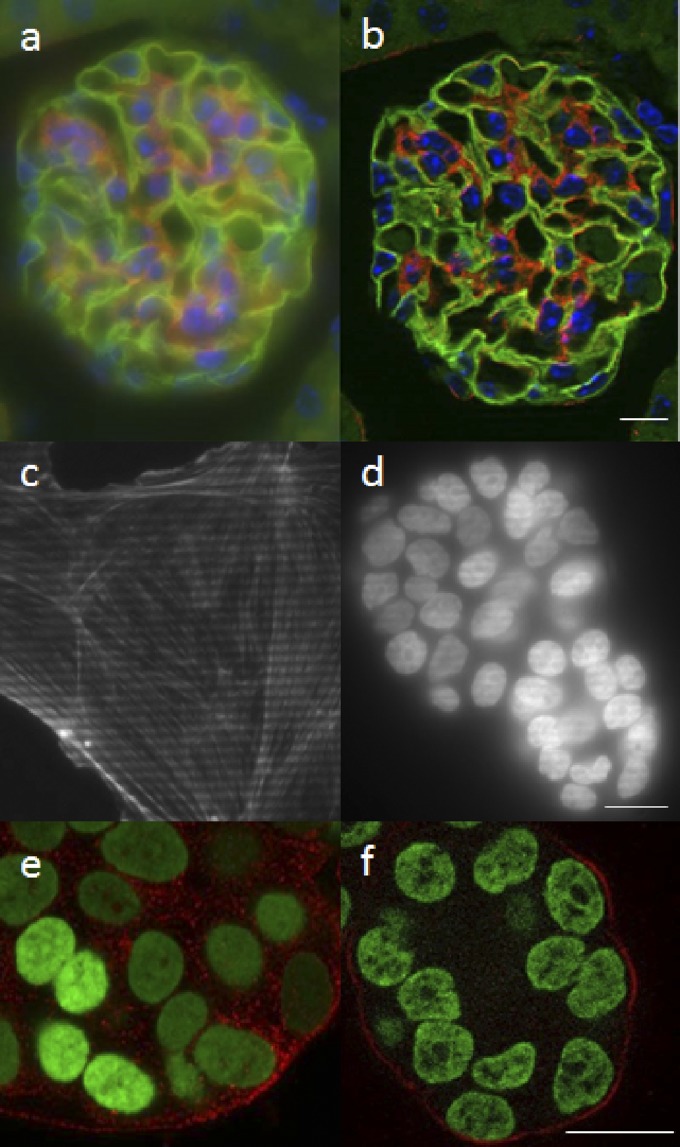
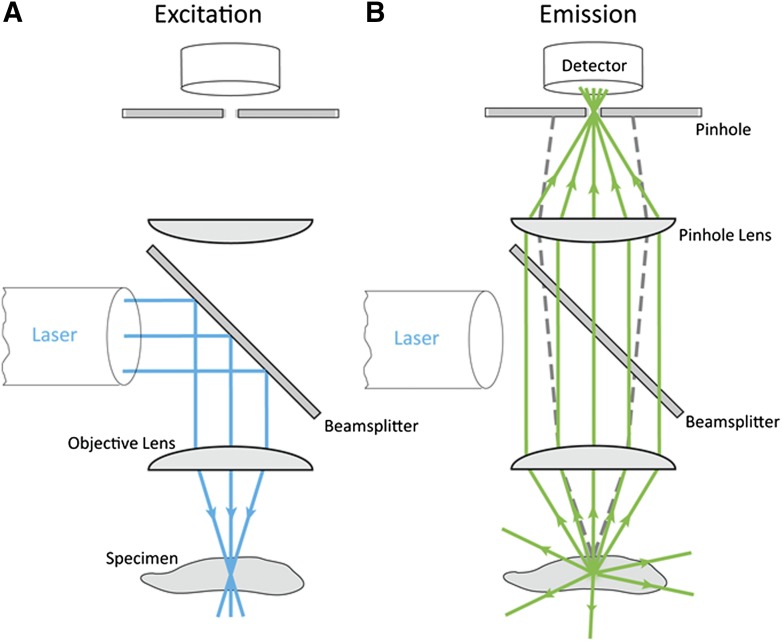
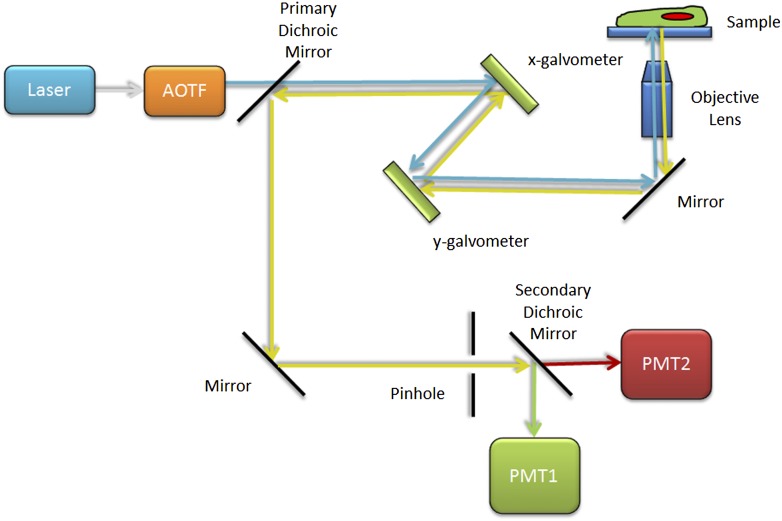
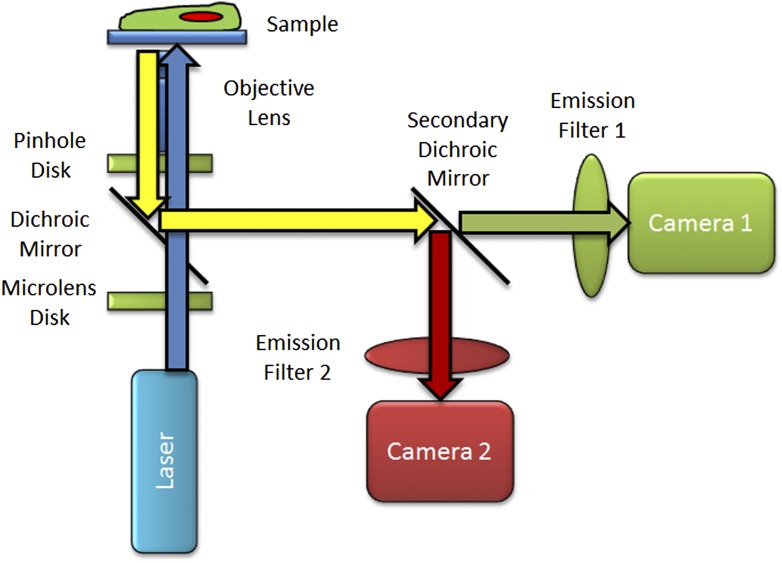
The confocal fluorescence microscope has become a popular tool for life sciences researchers, primarily because of its ability to remove blur from outside of the focal plane of the image. Several different kinds of confocal microscopes have been developed, each with advantages and disadvantages. This article will cover the grid confocal, classic confocal laser-scanning microscope (CLSM), the resonant scanning-CLSM, and the spinning-disk confocal microscope. The way each microscope technique works, the best applications the technique is suited for, the limitations of the technique, and new developments for each technology will be presented. Researchers who have access to a range of different confocal microscopes (e.g., through a local core facility) should find this paper helpful for choosing the best confocal technology for specific imaging applications. Others with funding to purchase an instrument should find the article helpful in deciding which technology is ideal for their area of research.

Keywords: 3D imaging; grid confocal; laser scanning; resonant scanning; spinning disk.


Figures

Figure 1
Figure 1
Comparison of 3D imaging techniques. Comparison of wide-field (a, c, and e) and CLSM (b, d, and f) images of samples of various thicknesses. A thin sample of cultured epithelial cells labeled with DAPI, Alexa 488-phalloidin (actin filament strain), and MitoTracker Red mitochondrial stain does not show a huge difference between wide-field (a) and CLSM (b) images. Intermediate thickness sample images of an ∼20-μm-thick mouse kidney section, labeled with DAPI, Alexa 488-wheat germ agglutinin (membrane stain), and Alexa 568-phalloidin (actin filament staining), show significant improvement of image quality and specimen detail in CLSM (d) vs. wide-field (c) images. Thick sample images of a 3D culture of MCF-10A mammary epithelial cell spheroid of ∼50 μm thick, labeled with a nuclear green fluorescent protein fusion and a red fluorescent protein fusion marking the membranes, again show significant improvement in CLSM (f) vs. wide-field (e) images. Scale bars, 20 μm.
Figure 2
Figure 2
Performance of the grid confocal microscope. Comparison of wide-field (a) and grid confocal (b) images for the same kidney sample as shown in Fig. 1c, d. The grid pattern is readily apparent when projected into a thin specimen (c) but is lost in the haze for an ∼50-μm-thick specimen (d). The CLSM (e) gives a much higher S/N, more accurate, and artifact-free image of the sample than the grid confocal (f). Scale bars, 20 μm.
Figure 3
Figure 3
Schematic diagram of the CLSM. The excitation laser beam light path (A) and emission light path (B). The solid blue lines in (A) represent the excitation laser that is focused onto the specimen. The solid green lines in (B) show that emission light from the focal plane passes through the pinhole aperture and is detected by the PMT. However, the dashed gray lines show that out-of-focus light will be blocked, will not pass through the pinhole, and will not be detected by the PMT. Reprinted with permission from Methods in Cell Biology V123, p113-134, 2014.
Figure 4
Figure 4
Basic CLSM light path. Schematic diagram of the CLSM light path with blue excitation light selected by the AOTF. The light is focused onto the sample by the objective lens and then scanned across the sample by the x and y galvanometer mirrors. Emission light is focused by the objective lens, descanned by the mirrors, and reflected toward the detection light path by the primary dichroic mirror. In-focus light is selected by the pinhole aperture. The secondary dichroic mirror splits the green emission light and directs it to be detected by PMT1, and the red emission light passes and is detected by PMT2.
Figure 5
Figure 5
Demonstration of the flexibility of the CLSM for scanning different sizes of the FOV with optimal resolution. Fixed HeLa cells labeled with DAPI (blue) and Alexa 488-H2AX (green), captured as a low-resolution overview image by scanning the entire FOV of a 63×/1.4 NA oil objective lens on a CLSM (a). A maximum-intensity projection of a 10-image z-stack of a zoomed-in area of the same sample as in (a) with an optimal pixel size of 0.1 μm (b). Maximum-intensity projection of a z-stack of a fixed rat brain section, imaged with a 20×/0.8 NA objective lens on a CLSM showing the complete SCN structure (c) labeled with DAPI (blue), arginine-vasopressin (green), and the proto-oncogene, C-Fos (red). Zoomed-in image of (c) showing that individual nuclei can be easily quantified for number and intensity from this large FOV high-resolution CLSM image (d). Scale bars, 10 μm (a and b) and 100 μm (c and d).
Figure 6
Figure 6
Basic SDCM light path. Schematic diagram showing blue laser light passing through the microlens array disk and being focused through the dichroic mirror and through the pinhole array disk. These 2 disks along with the dichroic mirror spin as 1 unit. As the disk spins, many laser beam spots are focused onto the sample by the objective lens and are scanned across the sample in the FOV. Emission light from the sample is focused by the objective lens back through the pinhole array disk, is reflected off of the primary dichroic mirror, and split into green and red emission channels by the secondary dichroic mirror. In this example, 2 camera-based detectors are used to generate images of green and red stains.
Figure 7
Figure 7
Live-cell SDCM time series images. Successive frames of a time-lapse sequence show that microtubule dynamics in smooth muscle cells can be observed by imaging eGFP-tubulin using a 60×/1.4 NA oil objective on a Yokogawa SDCM (a–c). A zoomed-in time overlay image shows isosurfaces of the microtubules and changes in microtubule location and length (d). The differences in microtubule length between successive frames are modeled as cyan showing the location of the microtubules in frame (a). The green isosurfaces represent changes in microtubule position and length between frame (a) and frame (b). The red isosurfaces represent changes in the microtubule position and length from frame b to c. Isosurfaces were calculated and generated using Imaris software from Bitplane Incorporated (Zurich, Switzerland). The yellow arrowhead denotes the same location in each frame. The timescales in a–c are shown in seconds. Scale bars, 10 μm.
Figure 8
Figure 8
FOV comparison for an SDCM and a CLSM. A fixed mouse kidney section as in Fig. 1c, d was imaged with the same 20×/0.75 NA objective lens on a Yokogawa spinning-disk confocal equipped with a 512 × 512 pixel EM-CCD camera (inner square) and with the full FOV available on an Olympus FluoView 1000 CLSM (outer square; Tokyo, Japan). Scale bar, 100 μm.

References

    1. Minsky M. Memoir on inventing the confocal scanning microscope. Scanning 1988;10:128–138.
    1. White JG, Amos WB, Fordham M. An evaluation of confocal versus conventional imaging of biological structures by fluorescence light microscopy. J Cell Biol 1987;105:41–48. - PMC - PubMed
    1. Denk W, Strickler JH, Webb WW. Two-photon laser scanning fluorescence microscopy. Science 1990;248:73–76. - PubMed
    1. Klar TA, Jakobs S, Dyba M, Egner A, Hell SW. Fluorescence microscopy with diffraction resolution barrier broken by stimulated emission. Proc Natl Acad Sci USA 2000;97:8206–8210. - PMC - PubMed
    1. Galdeen SA, North AJ. Live cell fluorescence microscopy techniques. Methods Mol Biol 2011;769:205–222. - PubMed

Publication types

MeSH terms