. 2015:2015:943056.
doi: 10.1155/2015/943056. Epub 2015 Jan 31.

Biofilm-forming Staphylococcus epidermidis expressing vancomycin resistance early after adhesion to a metal surface

Affiliations

Biofilm-forming Staphylococcus epidermidis expressing vancomycin resistance early after adhesion to a metal surface

Toshiyuki Sakimura et al. Biomed Res Int. 2015.

Abstract

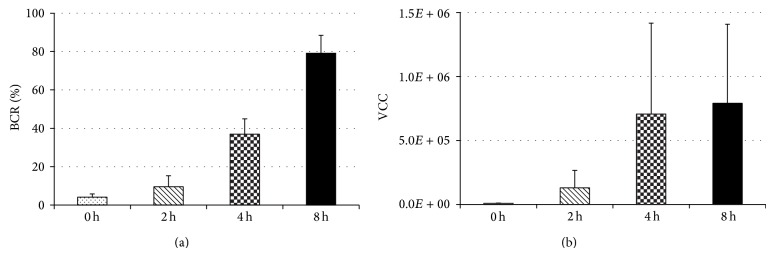
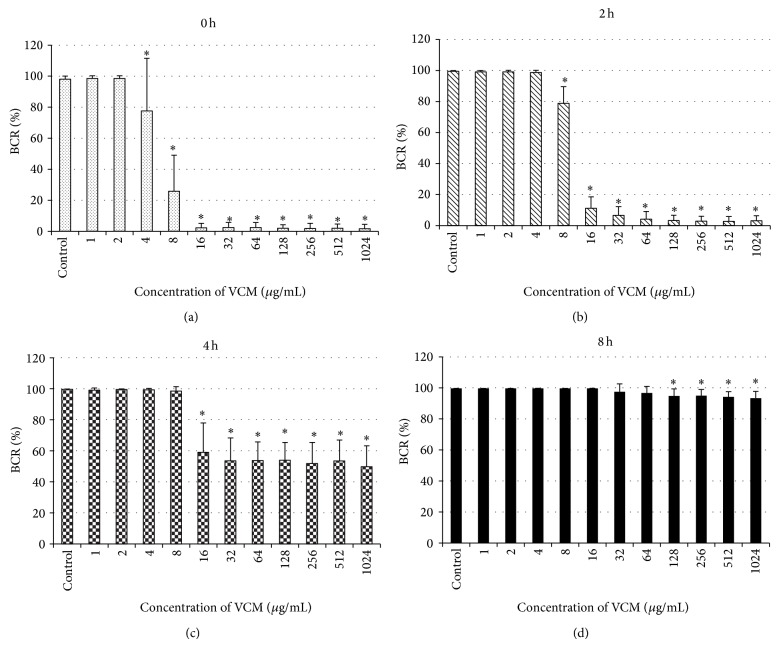
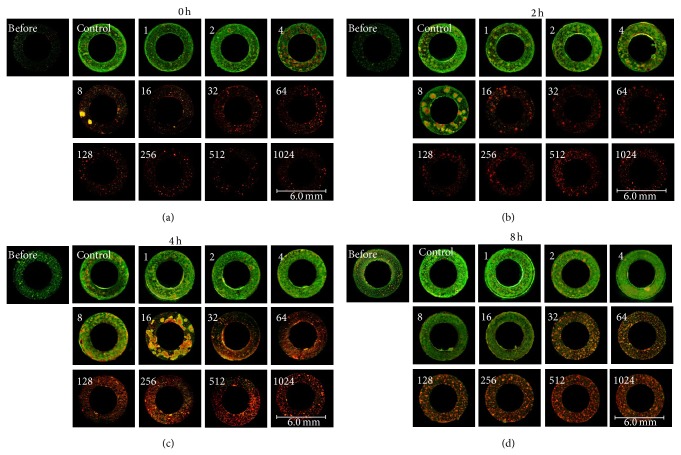
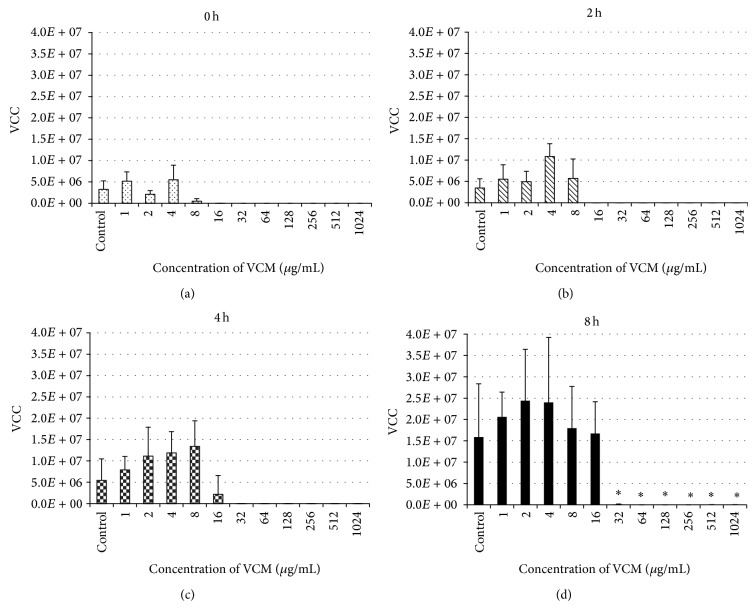
We investigated biofilm formation and time of vancomycin (VCM) resistance expression after adhesion to a metal surface in Staphylococcus epidermidis. Biofilm-forming Staphylococcus epidermidis with a VCM MIC of 1 μg/mL was used. The bacteria were made to adhere to a stainless steel washer and treated with VCM at different times and concentrations. VCM was administered 0, 2, 4, and 8 hours after adhesion. The amount of biofilm formed was evaluated based on the biofilm coverage rates (BCRs) before and after VCM administration, bacterial viability in biofilm was visually observed using the fluorescence staining method, and the viable bacterial count in biofilm was measured. The VCM concentration required to decrease BCR significantly compared with that of VCM-untreated bacteria was 4 μg/mL, even in the 0 hr group. In the 4 and 8 hr groups, VCM could not inhibit biofilm growth even at 1,024 μg/mL. In the 8 hr group, viable bacteria remained in biofilm at a count of 10(4) CFU even at a high VCM concentration (1,024 μg/mL). It was suggested that biofilm-forming Staphylococcus epidermidis expresses resistance to VCM early after adhesion to a metal surface. Resistance increased over time after adhesion as the biofilm formed, and strong resistance was expressed 4-8 hours after adhesion.


Figures

Figure 1
Figure 1
BCR and VCC after adhesion. After 5-minute adhesion to the washer surface, the bacteria were cultured and formed biofilm in TSB for 0, 2, 4, and 8 hours. BCRs on the washer surface were 4.1, 9.5, 37.0, and 79.2% in the immediate, 2 hr, 4 hr, and 8 hr groups, respectively, showing a significant increase with prolongation of the culture time in TSB (a). VCCs in biofilm were 7.2 × 10³, 1.3 × 10⁵, 7.0 × 10⁵, and 7.9 × 10⁵ CFU, respectively, showing no significant difference among the groups (b). Values represent mean and error bars indicate SD (n = 80 (a), n = 5 (b)).
Figure 2
Figure 2
Changes in BCR with changes in the VCM concentration administered at various time points of biofilm formation. In the immediate group, BCR after 20-hour culture was 98% or higher when the VCM concentration was 2 μg/mL or lower (a). BCR significantly decreased when the VCM concentration was 4 μg/mL or higher(a). In the 2 hr group, BCR was 98% or higher when the VCM concentration was 4 μg/mL or lower. BCR significantly decreased to 78.8% at 8 μg/mL (b). In the 4 hr group, BCR was 98% or higher when the VCM concentration was 8 μg/mL or lower, it significantly decreased to 59.1% at 16 μg/mL, and it was mostly constant at 32 μg/mL or higher (53.9–49.8%) (c). In the 8 hr group, BCR was 96% or higher when the VCM concentration was 64 μg/mL or lower, it significantly decreased to 94.8% at 128 μg/mL, and it was mostly constant at 256 μg/mL or higher (94.9–93.4%) (d). Values represent mean and error bars indicate SD (n = 80). * P < 0.001 versus control.
Figure 3
Figure 3
Changes in the distribution of live and dead bacteria with changes in the VCM concentration administered at various time points of biofilm formation on fluorescence staining using LIVE/DEAD BacLight. The cultures were observed under a fluorescence microscope (8x magnification). Numbers in the figures represent the VCM concentrations (μg/mL). In the immediate group, most bacteria were alive, stained green, when the VCM concentration was 2 μg/mL or lower, similarly to those in the control group. Dead bacteria, stained red, surrounded by live bacteria appeared as spots at 4 μg/mL, and the rate of live bacteria decreased and the rate of dead bacteria increased at 8 μg/mL. Most bacteria were dead at 16 μg/mL or higher (a). In the 2 hr group, most bacteria were alive when the VCM concentration was 4 μg/mL or lower. Dead bacteria surrounded by live bacteria appeared as spots at 8 μg/mL, and the rate of live bacteria decreased and the rate of dead bacteria increased at 16 μg/mL. Most bacteria were dead at 32 μg/mL or higher (b). In the 4 hr group, most bacteria were alive when the VCM concentration was 4 μg/mL or lower. Dead bacteria surrounded by live bacteria appeared as spots at 8 μg/mL, these spots of dead bacteria expanded at 16 μg/mL, and the rate of live bacteria decreased at 32 μg/mL. Most bacteria were dead at 62 μg/mL or higher (c). In the 8 hr group, most bacteria were alive when the VCM concentration was 16 μg/mL or lower. The rate of live bacteria decreased and the rate of dead bacteria increased at 32 μg/mL, and most bacteria were dead at 64 μg/mL or higher (d).
Figure 4
Figure 4
Changes in VCC with changes in the VCM concentration administered at various time points of biofilm formation. No significant changes were noted in the viable cell count in biofilm after 20-hour culture among the VCM concentrations in the immediate, 2 hr, or 4 hr group ((a), (b), (c)). VCC was 107–105 CFU when the VCM concentration was 0–8 μg/mL in the immediate, 2 hr, and 4 hr groups. The count was only 103 CFU at 16 μg/mL and 0–10 CFU at 32 μg/mL or higher in the immediate and 2 hr groups. In the 4 hr group, the count was 102 CFU at 32 μg/mL or higher and only 10 CFU at 64 μg/mL or higher. In the 8 hr group, the count was 107–105 CFU after 20-hour culture in the presence of VCM at 16 μg/mL or lower, showing no effect of VCM, and it significantly decreased at 32 μg/mL or higher (d), but the count was still high (2.4 × 10⁴ CFU) even at the highest VCM concentration (1,024 μg/mL). Values represent mean and error bars indicate SD (n = 5). * P < 0.001 versus control.

References

    1. Barberán J. Management of infections of osteoarticular prosthesis. Clinical Microbiology and Infection. 2006;12(supplement 3):93–101. doi: 10.1111/j.1469-0691.2006.01400.x. - DOI - PubMed
    1. Zimmerli W. Clinical presentation and treatment of orthopaedic implant-associated infection. Journal of Internal Medicine. 2014;276(2):111–119. doi: 10.1111/joim.12233. - DOI - PubMed
    1. Arnold W. V., Shirtliff M. E., Stoodley P. Bacterial biofilms and periprosthetic infections. The Journal of Bone and Joint Surgery: American Volume. 2013;95(24):2223–2229. - PMC - PubMed
    1. Gristina A. G., Costerton J. W. Bacterial adherence to biomaterials and tissue. The significance of its role in clinical sepsis. The Journal of Bone and Joint Surgery: American Volume. 1985;67(2):264–273. - PubMed
    1. Stoodley P., Nistico L., Johnson S., et al. Direct demonstration of viable Staphylococcus aureus biofilms in an infected total joint arthroplasty: a case report. The Journal of Bone and Joint Surgery: American Volume. 2008;90(8):1751–1758. doi: 10.2106/jbjs.g.00838. - DOI - PMC - PubMed

MeSH terms

LinkOut - more resources