

Review
doi: 10.1088/0031-9155/60/8/R155.
Epub 2015 Mar 24.
The physics of proton therapy
Affiliations
- PMID: 25803097
- PMCID: PMC4407514
- DOI: 10.1088/0031-9155/60/8/R155
Item in Clipboard
Review
The physics of proton therapy
Phys Med Biol.
.
Abstract
The physics of proton therapy has advanced considerably since it was proposed in 1946. Today analytical equations and numerical simulation methods are available to predict and characterize many aspects of proton therapy. This article reviews the basic aspects of the physics of proton therapy, including proton interaction mechanisms, proton transport calculations, the determination of dose from therapeutic and stray radiations, and shielding design. The article discusses underlying processes as well as selected practical experimental and theoretical methods. We conclude by briefly speculating on possible future areas of research of relevance to the physics of proton therapy.
Figures
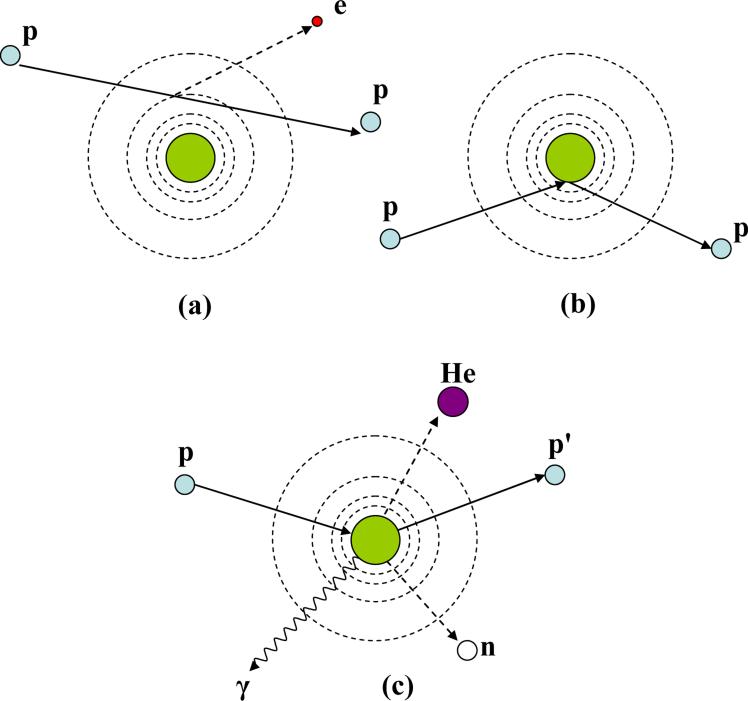
Schematic illustration of proton interaction mechanisms: (a) energy loss via Coulombic interactions, (b) deflection of proton trajectory by repulsive Coulomb scattering with nucleus, (c) removal of primary proton and creation of secondary particles via non-elastic nuclear interaction. (p: proton, e: electron, n: neutron, He: Helium, γ: gamma rays)
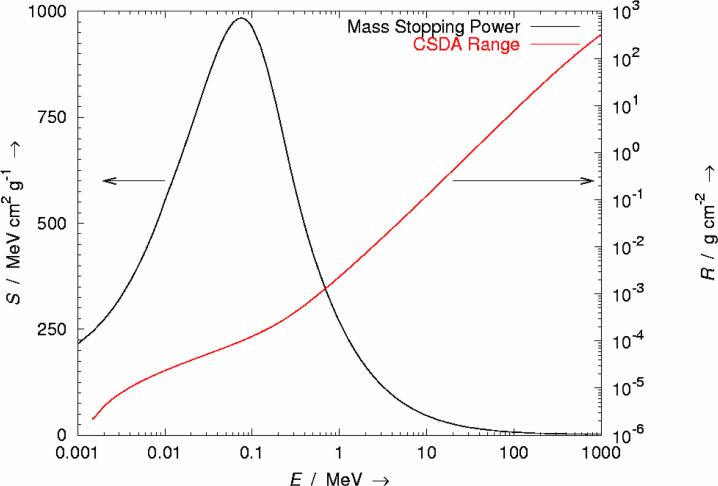
Mass stopping power (S) versus ion energy (E) for protons in liquid water. The corresponding range (R), calculated using the plotted S values and on the assumption of the continuous slowing down approximation (CSDA), is also plotted.
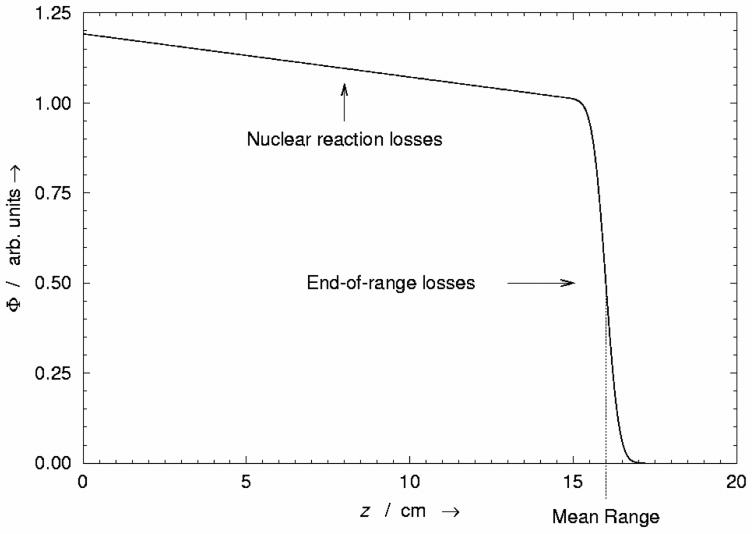
Relative fraction of the fluence Φ in a broad beam of protons remaining as a function of depth z in water. The gradual depletion of protons from entrance to near the end of range is caused by removal of protons from nuclear reactions. The rapid falloff in the number of protons near the end of range is caused by ions running out of energy and being absorbed by the medium. The sigmoid shape of the distal falloff is caused by range straggling or by stochastic fluctuations in the energy loss of individual protons.
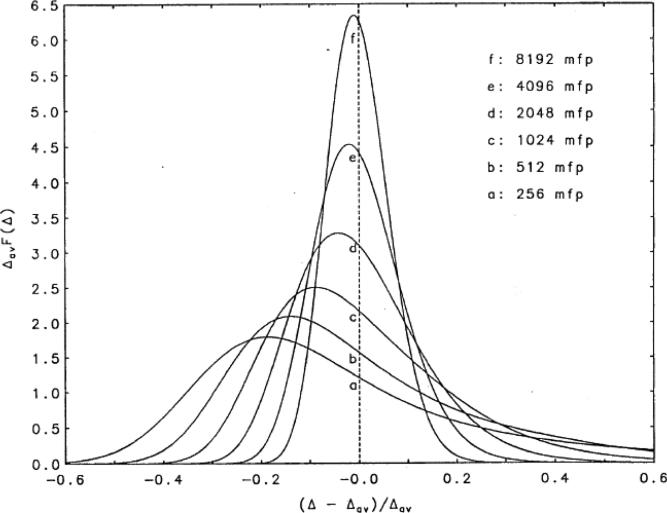
Energy loss probability density functions (PDF) are plotted for various thicknesses of water absorbers, where the thickness is expressed in units of mean free path (mfp). For visual clarity, the energy-loss PDFs have been scaled on both the abscissa and ordinate. The single event energy loss is expressed as a fraction of the mean energy lost in the entire absorber thickness, or (Δ-Δav)/Δav. Each PDF was scaled so that the integral over all energy-loss values yields unit value. For thin absorbers (curves a-e), the PDFs are broader and asymmetric and are modeled with the Vavilov (1957) or Landau (1944) theories. For thick absorbers (curve f), the PDFs are symmetric and well-approximated with Bohr's theory (1915), i.e., a Gaussian distribution. (ICRU, 1993)
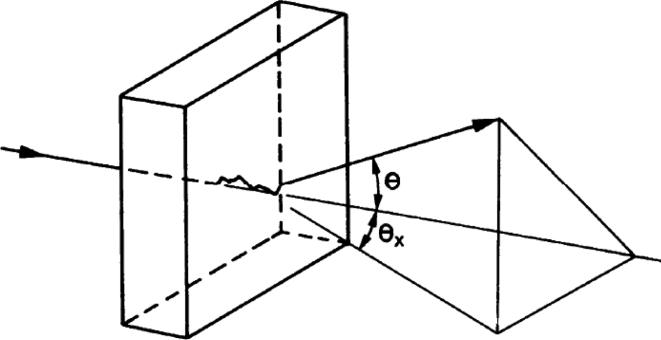
Schematic diagram showing the trajectory of a proton undergoing multiple Coulomb scattering events. θ is the root mean square (rms) space scattering angle and θx is the projected rms scattering angle. (Leo, 1994)
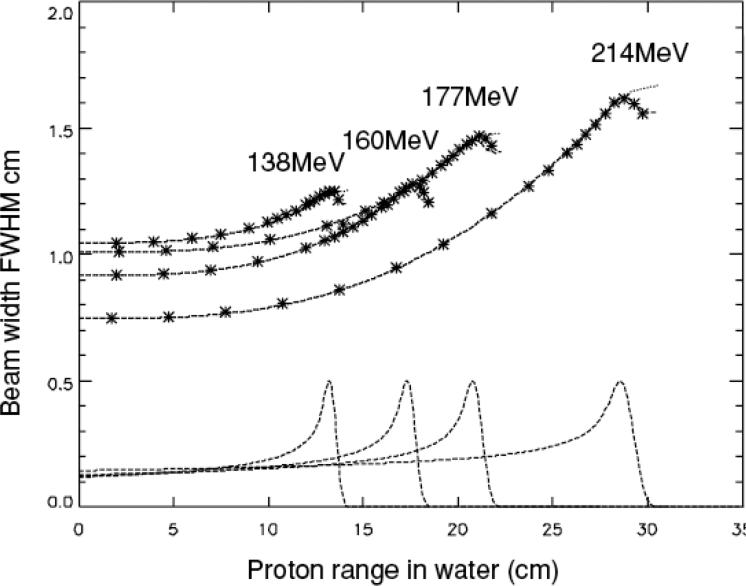
Broadening of the beam width in water due to multiple Coulomb scattering. (Pedroni et al, 2005)
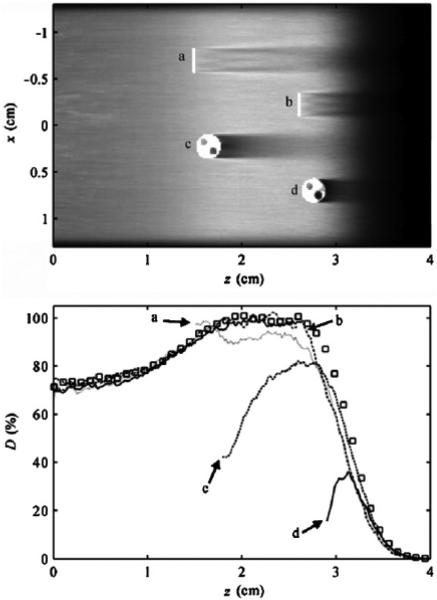
Small implanted fiducial markers can create clinically significant dosimetric cold spots in proton therapy beams. (Upper) two-dimensional dose distribution as a function of depth in water (z) and crossfield position (x) from a Monte Carlo simulation of range-modulated proton beam incident on a water phantom containing tantalum localization markers oriented (a, b) parallel to the beam axis and (c, d) perpendicular to the beam axis. The range and modulation width are typical for uveal melanoma treatments. (Lower) simulated absorbed dose (D) as a function of depth (z) in the water phantom at various off-axis positions. The perturbed depth dose profiles are parallel to the beam axis and pass through the center of markers a–d in the plot above. For visual clarity, portions of the perturbed dose profiles upstream of the markers are not shown. An unperturbed beam is plotted with open squares. (Newhauser et al, 2007c)
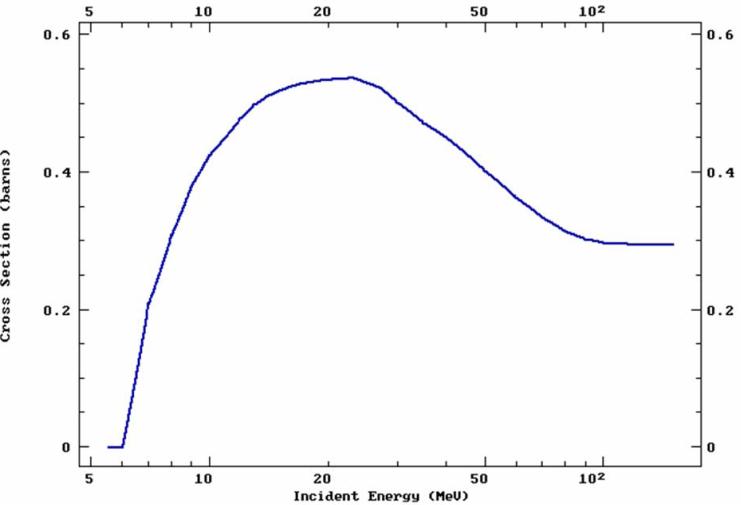
The total proton-induced non-elastic nuclear reaction versus proton energy, showing a threshold corresponding to the Coulomb barrier at approximately 6 MeV. (ENDF, 2013)
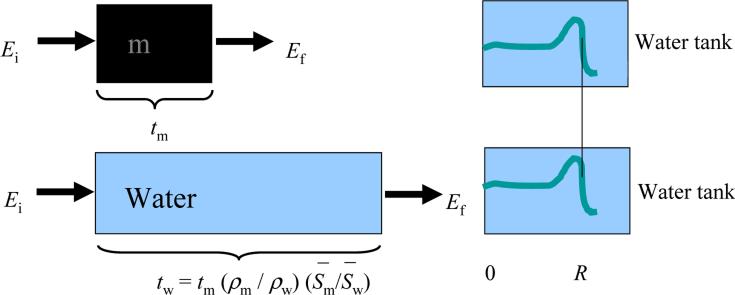
Schematic illustration of the concept of water equivalent thickness (WET) and how it can be calculated or measured by observing changes in the depth of a proton Bragg peak in a water tank. (Zhang and Newhauser, 2009)
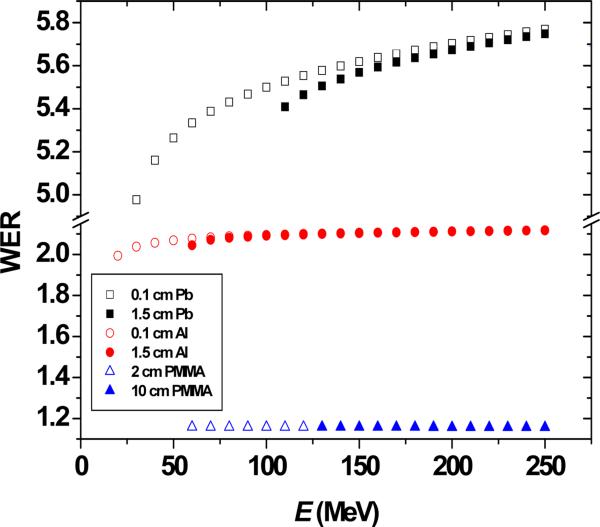
Calculated water-equivalent ratio (WER) values as a function of proton beam energy. This plot illustrates the dependence of WER value on the target material, the beam energy, and the target thickness. (Zhang and Newhauser, 2009)
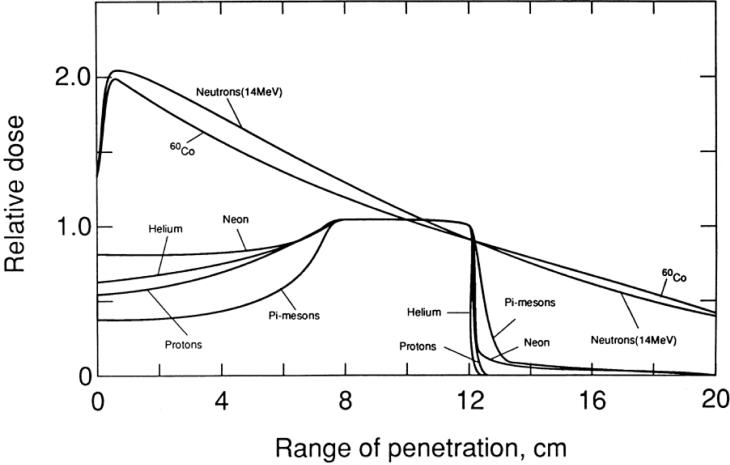
Central axis depth dose profiles from several particle beams. Note that these distributions are from solitary beams in order to clearly compare the differences in the physical properties of various radiations. The important features are that proton beams offer relatively low entrance dose and virtually no exit dose. However, many clinical treatment techniques exploit multiple field directions to enhance the uniformity of tumor coverage and to spare sensitive healthy tissues. In fact, in some cases proton treatments provide inferior skin sparing to photons and/or inferior target coverage, e.g., because of proton beams’ sensitivity to range errors. Nonetheless, beam for beam, proton beams provide excellent tissue sparing, especially beyond the end of range. (Larsson, 1993)
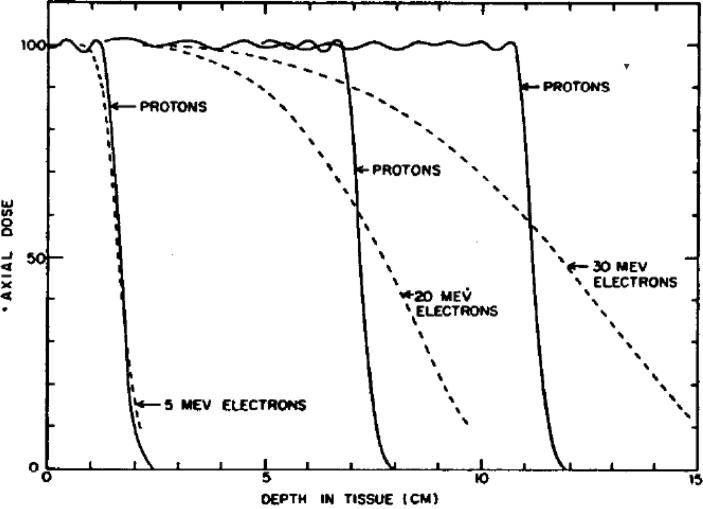
Comparison of depth-dose curves from proton SOBPs and from electron beams. Because the proton mass is nearly 2000 times that of an electron, proton scattering interactions (individual angular deflections and variations in collisional energy losses) are much smaller, leading to sharper lateral and distal falloff distances. (Koehler and Preston, 1972)
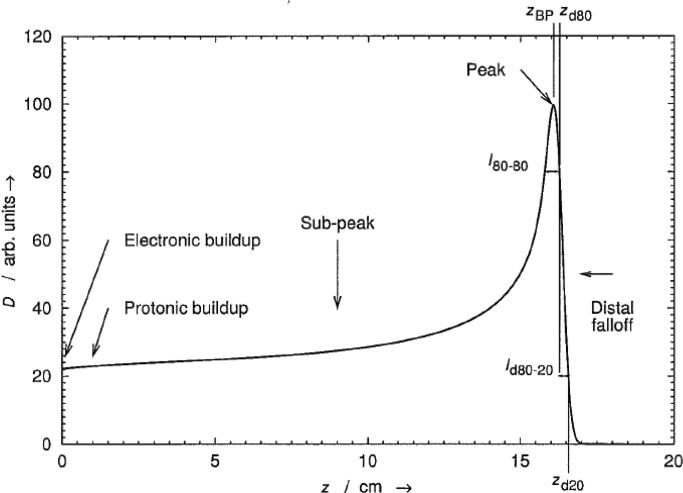
Absorbed dose D as a function of depth z in water from an unmodulated (pristine) proton Bragg peak produced by a broad proton beam with an initial energy of 154 MeV. The various regions, depths, and lengths that are labeled are defined in the text. (The electronic buildup is not visible in this plot.) This type of dose distribution is useful clinically because of the relatively low doses delivered to normal tissues in the sub-peak and distal-falloff regions relative to the target dose delivered by the peak.
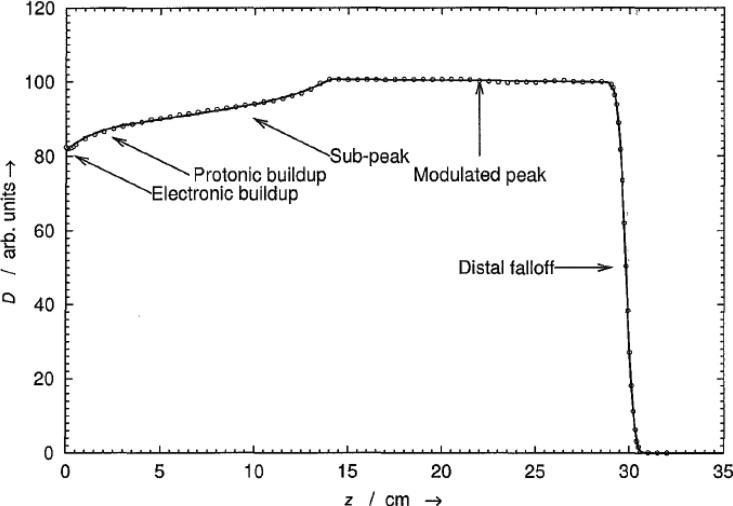
Absorbed dose D as a function of depth z in water from a spread-out proton Bragg peak (SOBP). Various locations and regions that are indicated on the plot are defined in the text. This peak was measured with a Markus-type parallel-plate ionization chamber in the Northeast Proton Therapy Center (NPTC) gantry. The measured data are plotted with open circles and the model-fit as a solid line. Note that the electronic buildup region, which spans only a few millimeters, is not visible in this plot.
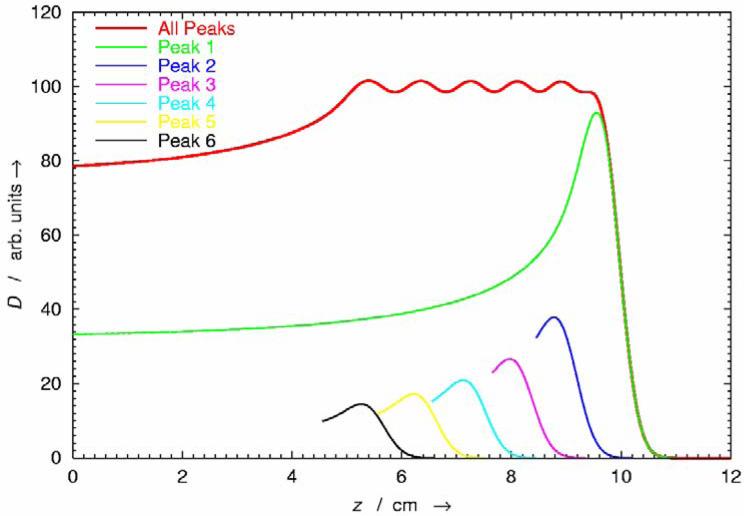
Absorbed dose D as a function of depth z in water from a spread-out Bragg peak (SOBP) (uppermost curve) and its constituent pristine Bragg peaks (lower curves; for clarity, all but the deepest pristine Bragg peak are only partly drawn). In many cases, the clinical target volume is larger than the width of a pristine Bragg peak. By appropriately modulating the proton range and fluence of pristine peaks, the extent of the high-dose region can be widened to cover the target volume with a uniform dose.
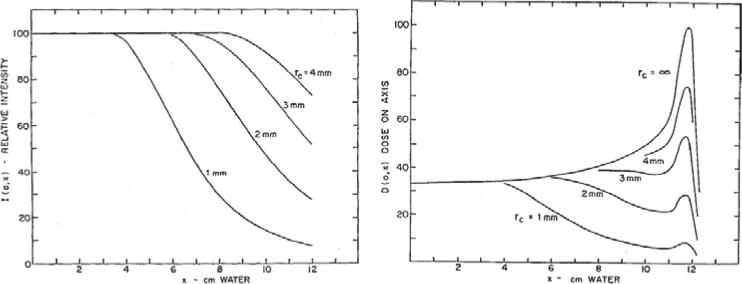
(Left) Proton fluence I(0; x) along the beam central axis vs. depth x in water. Curves are shown for beams with circular cross sections and radii of 1 mm to 4 mm. Some of the protons are lost because of scattering events that deflect them from the central axis. This is increasingly observed for small beams and at large depths. (Right) The corresponding central-axis absorbed-dose curves. Note how the fluence depletion reduces the absorbed dose at the peak relative to the entrance dose. (Preston and Koehler, 1998)
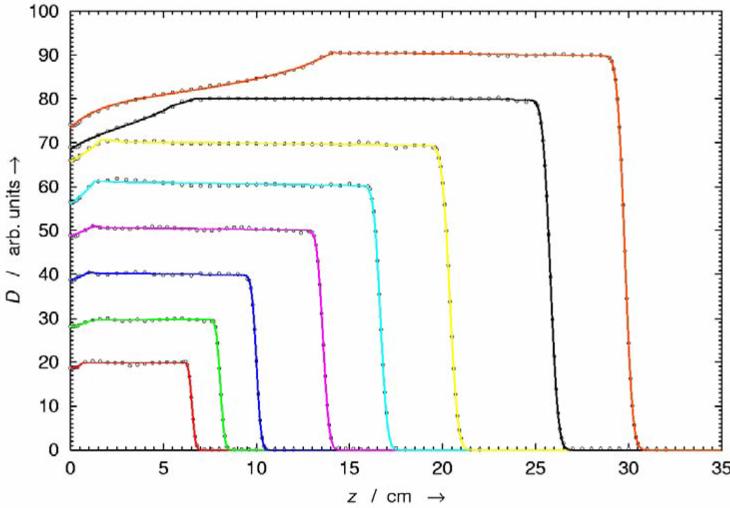
Absorbed dose D as a function of depth z in water from unmodulated (pristine) proton Bragg peaks produced by a broad proton beam with an initial energy of up to 235 MeV. With increasing depth, the accumulation of range straggling tends to broaden the peak. Beams that are more penetrating therefore have larger distal falloff distances.
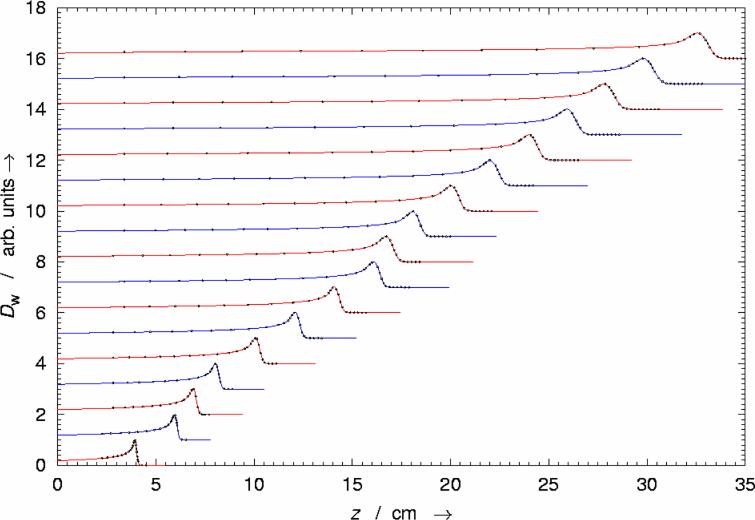
Absorbed dose D as a function of depth z in water from various spread out Bragg peaks (SOBP) from the Northeast Proton Therapy Center (NPTC) nozzle. Open- beam central-axis depth-dose curves are plotted for each of the eight range modulator wheel tracks. The experimental values (open circles) are from charge measurements with an air-filled ionization chamber, and the model fits are shown with solid lines. Each range modulation track was designed to work over an interval of proton energies. The flat modulated-peak region was achieved by modulating the proton-beam current synchronously with the modulator wheel rotation.
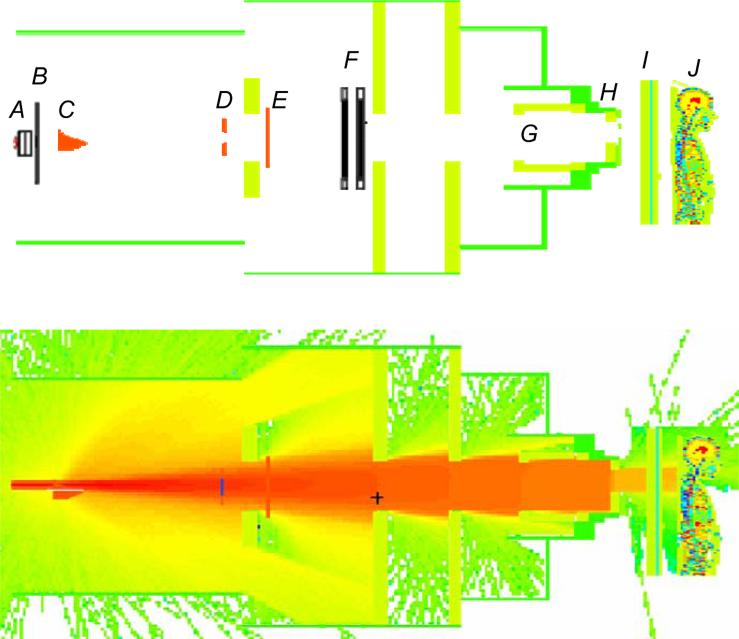
(Upper) Geometric model of proton therapy unit and the voxelized phantom oriented for the superior spinal proton field. The beam delivery system includes a vacuum window (A), a beam profile monitor (B), a range modulator wheel (C), a second scatterer (D), a range shifter assembly (E), backup and primary monitors (F), the snout (G), the range compensator (H), the treatment couch (I), and the patient (J). (Zhang et al, 2013a) (Lower) Simulated proton transport through the proton therapy unit and the patient.
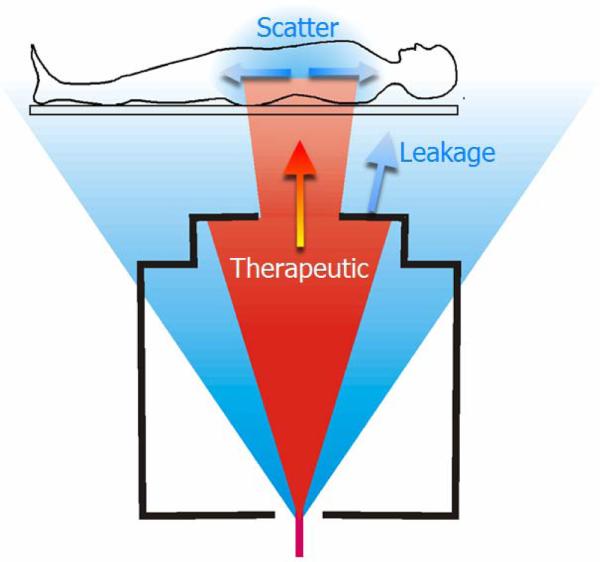
Schematic diagram of proton beam irradiation of the spine. There are several distinct sources of radiation exposure, including therapeutic protons (red), stray neutrons emanating from the treatment apparatus (blue), and neutrons produced by therapeutic proton radiation inside the body. A small-diameter beam of protons enters the treatment apparatus, which spreads the beam to a clinically useful size and collimates it to spare healthy tissues. The stray neutron is created by proton-induced nuclear reactions inside the treatment unit, some of which leak out and irradiate the patient. The stray radiation exposures provide no therapeutic benefit but increase the predicted risk that a patient will develop a radiogenic side effect, such as a second cancer, later in life. (Newhauser and Durante, 2011)
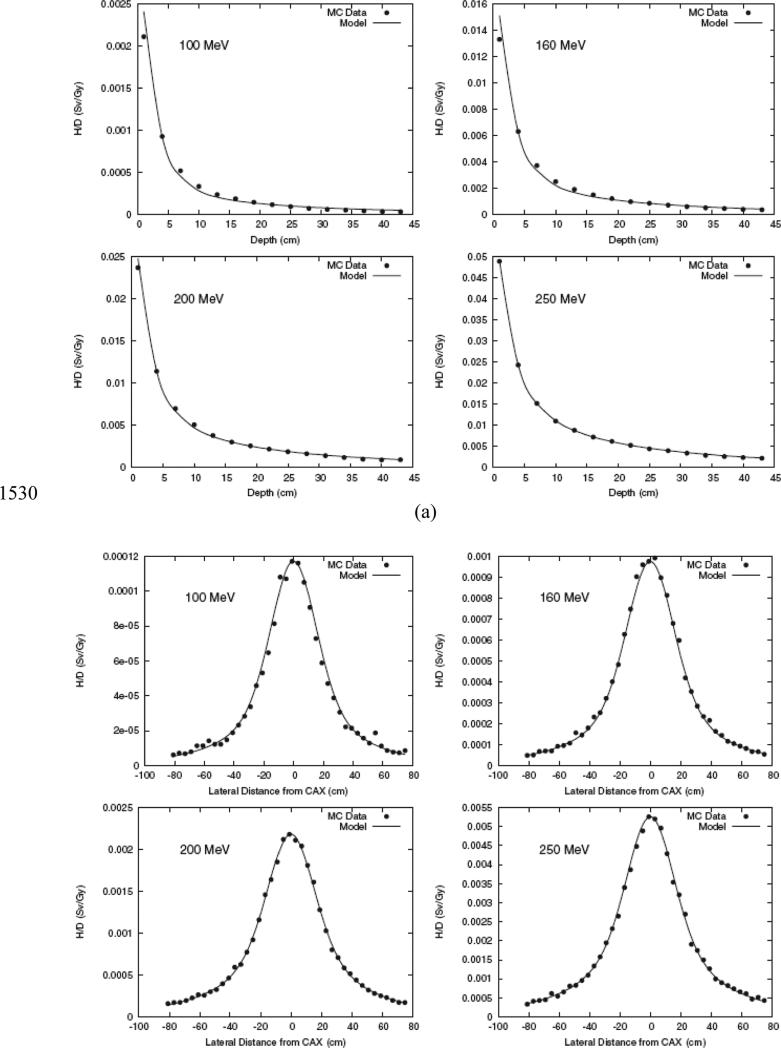
Results from Monte Carlo simulations and analytical model predictions of equivalent per therapeutic dose (H/D) for proton beams with various energies in the water phantom as a function of vertical depth (a) and lateral distance (b) (Perez-Andujar et al, 2013b).
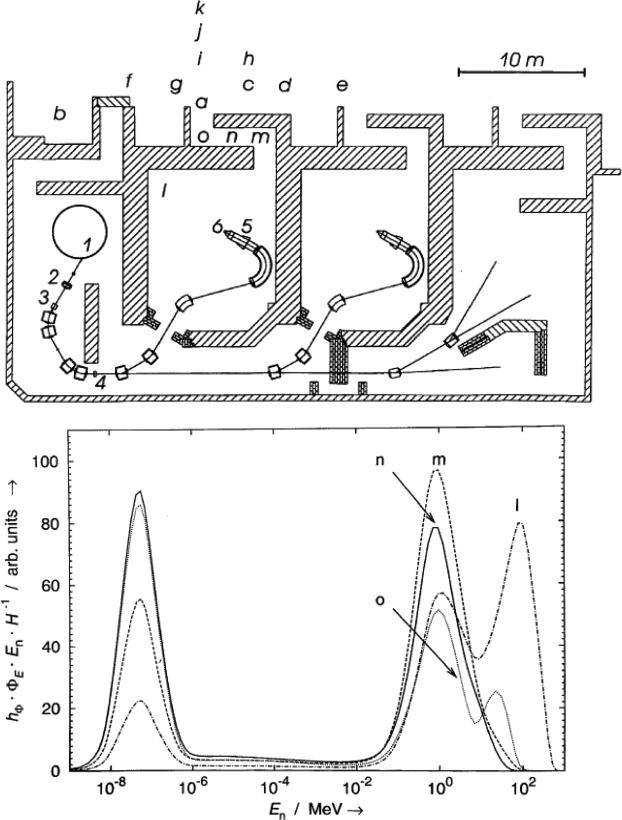
(Upper) The proton therapy facility treatment level: 235-MeV cyclotron (1), variable- thickness graphite energy degrader (2), momentum analysis magnets (3), slits (4), brass aperture (5), and beamstop at isocenter (6). Plan also shows the main control room (b), treatment room maze exit (m, n, o, a), and various corridors and occupied rooms on the level above (c–k). (Newhauser et al, 2002c) (Lower) Calculated neutron dose equivalent spectra at locations l–o in the gantry room and its maze (see Fig. 1) produced by a 235-MeV proton beam. The ordinate corresponds to the product of the neutron fluence-to-dose-equivalent conversion coefficient hΦ, the neutron spectral fluence ΦE, and the neutron energy En, where the product is normalized to the total neutron dose equivalent H. These spectra reveal differences in the shape due to the relative contributions from peaks due to thermal neutrons, evaporation neutrons, and cascade neutrons. The region between 10−6 and 10−2 MeV, corresponding to 1/En behavior of the spectral fluence, contributes relatively little to the total dose equivalent. (Newhauser et al, 2002c)
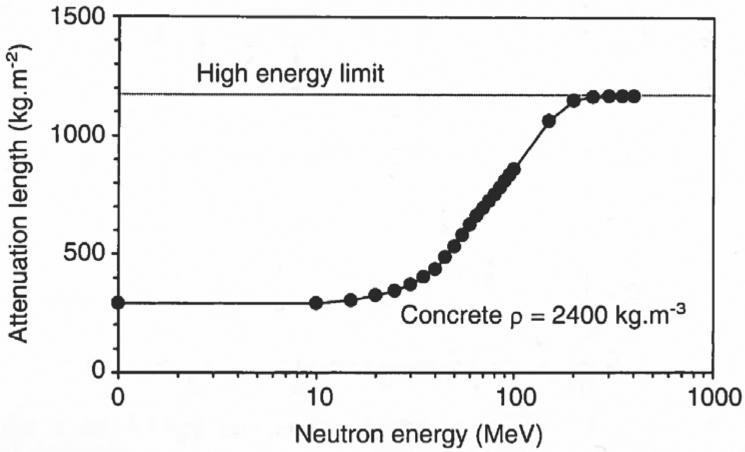
The attenuation length of neutrons in concrete versus neutron energy (Moritz, 2001).
References
-
- AAPM . American Association of Physicists in Medicine Task Group 20: Protocol for heavy charged-particle therapy beam dosimetry. New York, NY: 1986.
-
- Agosteo S. Radiation protection constraints for use of proton and ion accelerators in medicine. Radiation Protection Dosimetry. 2009;137:167–86. - PubMed
-
- Agosteo S, Birattari C, Caravaggio M, Silari M, Tosi G. Secondary neutron and photon dose in proton therapy. Radiother Oncol. 1998;48:293–305. - PubMed
-
- Agostinelli S, Allison J, Amako K, Apostolakis J. Geant4 - A simulation toolkit. Nuclear Instruments and Methods A. 2003;506:250–303.
-
- Andreo P. On the clinical spatial resolution achievable with protons and heavier charged particle radiotherapy beams. Phys Med Biol. 2009;54:N205–15. - PubMed
Publication types
MeSH terms
Substances
Grants and funding
LinkOut - more resources
Full Text Sources
Other Literature Sources