. 2015 Mar 24;10(3):e0120879.
doi: 10.1371/journal.pone.0120879. eCollection 2015.

Characterization of stimulus-secretion coupling in the human pancreatic EndoC-βH1 beta cell line

Affiliations

Characterization of stimulus-secretion coupling in the human pancreatic EndoC-βH1 beta cell line

Lotta E Andersson et al. PLoS One. .

Abstract

Aims/hypothesis: Studies on beta cell metabolism are often conducted in rodent beta cell lines due to the lack of stable human beta cell lines. Recently, a human cell line, EndoC-βH1, was generated. Here we investigate stimulus-secretion coupling in this cell line, and compare it with that in the rat beta cell line, INS-1 832/13, and human islets.

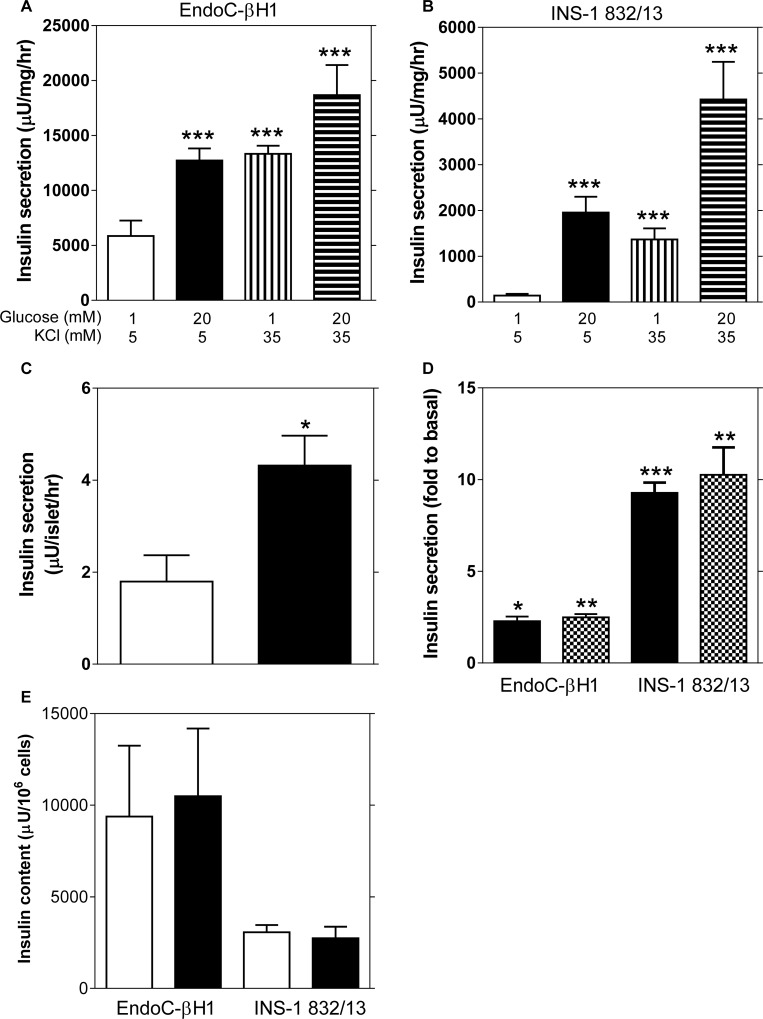
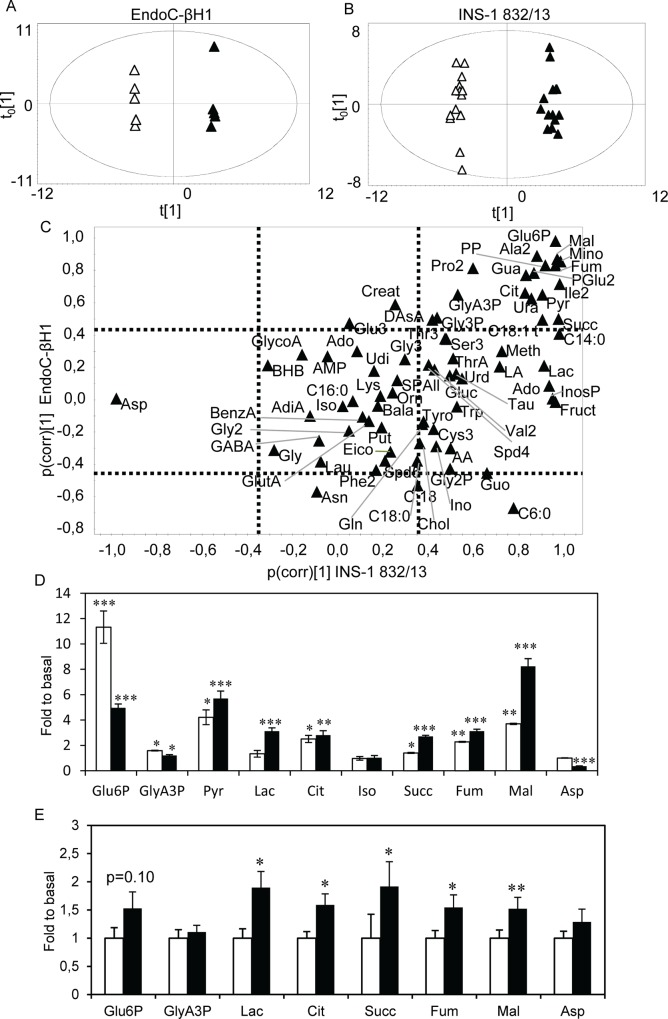
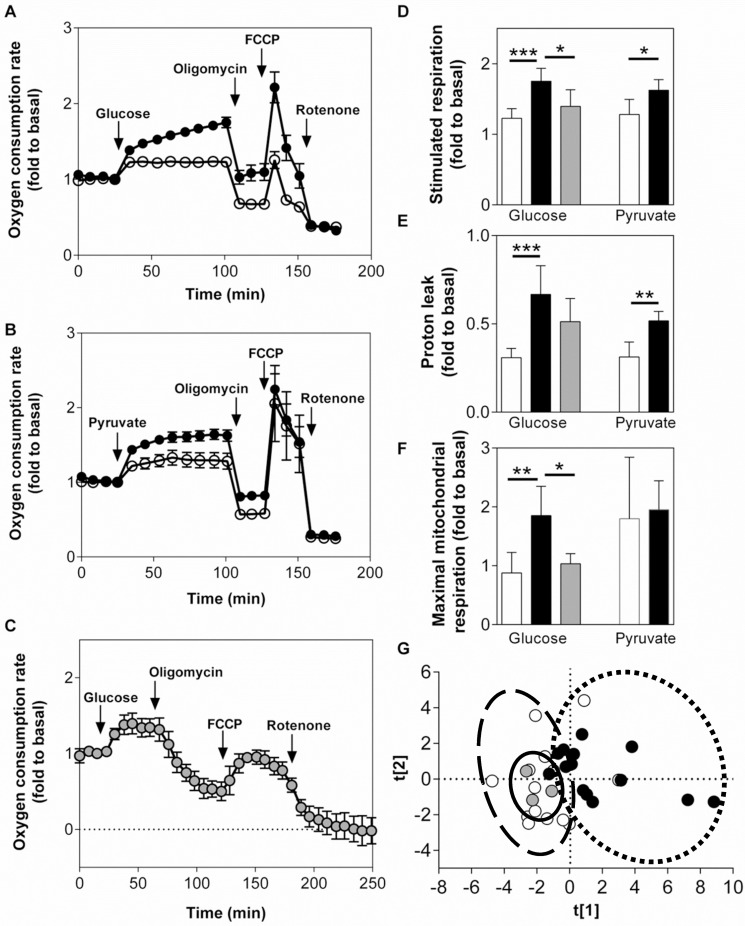
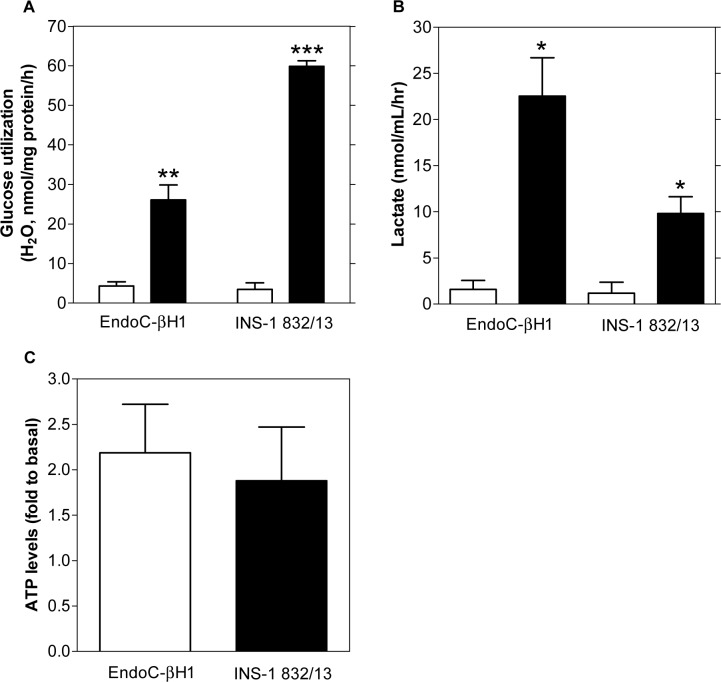
Methods: Cells were exposed to glucose and pyruvate. Insulin secretion and content (radioimmunoassay), gene expression (Gene Chip array), metabolite levels (GC/MS), respiration (Seahorse XF24 Extracellular Flux Analyzer), glucose utilization (radiometric), lactate release (enzymatic colorimetric), ATP levels (enzymatic bioluminescence) and plasma membrane potential and cytoplasmic Ca2+ responses (microfluorometry) were measured. Metabolite levels, respiration and insulin secretion were examined in human islets.

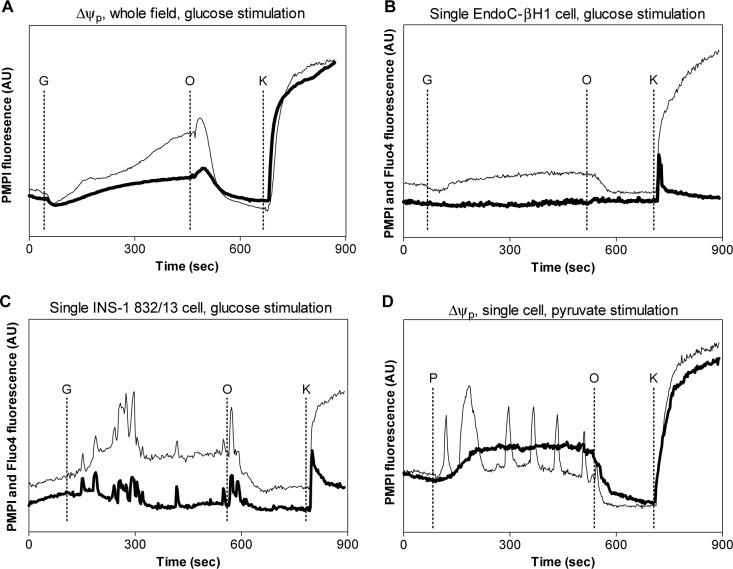
Results: Glucose increased insulin release, glucose utilization, raised ATP production and respiratory rates in both lines, and pyruvate increased insulin secretion and respiration. EndoC-βH1 cells exhibited higher insulin secretion, while plasma membrane depolarization was attenuated, and neither glucose nor pyruvate induced oscillations in intracellular calcium concentration or plasma membrane potential. Metabolite profiling revealed that glycolytic and TCA-cycle intermediate levels increased in response to glucose in both cell lines, but responses were weaker in EndoC-βH1 cells, similar to those observed in human islets. Respiration in EndoC-βH1 cells was more similar to that in human islets than in INS-1 832/13 cells.

Conclusions/interpretation: Functions associated with early stimulus-secretion coupling, with the exception of plasma membrane potential and Ca2+ oscillations, were similar in the two cell lines; insulin secretion, respiration and metabolite responses were similar in EndoC-βH1 cells and human islets. While both cell lines are suitable in vitro models, with the caveat of replicating key findings in isolated islets, EndoC-βH1 cells have the advantage of carrying the human genome, allowing studies of human genetic variants, epigenetics and regulatory RNA molecules.


Conflict of interest statement

Competing Interests: The authors have declared that no competing interests exist.

Figures

Fig 1
Fig 1. Glucose-stimulated insulin secretion in EndoC-βH1, INS-1 832/13 cell lines and isolated human islets.
Basal (1 mM glucose) and glucose-stimulated (20 mM glucose) insulin secretion in EndoC-βH1 (A) and INS-1 832/13 cells (B) in the presence of 5 mM or 35 mM KCl. (C) Basal (2.8 mM glucose, white bar) and glucose-stimulated (16.7 mM glucose, black bar) insulin secretion in isolated human islets (n = 14 donors). (D) Insulin secretion after stimulation with 20 mM glucose (black bar) or 10 mM pyruvate (checkered bar) in both cell lines. (E) Total insulin content was evaluated as the sum of the intracellular and secreted insulin after basal (1 mM glucose, white bar) or glucose stimulated (20 mM glucose, black bar) insulin secretion for both cell lines. Data are expressed as mean ±S.E.M (n = 3, EndoC-βH1 and n = 4, INS-1 832/13). Differences within cell line were assessed by the paired Student’s t-test. *p<0.05, **p<0.01, ***p<0.001.
Fig 2
Fig 2. Metabolite levels after glucose stimulation in EndoC-βH1, INS-1 832/13 cells and isolated human islets.
Score scatter plots of the metabolite profiles for (A) EndoC-βH1 and (B) INS-1 832/13 cells upon glucose stimulation with 1 mM (white triangles) or 20 mM (black triangles) glucose. (C) A SUS-like plot revealing alterations in metabolite levels after glucose stimulation underlying the clustering observed in the score-scatter plots in two dimensions. Dashed lines indicate significance levels; metabolites on the top and right sides are significantly increased while those on the bottom and left side are significantly decreased according to the cell type on the x and y-axis. Hence, metabolites in the upper right and lower left quadrants are up- and down-regulated, respectively, in both cell lines. Metabolites found in the middle right and left quadrants are up- and down-regulated, respectively, only in the INS-1 832/13 cells and those in the upper and lower centered quadrants are increased and decreased, respectively, after glucose stimulation in EndoC-βH1 cells. Metabolites in the center of the plot are unchanged. (D) Levels of glycolytic and TCA-cycle intermediate metabolites in 20 mM glucose relative to 1 mM glucose in EndoC-βH1 (white bars) and INS-1 832/13 (black bars) cells. (E) Relative levels of metabolites in 16.7 mM glucose relative to 2.8 mM glucose in isolated human islets. Data are expressed as mean ±S.E.M (n = 6 for cell lines, n = 14 for donors). Differences within cell line were assessed by the paired Student’s t-test. *p<0.05, **p<0.01, ***p<0.001.
Fig 3
Fig 3. Respiration in EndoC-βH1, INS-1 832/13 cells and human islets.
Oxygen consumption rates relative to basal (1 mM glucose) OCR upon glucose stimulation (20 mM; A, C) or pyruvate stimulation (10 mM; B) in EndoC-βH1 cells (A, B; white symbols), INS-1 832/13 cells (A, B; black symbols) and human islets (C; grey symbols). Glucose- and pyruvate-stimulated respiratory response (D), proton leak (oligomycin-insensitive glucose-stimulated respiration) (E) and maximal mitochondrial respiration (F) each expressed as fold relative to basal. (G) Principal component analysis of respiratory parameters (EndoC-βH1—dashed line, INS-1 832/13—dotted line, human islets—solid line) (PCA: R2X = 0.896; R2Y = 0.684; A = 3). All calculations were done after subtracting non-mitochondrial respiration. Data are represented as mean ±S.E.M (n = 8 for glucose, n = 4 for pyruvate and n = 3 for human islets). Statistical analysis was done as described in methods. *p<0.05, **p<0.01, ***p<0.001.
Fig 4
Fig 4. Glucose utilization, lactate and ATP levels in EndoC-βH1 and INS-1 832/13 cells.
Glucose utilization (A) and extracellular lactate levels (B) in EndoC-βH1 cells in basal (1 mM glucose, white bars) and glucose-stimulated (20 mM glucose, black bars) conditions. Relative intracellular ATP levels (C) after glucose stimulation in EndoC-βH1 (white bars) and INS-1 832/13 (black bars) cells. Data are expressed as mean ±S.E.M (n = 3–6). Differences within cell line were assessed by a paired Student’s t-test. *p<0.05, **p<0.01, ***p<0.001.
Fig 5
Fig 5. Plasma membrane potential and cytoplasmic free Ca2+ changes in EndoC-βH1 and INS-1 832/13 cells.
Whole-field plasma membrane potential changes (A) in EndoC-βH1 (bold line) and INS-1 832/13 (thin line) cells. Additions: G, glucose, 16.7 mM; O, oligomycin, 0.5 ng/μL; K, KCl, 25 mM. Plasma membrane potential (thin line) and the free cytoplasmic Ca2+ (bold line) in (B) a single EndoC-βH1 cell and (C) a single INS-1 832/13 cell. (D) Representative single cell plasma membrane potential changes in response to pyruvate stimulation (P, 10 mM) in EndoC-βH1 (bold line) and INS-1 832/13 (thin line) cells. Data shown are representative for n = 3 experiments.

References

    1. International_Diabetes_Federation (2013) IDF Diabetes Atlas. 6th ed. Brussels.
    1. Maechler P, Wollheim CB. Mitochondrial function in normal and diabetic beta-cells. Nature. 2001;414: 807–812. - PubMed
    1. Tarasov A, Dusonchet J, Ashcroft F. Metabolic regulation of the pancreatic beta-cell ATP-sensitive K+ channel: a pas de deux. Diabetes. 2004;53 Suppl 3: S113–122. - PubMed
    1. Henquin JC. Regulation of insulin secretion: a matter of phase control and amplitude modulation. Diabetologia. 2009;52: 739–751. 10.1007/s00125-009-1314-y - DOI - PubMed
    1. Wiederkehr A, Wollheim CB. Mitochondrial signals drive insulin secretion in the pancreatic beta-cell. Mol Cell Endocrinol. 2012;353: 128–137. 10.1016/j.mce.2011.07.016 - DOI - PubMed

Publication types