. 2015 Mar 24;10(3):e0121128.
doi: 10.1371/journal.pone.0121128. eCollection 2015.

The nicotinic receptor Alpha7 impacts the mouse lung response to LPS through multiple mechanisms

Affiliations

The nicotinic receptor Alpha7 impacts the mouse lung response to LPS through multiple mechanisms

Elena Y Enioutina et al. PLoS One. .

Abstract

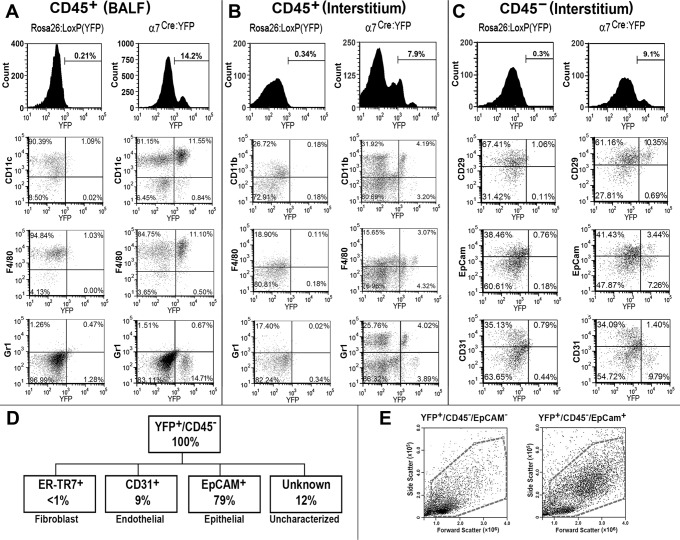
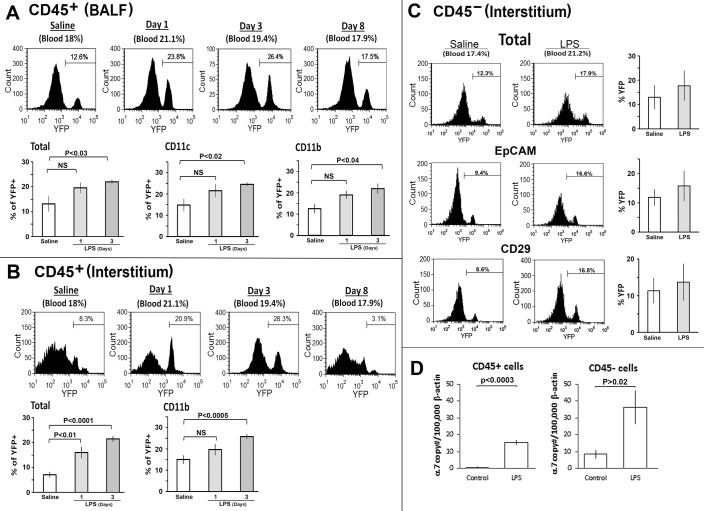
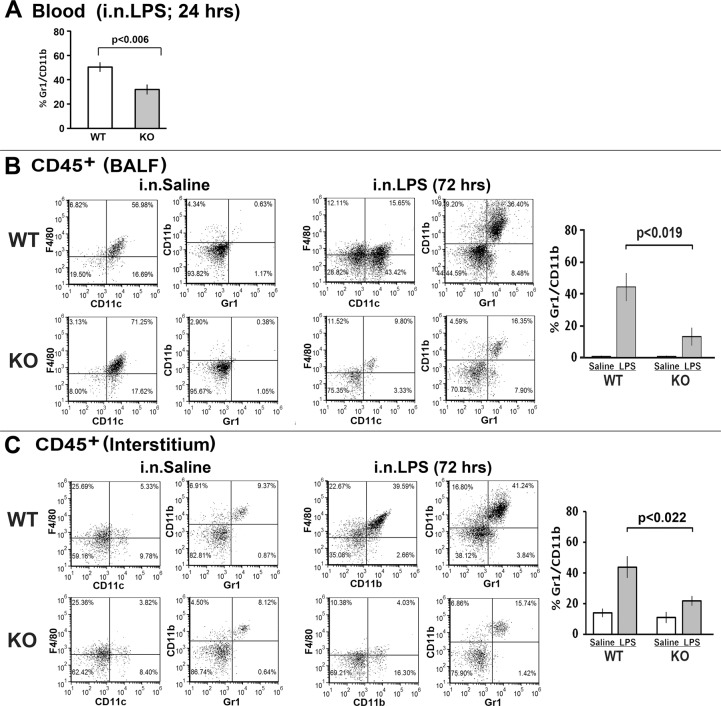
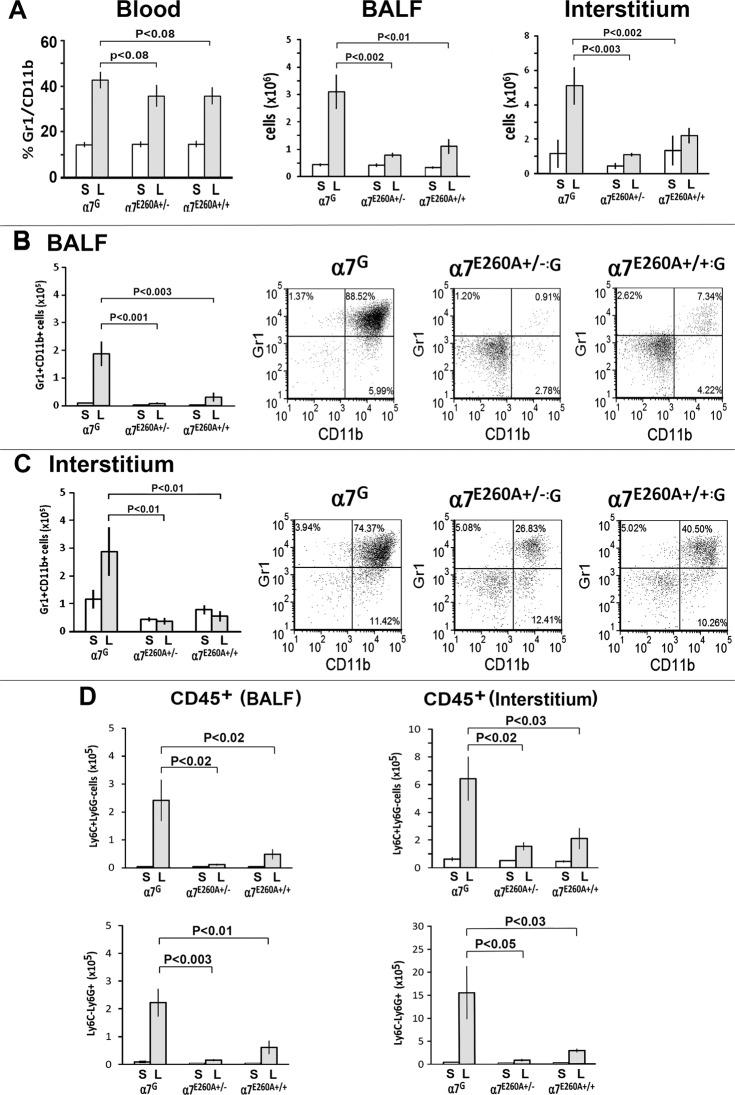
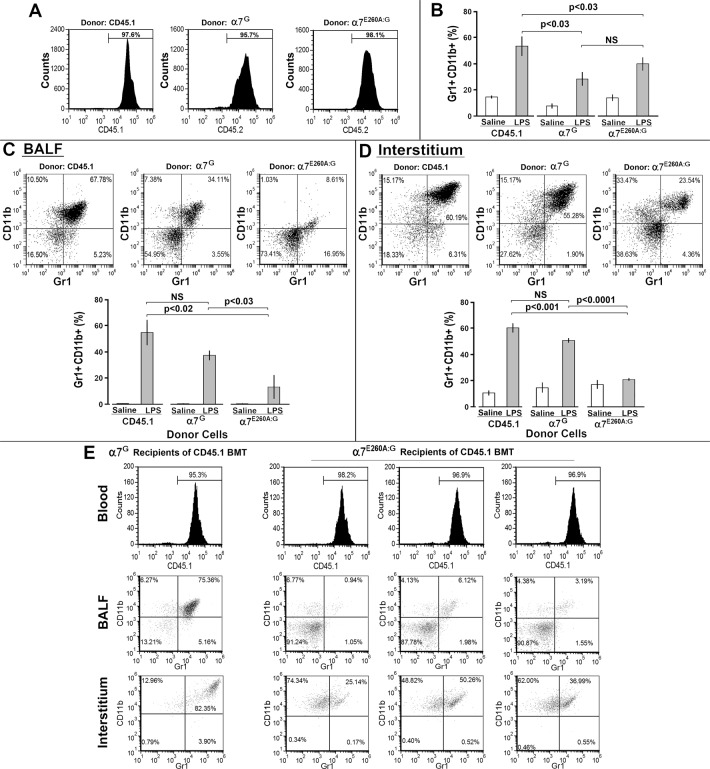
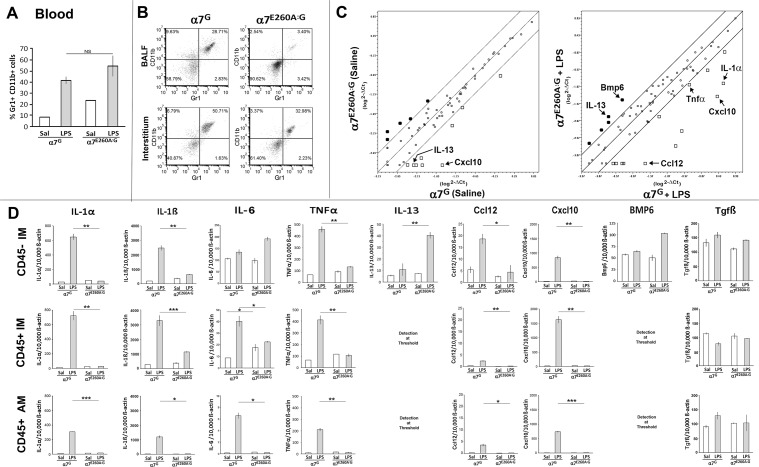
The nicotinic acetylcholine receptor alpha7 (α7) is expressed by neuronal and non-neuronal cells throughout the body. We examined the mechanisms of the lung inflammatory response to intranasal (i.n.) lipopolysaccharide (LPS) regulated by α7. This was done in mice using homologous recombination to introduce a point mutation in the α7 receptor that replaces the glutamate residue 260 that lines the pore with alanine (α7E260A), which has been implicated in controlling the exceptional calcium ion conductance of this receptor. The α7E260A mice exhibit normal inflammatory cell recruitment to the blood in response to i.n. LPS administration. This differs from the α7knock-out (α7KO) in which upstream signaling to initiate the recruitment to the blood following i.n. LPS is significantly impaired. While hematopoietic cells are recruited to the bloodstream in the α7E260A mouse, they fail to be recruited efficiently into both the interstitium and alveolar spaces of the lung. Bone marrow reconstitution experiments demonstrate that the responsiveness of both CD45+ and CD45- cells of the α7E260A mouse are impaired. The expression of several pro-inflammatory cytokine and chemokine RNAs including TNFα, IL-1α, Ccl2 and Cxcl10 are decreased in the α7E260A mouse. However, there is a substantial increase in IL-13 expression by CD45- lung interstitial cells in the α7E260A mouse. Our results support the conclusion that α7 functional pleiotropy contributes to modulating the tissue response to an inflammatory insult through impacting upon a variety of mechanisms reflecting the individual cell composition of the lung.


Conflict of interest statement

Competing Interests: The authors have declared that no competing interests exist.

Figures

Fig 1
Fig 1. Mouse α7 lineage-marked lung cells are both CD45+ and CD45-.
BALF cells were collected from groups of 3–5 mice (3–4 months old) naïve ROSA:YFP or α7Cre:YFP mice (3–4 mo old). BALF cells were pooled from each genotype and then blocked with anti-CD16/CD32 antibodies (FcRγ) to prevent non-specific binding. Cells were then stained with monoclonal antibodies directed against mouse CD45, CD11c, F480 (F4/80) or Gr1 and analyzed by FACS for these markers as well as YFP expression. (A) A representative experiment shows the percent of total CD45+ cells in the gates as indicated. (B, C) Following removal of BALF, the remaining lung tissue (Interstitium) was digested (see Methods) and the single cell suspensions blocked and stained for to group cells into the hematopoietic (CD45+; B) or non-hematopoietic (CD45-; C) lineages. Additional markers appropriate to the respective lineage were then used including those specific to CD45- interstitial cells (CD29, EpCam, and CD31) and again quantitated in terms of α7 lineage (YFP+ or YFP-). (D) The results of multiple measurements are summarized in in terms of the average percentage of α7 lineage (YFP+ or YFP-) CD45+ or the CD45- populations including markers of fibroblasts (ER-TR7), endothelial cells (CD45-, CD31+, EpCAM-) and epithelial cells (CD45-, EpCAM+, CD31-) cells. The majority of the CD45-YFP+ interstitial cells are EpCAM+ that identifies epithelial cells. Some cells (12%) were not identified by the markers examined. The mean of each measurement varies by approximately 5% between experiments. (E) Examination of the forward scatter (indicator of cell size) and side scatter (indicator of granularity) of the YFP+/CD45-/EpCAM- (left panel) and YFP+/CD45-/EpCAM+ cells establishes the difference in their respective morphology. Stained samples were analyzed by FACS using FCS Express software. In all cases each experiment was repeated at least 3 times with each experimental group consisting of 3–5 mice.
Fig 2
Fig 2. Phenotypic characteristics of BALF and interstitial cells from α7Cre:YFP mice challenged with i.n. LPS.
Mice expressing cells that are lineage marked for WT α7 expression (α7Cre:YFP, 3–5 mo, 3–5 mice per group) were challenged with i.n. LPS (250 μg/mouse in 30 μl of saline). Control mice received i.n. 30 μl of saline. With LPS administration i.n., the number of cells isolated from the BALF and interstitium (CD45+) increases 2 to 3 fold by 72 hrs. A minimum of twenty thousand events were collected for each sample. Histograms reflect the percent of α7lin+ (YFP+) cells that are present on the days noted. The bar graphs represent data combined from three independent experiments (3–5 mice per experimental group in these experiments) with error bars reflecting plus-minus the standard error of the mean. Significance levels were determined using the Student’s t-test and this reflects the summed results of from at least three independent experiments. (A) BALF cells were isolated, FcRγ-blocked and stained with anti-mouse CD45, CD11c, and CD11b antibodies. In these experiments BALF was collected at Days 1, 3 and 8 for comparison to the naïve (saline control) group. Quantitative results are shown for day 1 and 3, where day 3 was observed to be the optimal response to LPS. Note the selective increase in the α7lin+ (YFP+) cell percentage after LPS exposure. (B, C) Cells of the interstitium were isolated from the remaining lung tissues by enzymatic digestion and stained with anti-mouse CD45, CD11b, EpCAM, and CD29. Flow cytometric gating was on either CD45+ cells (B) or on CD45- cells (C). The increase in percentage of CD45- α7lin+ (YFP+) cell after LPS exposure in this time frame was less in comparison to the CD45+ population. (D) Interstitial lung CD45+ and CD45- cells were collected 72 hrs post-challenge with either i.n. saline or LPS using CD45 microbeads and autoMacs sorting. RNA was isolated from these populations (CD45+ or CD45-). In both populations an increase in α7 RNA was observed in response to LPS administration. Combined analysis of α7 gene transcripts from three independent experiments is shown. Data are presented as mean ± SEM.
Fig 3
Fig 3. The α7 knock-out (α7KO) mice do not elicit a normal lung inflammatory response upon i.n. challenge with LPS.
Mice (α7WT or α7KO) were i.n. challenged with LPS (250 μg/mouse in 30 μl Saline) or saline (30 μl per mouse). For all experiments the bar graphs on the right represent quantification of the results from three independent experiments (12 animals (4–5 mice per experimental group) total per α7WT or α7KO genotypes, respectively) with error bars representing the standard error of the mean (SEM). Statistical significance was determined with the Student’s t-test. (A) 24 hours post-challenge small samples of blood (50 μl) were collected and assessed for CD11b+Gr1+ cells. In terms of circulating cells in the blood, the α7KO exhibited an overall reduced number. To measure the lung, mice were sacrificed 3 days after LPS-challenge and BALF (B) and interstitial cells (C) were isolated and measured (see Fig. 2 and the Methods). The total number of cells isolated from the BALF of saline treated (i.n.) WT and α7KO mice was similar (360,000 from the WT mice and 320,000 from the α7KO mice). However, upon LPS challenge the number of cells isolated from WT BALF increases to an average of 740,000 cells/mouse in comparison to 450,000 cells from the BALF of the α7KO mouse (n = 4 mice per group). These cells were stained for CD45, F4/80, CD11c, CD11b and Gr1 markers and analyzed by FACS. Flow cytometry data for isolated interstitial cells was gated on CD45+ cells. In the interstitium, similar to the BALF, fewer CD45+ cells were obtained from the α7KO mouse (2.2 x 10⁶ cells from the WT versus 0.9 x 10⁶ cells from the α7KO). Virtually all cells in the BALF are CD45+.
Fig 4
Fig 4. The response of α7G, α7E260A:G heterozygote and α7E260A:G homozygote mice to i.n. LPS challenge.
Mice (α7G, heterozygote α7E260A+/-:G or homozygote α7E260A+/+:G) were challenged with i.n. LPS (250 μg/mouse in 30 μl Saline) or saline (30 μl per mouse). For all experiments the results are shown as scatter plots and quantitated with bar graphs reflecting the results of three independent experiments (4 to 5 mice per experimental group). Error bars represent standard error of the mean (SEM) and statistical significance was determined using the Student’s t-test. (A) a small sample of blood (50 μl) was collected 24 hours LPS post-challenge and assessed for CD11b+Gr1+ cells (left panel). On day 3 after challenge, mice were sacrificed and BALF and interstitial cells isolated as described above and in the Methods for determination of total number of nucleated cells (A, middle and right panels). (B) BALF cells and (C) interstitial CD45+ cells isolated at 72 hrs post-challenge from α7G, α7E260A+/-:G, α7E260A+/+:G. (D) BALF and interstitial CD45+ cells are shown and further identified by markers for monocyte/macrophages (Ly6C) and PMN (Ly6G).
Fig 5
Fig 5. The response of chimeric α7G/α7E260A:G mice to i.n. LPS.
(A) Bone marrow cells were isolated from either B6.SJL (CD45.1 allele), α7G (CD45.2 allele), or α7E260A:G (CD45.2 allele) mice. B6.SJL (CD45.1 allele) mice were lethally irradiated with a dose of 2 x 6Gy, and 5 x 10⁶ cells per mouse were injected retro-orbitally into these recipients. Blood samples at 12 weeks post reconstitution show that greater than 95% of the nucleated cells of the blood were of donor origin. (B) Thirteen weeks post-BMT mice were challenged with either i.n. saline or i.n. LPS as above and a blood sample was obtained at 24 hrs post-challenge. All engrafted mice responded to LPS as measured by an increase in Gr1+CD11b+ cells in the blood. (C) BALF was obtained at 72 hrs post LPS challenge by lavage of individual mice and stained for Gr1+CD11b+. The total number of cells isolated from the BALF of the recipient mice repopulated with CD45.1 donor BM challenged with LPS was 2.4 x 10⁶ cells and 2.1 x 10⁶ cells from recipients repopulated with the α7G donor BM, while the recipients of the α7E260A:G BM had only 0.7 x 10⁶ BALF cells following LPS challenge. Similarly, the number of CD45+ cells recruited to the interstitium of the CD45.1 and α7G mice was equivalent while the number of CD45.1 BM cells recruited to the interstitium of the α7E260A:G mice was reduced. The bar graphs represent the average response of the mice to LPS and significance calculated using the Student’s t-test. (D) Following removal of BALF, interstitial tissue cells were isolated and stained for flow cytometry. Bar graphs reflect the average population response as indicated. (E) Bone marrow cells were isolated from B6.SJL (CD45.1 allele) mice and injected into lethally irradiated α7G or α7E260A+/+:G mice (CD45.2 allele). At 12 weeks recipient mice were fully reconstituted with CD45.1 cells (Blood, top panel). At week 13, recipient mice were challenged with either i.n. saline or LPS and sacrificed at 72 hrs for isolation of BALF or interstitium. A representative response in the BALF and interstitium (gated on CD45.1 cells) of the α7G cellular response (CD45.1 donor cells transplanted into α7G recipient mice) is shown in the left column. The total number of BALF cells from α7G recipients of CD45.1 BM averaged 1.8 x 10⁶ cells/mouse following LPS challenge while the BALF of α7E260A:G recipients of CD45.1 cells contained significantly less (0.5 x 10⁶ cells/mouse). CD45+ interstitial cell numbers also reflected this difference in total number of recruited cells with significantly fewer CD45.1 cells recruited to the lungs of the α7E260A:G recipients (2.3 x 10⁶ versus 1.5 x 10⁶, respectively). The LPS response of the CD45.1 recipients of α7E260A:G BM is shown for 3 individual mice (right panels).
Fig 6
Fig 6. Gene expression analysis of lung cells from α7G or α7E260A+/+:G mice.
Mice were i.n. challenged with either saline or LPS and harvested 18–20 hrs later. (A) Blood was collected at 18 hrs post-saline or LPS challenge to determine the number of Gr1+CD11b+ cells present. Error bars reflect +/- SEM. NS is non-significant as determined by the Student’s t-test. (B) BALF cells were isolated following lung lavage and interstitial cells were obtained from the digested lung tissue. A sample of these cells preparations were analyzed by flow cytometry for the presence of Gr1+CD11b+ cells. Note the substantial decrease in response in the α7E260A:G double-positive cell populations compared to the control. (C) RNA was isolated from the remaining cells in these groups and tested for cytokine and chemokine transcripts using a SABioscience gene array kit (see Methods). The boundary lines shown indicate a difference of 4-fold in transcript number. Some points are identified are indicated. (D) In separately performed experiments the changes in RNA expression as indicated in (C) were confirmed using specific real-time PCR primer analysis (taqMan probes; see Methods). Results are presented as transcripts per 10,000 beta-actin transcripts. *p < 0.05, **p < 0.01, *** p < 0.001.

References

    1. Wang H, Yu M, Ochani M, Amella CA, Tanovic M, Susarla S, et al. (2003) Nicotinic acetylcholine receptor alpha7 subunit is an essential regulator of inflammation. Nature 421: 384–388. - PubMed
    1. Gahring LC, Rogers SW (2005) Neuronal nicotinic acetylcholine receptor expression and function on nonneuronal cells. Aaps J 7: E885–894. - PMC - PubMed
    1. Pavlov VA, Tracey KJ (2005) The cholinergic anti-inflammatory pathway. Brain Behav Immun 19: 493–499. - PubMed
    1. Rosas-Ballina M, Tracey KJ (2009) Cholinergic control of inflammation. J Intern Med 265: 663–679. 10.1111/j.1365-2796.2009.02098.x - DOI - PMC - PubMed
    1. Albuquerque EX, Pereira EF, Alkondon M, Rogers SW (2009) Mammalian nicotinic acetylcholine receptors: from structure to function. Physiol Rev 89: 73–120. 10.1152/physrev.00015.2008 - DOI - PMC - PubMed

Publication types

MeSH terms