

Temporal Changes in the Influence of Hospitals and Regional Healthcare Networks on Severe Sepsis Mortality
- PMID: 25803652
- PMCID: PMC4470811
- DOI: 10.1097/CCM.0000000000000970
Temporal Changes in the Influence of Hospitals and Regional Healthcare Networks on Severe Sepsis Mortality
Abstract
Objectives: There is systematic variation between hospitals in their care of severe sepsis, but little information on whether this variation impacts sepsis-related mortality, or how hospitals' and health-systems' impacts have changed over time. We examined whether hospital and regional organization of severe sepsis care is associated with meaningful differences in 30-day mortality in a large integrated health care system, and the extent to which those effects are stable over time.
Design: In this retrospective cohort study, we used risk- and reliability-adjusted hierarchical logistic regression to estimate hospital- and region-level random effects after controlling for severity of illness using a rich mix of administrative and clinical laboratory data.
Setting: One hundred fourteen U.S. Department of Veterans Affairs hospitals in 21 geographic regions.
Patients: Forty-three thousand seven hundred thirty-three patients with severe sepsis in 2012, compared to 33,095 such patients in 2008.
Interventions: None.
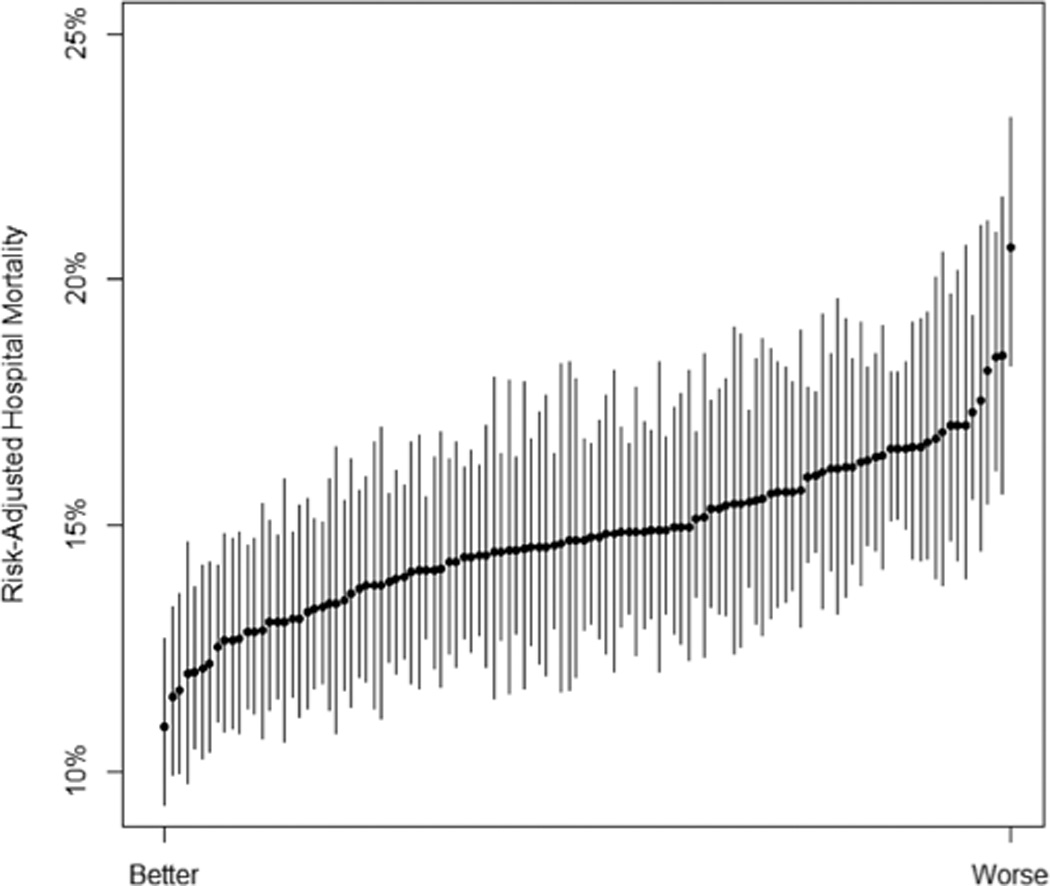
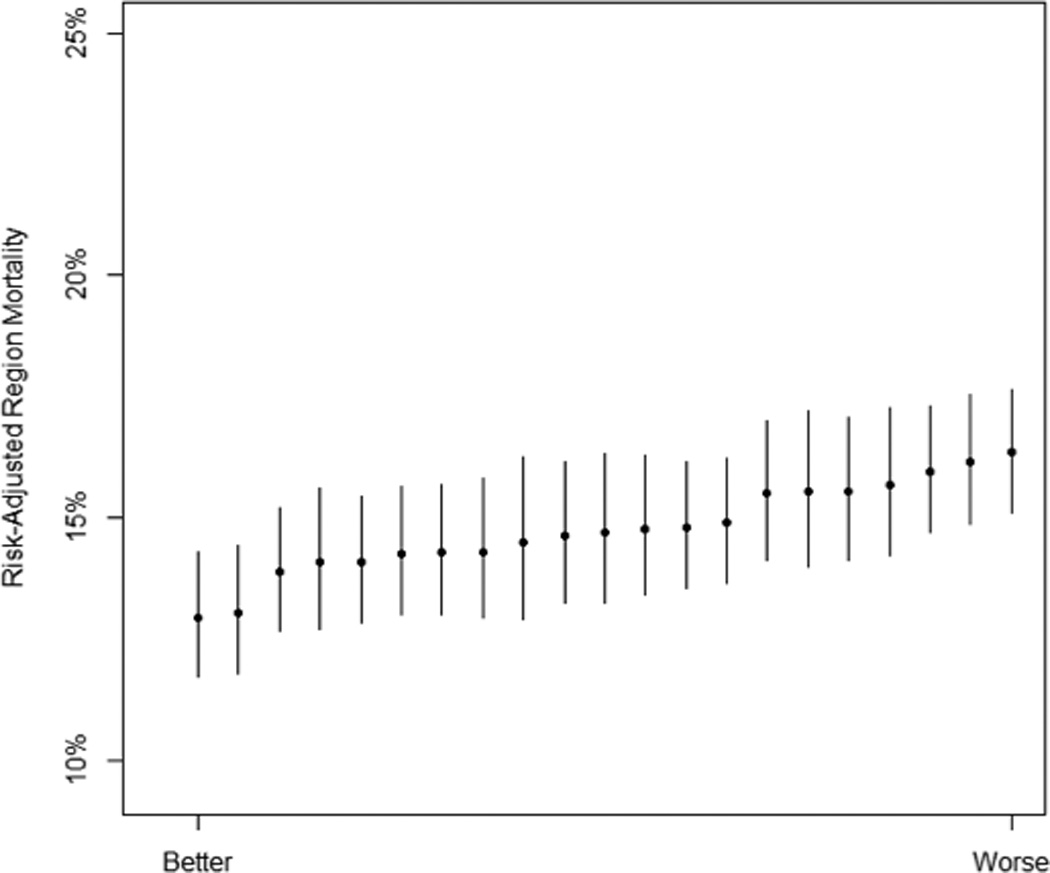
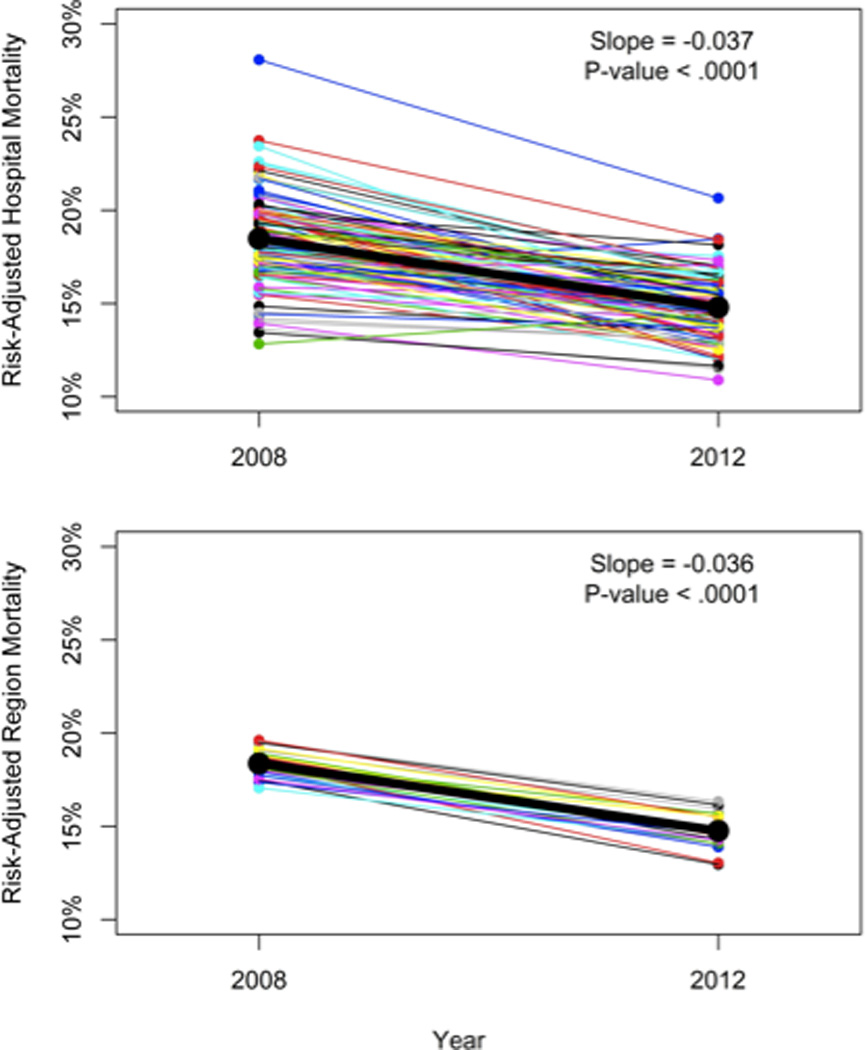
Measurements and main results: The median hospital in the worst quintile of performers had a risk-adjusted 30-day mortality of 16.7% (95% CI, 13.5%, 20.5%) in 2012 compared with the best quintile, which had a risk-adjusted mortality of 12.8% (95% CI, 10.7%, 15.3%). Hospitals and regions explained a statistically and clinically significant proportion of the variation in patient outcomes. Thirty-day mortality after severe sepsis declined from 18.3% in 2008 to 14.7% in 2012 despite very similar severity of illness between years. The proportion of the variance in sepsis-related mortality explained by hospitals and regions was stable between 2008 and 2012.
Conclusions: In this large integrated healthcare system, there is clinically significant variation in sepsis-related mortality associated with hospitals and regions. The proportion of variance explained by hospitals and regions has been stable over time, although sepsis-related mortality has declined.
Conflict of interest statement
Figures
Comment in
-
Variability in Risk-Adjusted Sepsis Mortality: How Much Is Too Much?Crit Care Med. 2015 Jul;43(7):1530-1. doi: 10.1097/CCM.0000000000001027. Crit Care Med. 2015. PMID: 26079229 No abstract available.
References
-
- Angus DC, Linde-Zwirble WT, Lidicker J, Clermont G, Carcillo J, Pinsky MR. Epidemiology of severe sepsis in the United States: analysis of incidence, outcome, and associated costs of care. Crit. Care Med. 2001 Jul;29(7):1303–1310. - PubMed
-
- Padkin A, Goldfrad C, Brady AR, Young D, Black N, Rowan K. Epidemiology of severe sepsis occurring in the first 24 hrs in intensive care units in England, Wales, and Northern Ireland. Crit. Care Med. 2003 Sep;31(9):2332–2338. - PubMed
-
- Kaukonen KM, Bailey M, Suzuki S, Pilcher D, Bellomo R. Mortality related to severe sepsis and septic shock among critically ill patients in Australia and New Zealand, 2000–2012. JAMA. 2014 Apr 2;311(13):1308–1316. - PubMed
-
- Torio CM(AHRQ), Andrews RM(AHRQ) National Inpatient Hospital Costs: The Most Expensive Conditions by Payer, 2011. HCUP Statistical Brief #160. Rockville, MD: Agency for Healthcare Research and Quality; 2013. Aug, [Accessed August 19, 2014]. http://www.hcup-us.ahrq.gov/reports/statbriefs/sb160.pdf. - PubMed
Publication types
MeSH terms
Grants and funding
LinkOut - more resources
Full Text Sources
Other Literature Sources
Medical
