. 2015 Mar 24;11(3):e1005062.
doi: 10.1371/journal.pgen.1005062. eCollection 2015 Mar.

Opposite phenotypes of muscle strength and locomotor function in mouse models of partial trisomy and monosomy 21 for the proximal Hspa13-App region

Affiliations

Opposite phenotypes of muscle strength and locomotor function in mouse models of partial trisomy and monosomy 21 for the proximal Hspa13-App region

Véronique Brault et al. PLoS Genet. .

Abstract

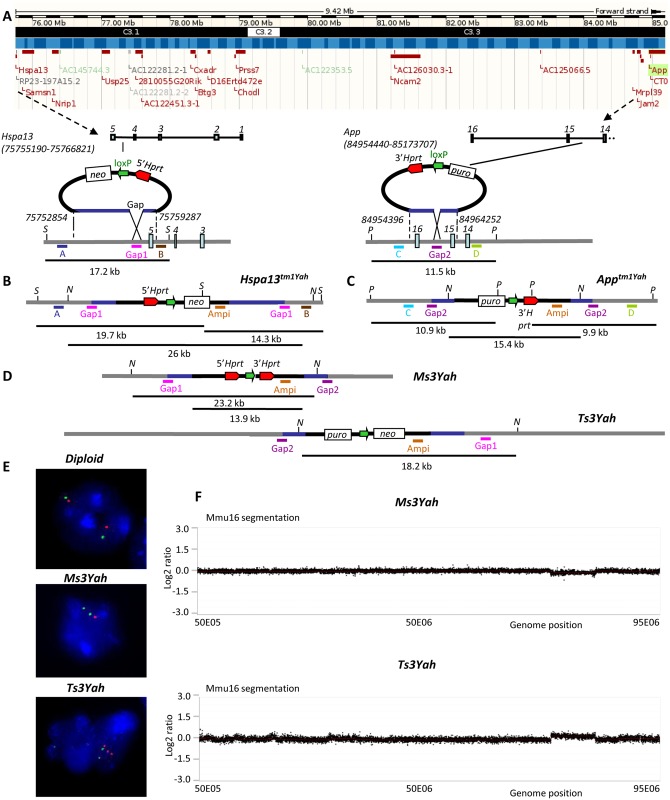
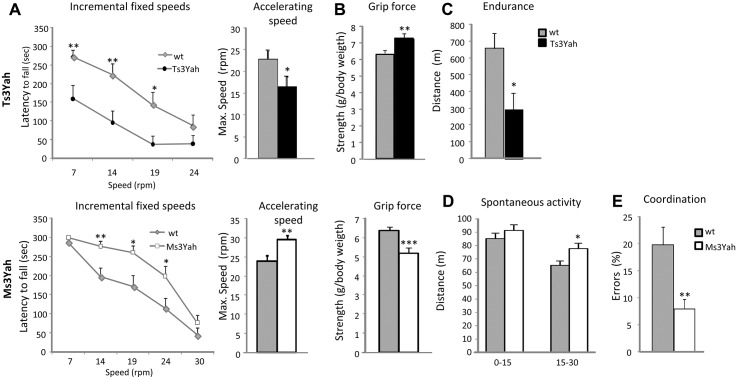
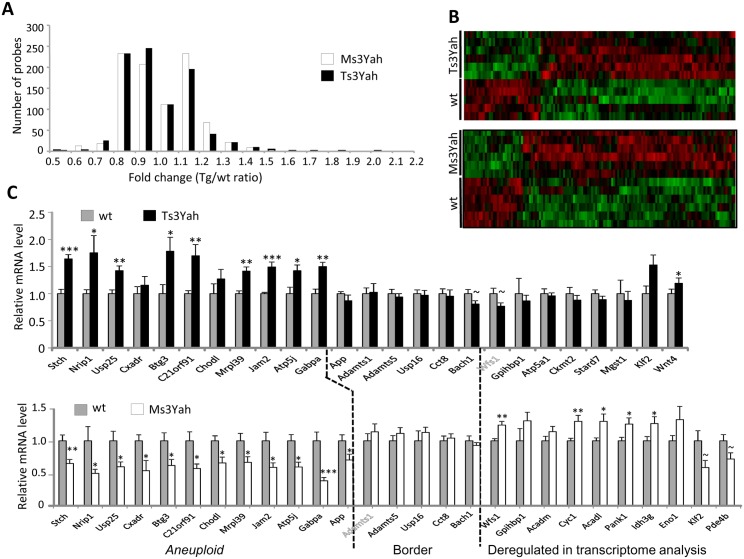
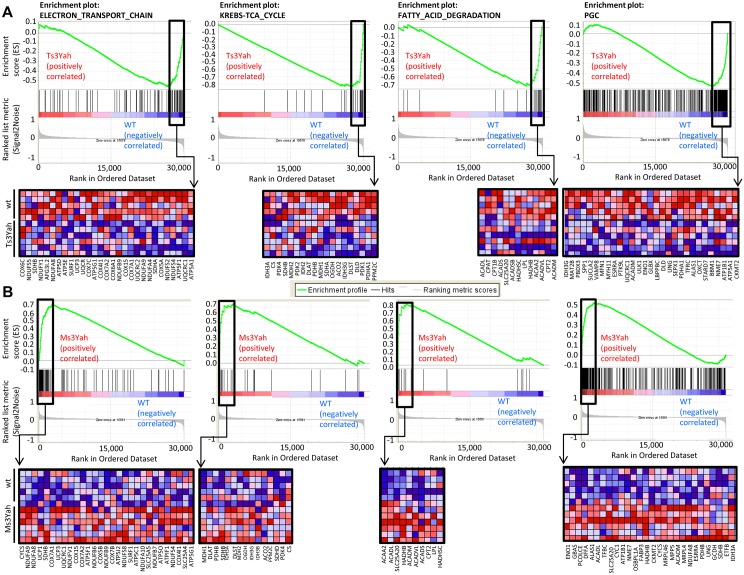
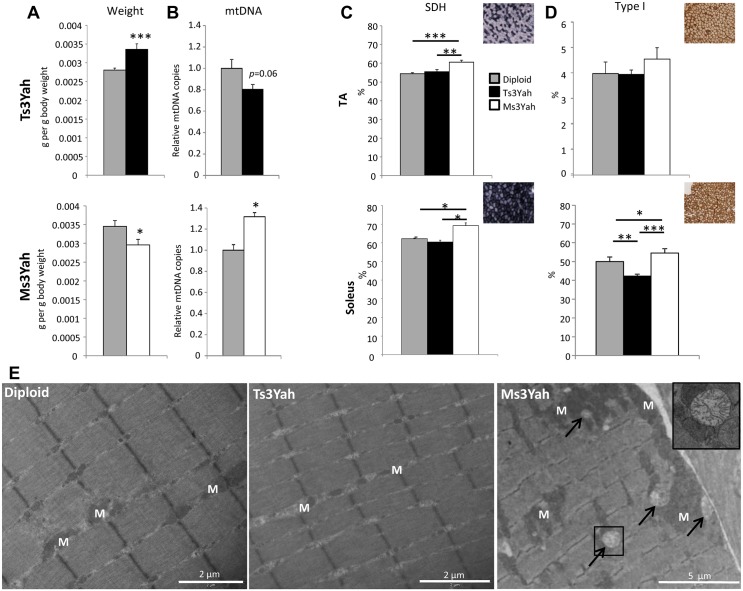
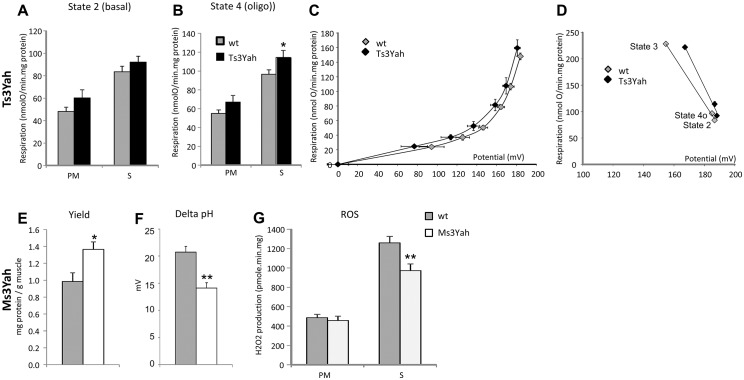
The trisomy of human chromosome 21 (Hsa21), which causes Down syndrome (DS), is the most common viable human aneuploidy. In contrast to trisomy, the complete monosomy (M21) of Hsa21 is lethal, and only partial monosomy or mosaic monosomy of Hsa21 is seen. Both conditions lead to variable physiological abnormalities with constant intellectual disability, locomotor deficits, and altered muscle tone. To search for dosage-sensitive genes involved in DS and M21 phenotypes, we created two new mouse models: the Ts3Yah carrying a tandem duplication and the Ms3Yah carrying a deletion of the Hspa13-App interval syntenic with 21q11.2-q21.3. Here we report that the trisomy and the monosomy of this region alter locomotion, muscle strength, mass, and energetic balance. The expression profiling of skeletal muscles revealed global changes in the regulation of genes implicated in energetic metabolism, mitochondrial activity, and biogenesis. These genes are downregulated in Ts3Yah mice and upregulated in Ms3Yah mice. The shift in skeletal muscle metabolism correlates with a change in mitochondrial proliferation without an alteration in the respiratory function. However, the reactive oxygen species (ROS) production from mitochondrial complex I decreased in Ms3Yah mice, while the membrane permeability of Ts3Yah mitochondria slightly increased. Thus, we demonstrated how the Hspa13-App interval controls metabolic and mitochondrial phenotypes in muscles certainly as a consequence of change in dose of Gabpa, Nrip1, and Atp5j. Our results indicate that the copy number variation in the Hspa13-App region has a peripheral impact on locomotor activity by altering muscle function.


Conflict of interest statement

The authors have declared that no competing interests exist.

Figures

Fig 1
Fig 1. Generating a 9.2 Mb deletion and reciprocal tandem duplication between the Hspa13 and App loci.
(A) The 9.2 Mb targeted region defined by the Hspa13 and App genes as shown from a capture derived from the UCSC genome browser (http://genome.ucsc.edu/). Black headband: chromosomes bands; blue headband: contigs; red rectangle boxes: protein coding genes. (B) The targeting vectors containing a loxP site (green arrow), a selectable antibiotic resistance gene (puro or neo), and a part of the Hprt gene (3’ or 5’ Hprt, red arrows) were integrated successively in the Hspa13 locus (Hspa13tm1Yah) and in the App gene (Apptm1Yah). The start and end positions of the genomic homologous regions present in the 5’ and 3’-Hprt vectors are from mouse genome assembly GRm38. The Stchtm1Yah allele was checked by Southern blot analysis. The digestion of DNA with SacI (S) restriction enzyme and hybridisation with external probes A and B gives additional fragments of 19.7 kb and 14.3 kb, respectively, for the Stchtm1Yah allele compared to the wild-type (wt) allele of 17.2 kb. The hybridisation of the same DNA digest with the Gap1 probe gives two additional fragments of 19.7 and 14.3 kb for the Hspa13tm1Yah. (C) The integration of the 3’Hprt vector was confirmed in the same manner by digestion with the PsiI (P) enzyme and hybridisation with probes C (wt, 11.5 kb; Apptm1Yah allele, 10.9 kb), D (wt, 11.5 kb; Apptm1Yah allele, 9.9 kb), and Gap2 (wt, 11.5 kb; Apptm1Yah allele, 10.9 and 9.9 kb). (D) After Cre-mediated recombination, the deletion (Ms3Yah allele) and duplication (Ts3Yah allele) were identified by NdeI (N) digestion, and a probe was made on the ampicillin gene (Ampi) present in both targeting vectors that recognises recombinant clones with the Ms3Yah (23.2 kb) and Ts3Yah (18.2 kb) alleles from nonrecombinant ones that still carry the Hspa13tm1Yah (26 kb) and Apptm1Yah (15.4 kb) alleles. Puro: puromycin, neo: neomycin. (E) Interphase FISH analysis with BAC probes that map in the region of the deletion or duplication (BAC bMQ-34K13; red) and outside (BAC bMQ-381L17; green). The wild-type (diploid) showed two red and two green adjacent signals. On the other hand, nuclei from Ms3Yah showed two green and only one red signal due to the deletion of the Hspa13-App region, and nuclei from Ts3Yah showed two green and three red signals. (F) The CGH profile of Mmu16 was established using NimbleGen mouse HD2 whole genome CGH oligonucleotide arrays comprising 2,100,000 isothermal probes 50–75 bp length, with a median spacing of 1.1 kb throughout the genome (UCSC NCBI37/mm9/July 2007 assembly) enabling high-resolution CNV detection. It confirmed the loss of one copy of the Hspa13-App fragment in Ms3Yah mice and the presence of an additional copy of the same fragment in Ts3Yah animals. Plotted are log 2 transformed hybridisation ratios of Ms3Yah and Ts3Yah versus diploid mouse DNA.
Fig 2
Fig 2. Evaluation of motor skills.
(A) The motor skill performances of Ts3Yah mice, Ms3Yah mice, and their diploid controls (n = 10–15 per genotype) were analysed using two rotarod tests. The first test consisted of four consecutive trials of 5 minutes at constant speed and reported as the mean ± sem of the time that mice remained on the rod (repeated ANOVA ‘genotype,’ ‘speed’: Ts3Yah vs diploid: F[1, 69] = 10.042 p = 0.004; Ms3Yah vs diploid: F[1, 87] = 8.809 p = 0.006). This test was followed by another test involving two trials at accelerating speed (4–40 rpm) for 5 minutes and the calculated mean rotational velocity at the time of falling for the two trials and each group. (B) Grip force, immediately prior to the animal releasing its grasp from the grid, was measured in grams and normalised to the weight of the animal. (C) The endurance of Ts3Yah and Ms3Yah mice to exercise was measured as the maximal running distance travelled on a treadmill until exhaustion. (D) Spontaneous locomotor activity and habituation were assessed in an open field by measuring the distance travelled during the first 15 minutes and the last 15 minutes of a 30-minute session. (E) Motor coordination skills were tested with a notched bar by looking at the percentage of errors made by the mouse with its hind paws when crossing the notched bar. Data are presented as mean ± sem and analysed with Student’s t-test, *p<0.05, **p<0.01, ***p<0.001.
Fig 3
Fig 3. Gene expression profile of skeletal muscles from Ts3Yah and Ms3Yah transgenic mice.
(A) Distribution of the deregulated genes depending on their fold change. (B) Clustering derived from statistically deregulated genes (Student’s t-test, p<0.05) with FC >|1.2| in Ts3Yah compared to their diploid control littermates and in Ms3Yah compared to their diploid control littermates. The red and green colours indicate relative expression levels (red: increased expression; green: decreased expression). (C) Quantitative PCR analysis of genes within the Hspa13-App trisomic or monosomic region (aneuploid), bordering the Hspa13-App region and selected for their significant deregulation within the transcriptome. Data are presented as mean ± sem and analysed with Student’s t-test, ~p<0.1, *p<0.05, **p<0.01.
Fig 4
Fig 4. Pathways related to energy metabolism are underexpressed in Ts3Yah skeletal muscles and overexpressed in Ms3Yah skeletal muscles.
GSEA-scoring plots of gene expression profile in gastrocnemius muscles from Ts3Yah (A) and Ms3Yah (B) mice. Four plots of representative gene sets relevant to metabolic pathways that were significantly enriched and the ‘PGC’ gene set corresponding to genes involved in OXPHOS that were activated by PGC1-α are shown. The top part of each plot shows the running enrichment score for the gene set as the analysis goes down the ranked list. The middle portion shows the position of members of the gene set in the ranked list of genes. The lower portion plots the value of the ranking metric of the genes in the expression data set. Below the enrichment plots, the corresponding heat maps show the leading edge subsets of genes that contribute most to the enrichment score. The red and blue colours indicate relative expression levels (red: increased expression; blue: decreased expression).
Fig 5
Fig 5. Histological analyses of skeletal muscles.
(A) Mass of gastrocnemius muscles reported to body weight of the mice (n = 10–15 per group). (B) Quantification of the mitochondrial copy number in the gastrocnemius muscles of Ts3Yah and Ms3Yah mice relative to their diploid controls. The levels of mtDNA were normalised to levels of nucleus-encoded DNA (n = 5 per group). (C) Transverse sections of TA and soleus muscle were stained for SDH activity and SDH+ fibres counted in the entire sections. Results are given as percentages of stained fibres (n = 5–7 per group). (D) Changes in the proportion of type I slow-twitch fibres in TA and soleus of Ts3Yah and Ms3Yah mice using MyHC immunohistological staining (n = 5–7 per group). Data are presented as mean ± sem. Student’s t-test (A and B) and ANOVA with all pairwise multiple comparison procedures (Holm-Sidak method) (C and D), ~p<0.1, *p<0.05, **p<0.01, ***p<0.001. (E) Transmission electron microscope (TEM) analysis of TA muscles. The arrows are pointing at degenerative mitochondria. The cropped image is shown with 2.5x magnification of the original image. M: mitochondrion. Scale bars are 2 μm for the two first panels and 6 μm for the last.
Fig 6
Fig 6. Evaluation of mitochondrial function.
Mitochondria were isolated from hind limb muscle to test their respiration capacities. (A) Yield of mitochondrial protein per gram of muscle obtained from the mitochondrial extraction. (B–D) The rates of oxygen consumptions were measured in isolated muscle mitochondria in the presence of pyruvate/malate (PM) or succinate (S) as described in Materials and Methods. (B) State 2, basal was measured in the presence of substrates only. (C) State 3, ADP-stimulated respiration was measured with the addition of 500 μM ADP. (D) State 4o, after addition of oligomycin. (E) COX activity was given by measuring mitochondrial oxygen consumption during PM respiration with the addition of 10 mM antimycin, 2 mM ascorbate, and 0.5 mM TMPD. (F) Basal proton leak was visualised by plotting the rate of oxygen consumed against mitochondrial membrane potential. (G) Kinetic response of substrate oxidation activity to membrane potential at states 3, 2, and 4o in Ts3Yah and diploid isolated mitochondria. Data are presented as mean ± sem (n = 5–6 per genotype) with Student’s t-test (A and G) and two-way ANOVA with all pairwise multiple comparison procedures (Holm-Sidak method) (D), *p<0.05, **p<0.01.

References

    1. Joosten AMS, DeVos S, VanOpstal D, Brandenburg H, Gaillard JLJ, VermeijKeers C. Full monosomy 21, prenatally diagnosed by fluorescent in situ hybridization. Prenatal Diagnosis. 1997;17(3):271–5. 10.1002/(sici)1097-0223(199703)17:3<271::aid-pd51>3.0.co;2-p - DOI - PubMed
    1. Kulharya AS, Tonk VS, Lovell C, Flannery DB. Complete Monosomy 21 Confirmed by FISH and Array-CGH. American Journal of Medical Genetics Part A. 2012;158A(4):935–7. 10.1002/ajmg.a.35251 - DOI - PubMed
    1. Manolakos E, Peitsidis P, Eleftheriades M, Dedoulis E, Ziegler M, Orru S, et al. Prenatal detection of full monosomy 21 in a fetus with increased nuchal translucency: Molecular cytogenetic analysis and review of the literature. Journal of Obstetrics and Gynaecology Research. 2010;36(2):435–40. 10.1111/j.1447-0756.2009.01140.x - DOI - PubMed
    1. Mori MA, Lapunzina P, Delicado A, Nunez G, Rodriguez JI, de Torres ML, et al. A prenatally diagnosed patient with full monosomy 21: Ultrasound, cytogenetic, clinical, molecular, and necropsy findings. American Journal of Medical Genetics Part A. 2004;127A(1):69–73. 10.1002/ajmg.a.20622 - DOI - PubMed
    1. Fisher D, DiPietro A, Murdison KA, Lemieux CA. Full Monosomy 21: Echocardiographic Findings in the Third Molecularly Confirmed Case. Pediatric Cardiology. 2013;34(3):733–5. 10.1007/s00246-012-0334-4 - DOI - PubMed

Publication types

MeSH terms

Substances

Supplementary concepts

Associated data