. 2016;19(2):208-16.
doi: 10.1080/10255842.2015.1006209. Epub 2015 Mar 25.

QCT/FEA predictions of femoral stiffness are strongly affected by boundary condition modeling

Affiliations

QCT/FEA predictions of femoral stiffness are strongly affected by boundary condition modeling

Timothy Rossman et al. Comput Methods Biomech Biomed Engin. 2016.

Abstract

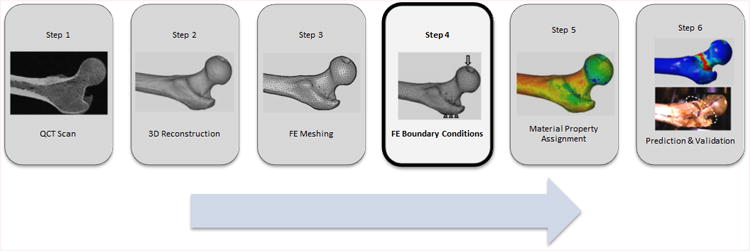
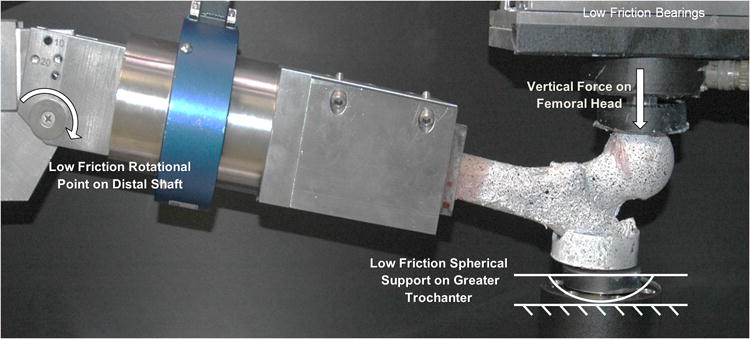
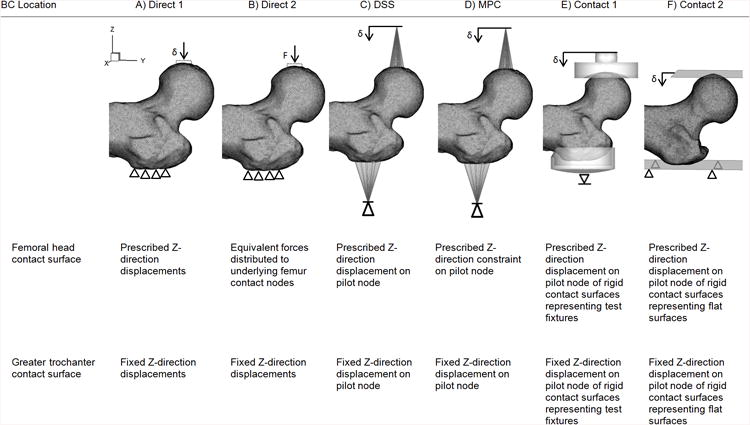
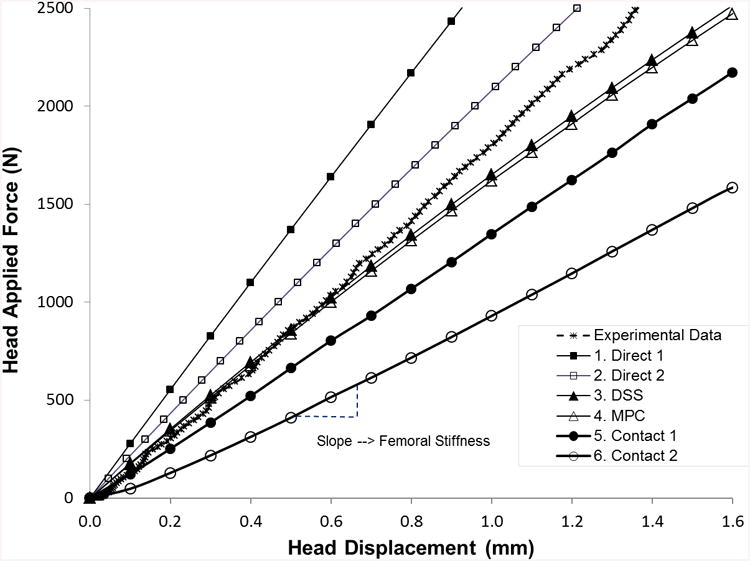
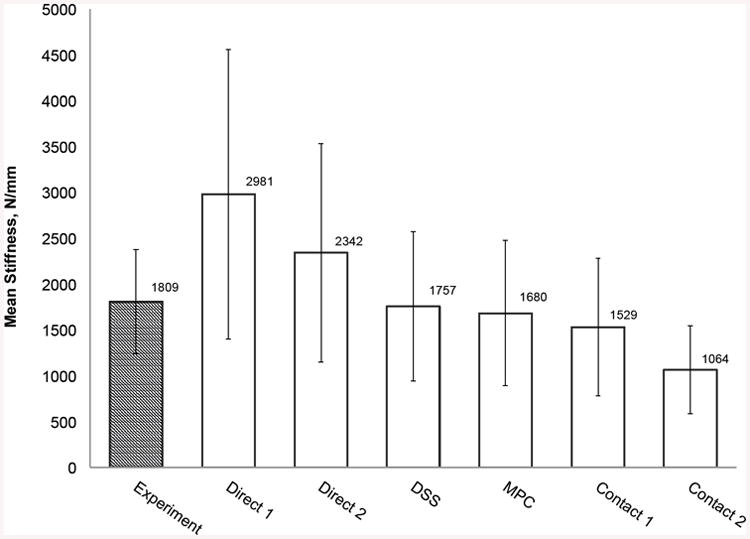
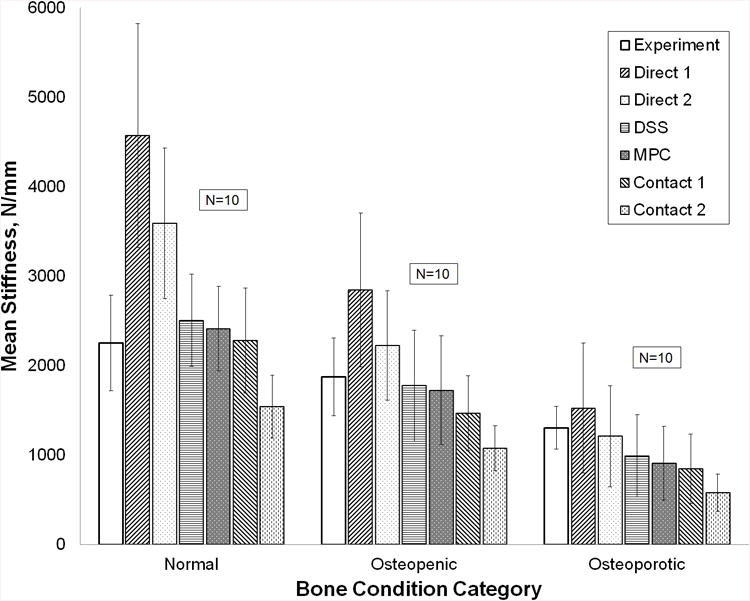
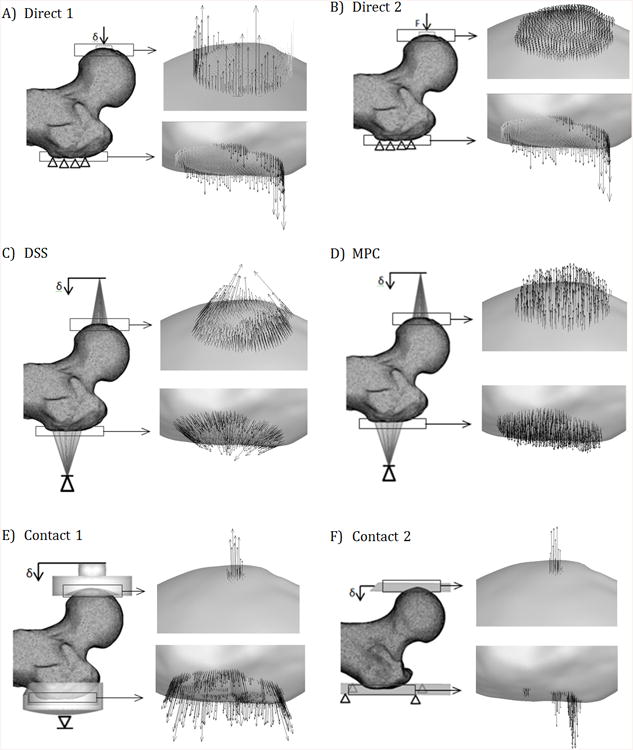
Quantitative computed tomography-based finite element models of proximal femora must be validated with cadaveric experiments before using them to assess fracture risk in osteoporotic patients. During validation, it is essential to carefully assess whether the boundary condition (BC) modeling matches the experimental conditions. This study evaluated proximal femur stiffness results predicted by six different BC methods on a sample of 30 cadaveric femora and compared the predictions with experimental data. The average stiffness varied by 280% among the six BCs. Compared with experimental data, the predictions ranged from overestimating the average stiffness by 65% to underestimating it by 41%. In addition, we found that the BC that distributed the load to the contact surfaces similar to the expected contact mechanics predictions had the best agreement with experimental stiffness. We concluded that BC modeling introduced large variations in proximal femora stiffness predictions.

Keywords: hip fracture; osteoporosis; quantitative computed tomography.


Conflict of interest statement

Conflict of interest statement: None of the authors have conflicts of interest to disclose.

Figures

Figure 1
Figure 1
QCT/FEA process flow chart.
Figure 2
Figure 2
Experimental boundary conditions.
Figure 3
Figure 3
FEA BC models. Note: The fixture representations for Contact 1 and 2 are transparent and do not penetrate the bone.
Figure 4
Figure 4
(a) Force-displacement experimental force and FEA calculated response curves for all six boundary condition models of a representative femur. (b) Summary statistics for experimentally measured stiffness and QCT/FEA predictions of stiffness for all six boundary condition models (N=30 femora). (c) Mean stiffness and standard deviation for each bone condition category (N=10 in each category).
Figure 4
Figure 4
(a) Force-displacement experimental force and FEA calculated response curves for all six boundary condition models of a representative femur. (b) Summary statistics for experimentally measured stiffness and QCT/FEA predictions of stiffness for all six boundary condition models (N=30 femora). (c) Mean stiffness and standard deviation for each bone condition category (N=10 in each category).
Figure 5
Figure 5
Typical QCT/FEA reaction force distributions at a femoral head displacement of 1 mm. Black arrows represent compressive forces acting toward the test fixture; grey arrows (only present in a and b) represent unphysical tensile forces acting away from fixtures.

References

    1. ANSYS. Mechanical APDL Contact Technology Guide. Chapter 9. SAS IP, Inc.; 2011. ANSYS 14.0 Help Module.
    1. Budynas RG. Advanced Strength and Applied Stress Analysis. McGraw-Hill Education; 1999.
    1. Cody DD, Gross GJ, et al. Femoral strength is better predicted by finite element models than QCT and DXA. Journal of Biomechanics. 1999;32(10):1013–1020. - PubMed
    1. Cong A, Op Den Buijs J, et al. In situ parameter identification of optimal density-elastic modulus relationships in subject-specific finite element models of the proximal femur. Medical Engineering & Physics. 2011;33(2):164–173. - PMC - PubMed
    1. Dall'Ara E, Luisier B, et al. A nonlinear QCT-based finite element model validation study for the human femur tested in two configurations in vitro. Bone. 2013;52(1):27–38. - PubMed

Publication types