Observational Study
. 2015 Oct;26(10):2545-58.
doi: 10.1681/ASN.2014070640. Epub 2015 Mar 24.

Anti-Phospholipase A2 Receptor Antibody Titer Predicts Post-Rituximab Outcome of Membranous Nephropathy

Affiliations
Observational Study

Anti-Phospholipase A2 Receptor Antibody Titer Predicts Post-Rituximab Outcome of Membranous Nephropathy

Piero Ruggenenti et al. J Am Soc Nephrol. 2015 Oct.

Abstract

Rituximab induces nephrotic syndrome (NS) remission in two-thirds of patients with primary membranous nephropathy (MN), even after other treatments have failed. To assess the relationships among treatment effect, circulating nephritogenic anti-phospholipase A2 receptor (anti-PLA2R) autoantibodies and genetic polymorphisms predisposing to antibody production we serially monitored 24-hour proteinuria and antibody titer in patients with primary MN and long-lasting NS consenting to rituximab (375 mg/m(2)) therapy and genetic analyses. Over a median (range) follow-up of 30.8 (6.0-145.4) months, 84 of 132 rituximab-treated patients achieved complete or partial NS remission (primary end point), and 25 relapsed after remission. Outcomes of patients with or without detectable anti-PLA2R antibodies at baseline were similar. Among the 81 patients with antibodies, lower anti-PLA2R antibody titer at baseline (P=0.001) and full antibody depletion 6 months post-rituximab (hazard ratio [HR], 7.90; 95% confidence interval [95% CI], 2.54 to 24.60; P<0.001) strongly predicted remission. All 25 complete remissions were preceded by complete anti-PLA2R antibody depletion. On average, 50% anti-PLA2R titer reduction preceded equivalent proteinuria reduction by 10 months. Re-emergence of circulating antibodies predicted disease relapse (HR, 6.54; 95% CI, 1.57 to 27.40; P=0.01), whereas initial complete remission protected from the event (HR, 6.63; 95% CI, 2.37 to 18.53; P<0.001). Eighteen patients achieved persistent antibody depletion and complete remission and never relapsed. Outcome was independent of PLA2R1 and HLA-DQA1 polymorphisms and of previous immunosuppressive treatment. Therefore, assessing circulating anti-PLA2R autoantibodies and proteinuria may help in monitoring disease activity and guiding personalized rituximab therapy in nephrotic patients with primary MN.

Keywords: glomerulonephritis; membranous nephropathy; nephrotic syndrome; polymorphisms; primary; proteinuria.


Figures

Figure 1.
Figure 1.
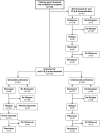
Outcome of the 132 study patients who were available for analyses after rituximab administration. The flow chart shows how many of the 132 patients were or were not screened for anti-PLA2R antibodies and in how many of screened patients, the antibodies were or were not detectable. For each subgroup the flow chart provides detail on patients achieving or not achieving remission after rituximab therapy, progressing or not progressing to a relapse after initial remission, who are completing active follow-up after rituximab administration or are planned for rituximab therapy.
Figure 2.
Figure 2.
Kaplan–Meier curves for the proportion of participants with primary MN who progressed to the combined end point of complete or partial remission (left panel) or complete remission considered as a single end point (right panel) according to treatment with the four-dose or the B cell–driven regimen. In the unadjusted analysis of complete remission, we included a time-varying covariate to account for the unmet proportional hazard assumption. Progression to both end points did not differ appreciably between groups. Adjustments were by sex and log-transformed serum creatinine, and proteinuria. 95% CI, 95% confidence interval; HR, hazard ratio.
Figure 3.
Figure 3.
Kaplan–Meier curves for the proportion of participants with primary MN who progressed to the combined end point of complete or partial remission (left panel) or complete remission considered as a single end point (right panel) in three subgroups with or without detectable anti-PLA2R autoantibodies or without anti-PLA2R antibody evaluations at baseline. Progression to both end points did not differ appreciably among the groups. The upper and lower HRs refer to not available and the detectable group versus the undetectable group (reference), respectively. 95% CI, 95% confidence interval; HR, hazard ratio.
Figure 4.
Figure 4.
Kaplan–Meier curves for the proportion of participants with primary MN and detectable antibodies at baseline who achieved the combined end point of complete or partial remission (left panel) or complete remission considered as a single end point (right panel) in three tertiles of baseline anti-PLA2R autoantibody titer. The probability of achieving both end points progressively decreased from the lowest to the middle and the highest tertile (reference). The upper and lower HRs refer to lowest and middle tertiles versus highest tertile (reference), respectively. 95% CI, 95% confidence interval; HR, hazard ratio.
Figure 5.
Figure 5.
Mean±SEM percent changes in proteinuria, serum albumin, and anti-PLA2R autoantibody levels and circulating CD20 cell counts at different time points after rituximab administration compared with baseline (month 0). °P<0.05, *P≤0.01, ***P≤0.001 (all versus baseline).
Figure 6.
Figure 6.
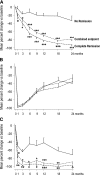
Mean±SEM percent changes in proteinuria (highest panel), circulating CD20 cell counts (middle panel), and serum anti-PLA2R autoantibody levels (lowest panel) at different time points after rituximab administration compared with baseline (month 0) in patients who progressed to the combined end point of complete or partial remission, progressed to complete remission considered as a single end point, or achieved no remission. °P<0.05, *P≤0.01, **P≤0.001, ***P≤0.0001 (all versus no remission).
Figure 7.
Figure 7.
Kaplan–Meier curves for the proportion of participants with primary MN and detectable antibodies at baseline who achieved the combined end point of complete or partial remission (left panel) or complete remission considered as a single end point (right panel) according to depletion of anti-PLA2R autoantibodies over 6 months after rituximab administration. Autoantibody depletion significantly predicts an increased probability of achieving both end points. HRs were adjusted for sex and log-transformed serum creatinine, proteinuria, and anti-PLA2R autoantibody titer. CI, confidence interval; HR, hazard ratio.
Figure 8.
Figure 8.
Kaplan–Meier curves for the proportion of participants with primary MN with a relapse of the NS after initial complete or partial remission considered according to the four-dose or B cell–driven rituximab protocol. Risk of relapse is not associated with the treatment regimen even after adjusting for sex and log-transformed serum creatinine and proteinuria. HRs refer to B cell–driven group versus four-dose group (reference). 95% CI, 95% confidence interval; HR, hazard ratio.
Figure 9.
Figure 9.
Kaplan–Meier curves for the proportion of participants with primary MN with a relapse of the NS after initial remission considered according to previous complete or partial remission. Previous complete remission is associated with a significant protective effect against subsequent disease relapse even after adjusting for age, sex, and log-transformed proteinuria. 95% CI, 95% confidence interval; HR, hazard ratio.
Figure 10.
Figure 10.
Kaplan–Meier curves for the proportion of participants with primary MN with a relapse of the NS after initial complete or partial remission considered according to previous anti-PLA2R autoantibody titer increase/re-emergence after initial rituximab-induced reduction/depletion (left panel) or re-emergence only into circulation after initial depletion (right panel). In both cases, titer increase or antibody re-emergence are associated with a significant excess risk of subsequent disease relapse, even after adjusting for other risk factors (age). 95% CI, 95% confidence interval; HR, hazard ratio.

Comment in

References

    1. Remuzzi G, Chiurchiu C, Abbate M, Brusegan V, Bontempelli M, Ruggenenti P: Rituximab for idiopathic membranous nephropathy. Lancet 360: 923–924, 2002 - PubMed
    1. Bomback AS, Derebail VK, McGregor JG, Kshirsagar AV, Falk RJ, Nachman PH: Rituximab therapy for membranous nephropathy: A systematic review. Clin J Am Soc Nephrol 4: 734–744, 2009 - PMC - PubMed
    1. Cravedi P, Sghirlanzoni MC, Marasà M, Salerno A, Remuzzi G, Ruggenenti P: Efficacy and safety of rituximab second-line therapy for membranous nephropathy: A prospective, matched-cohort study. Am J Nephrol 33: 461–468, 2011 - PubMed
    1. Segarra A, Praga M, Ramos N, Polanco N, Cargol I, Gutierrez-Solis E, Gomez MR, Montoro B, Camps J: Successful treatment of membranous glomerulonephritis with rituximab in calcineurin inhibitor-dependent patients. Clin J Am Soc Nephrol 4: 1083–1088, 2009 - PMC - PubMed
    1. Ruggenenti P, Cravedi P, Chianca A, Perna A, Ruggiero B, Gaspari F, Rambaldi A, Marasà M, Remuzzi G: Rituximab in idiopathic membranous nephropathy. J Am Soc Nephrol 23: 1416–1425, 2012 - PMC - PubMed

Publication types