. 2015 Apr 1;142(7):1254-66.
doi: 10.1242/dev.119735.

WT1 targets Gas1 to maintain nephron progenitor cells by modulating FGF signals

Affiliations

WT1 targets Gas1 to maintain nephron progenitor cells by modulating FGF signals

Martin Kann et al. Development. .

Abstract

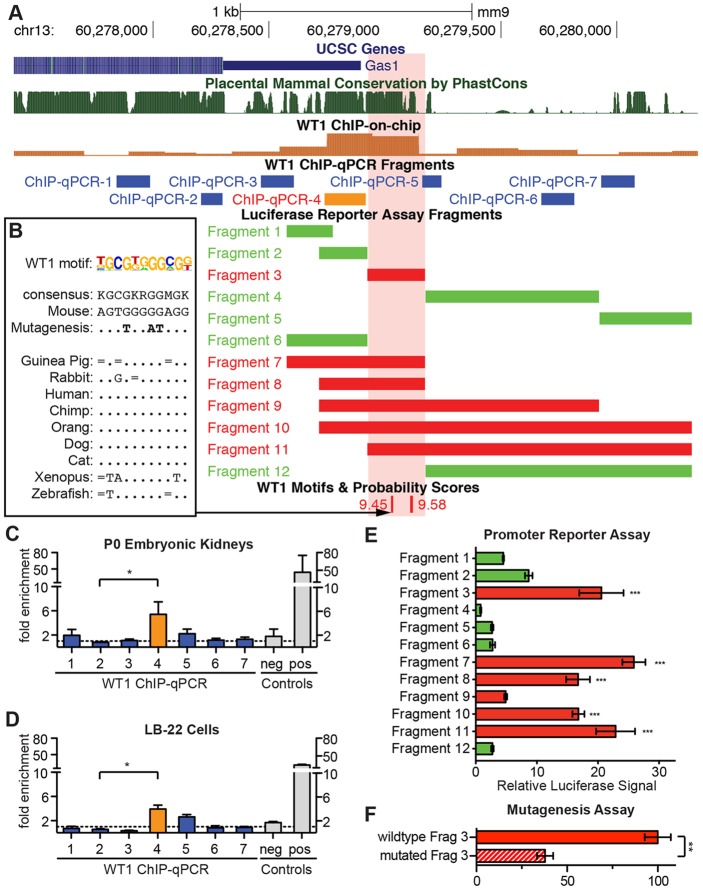
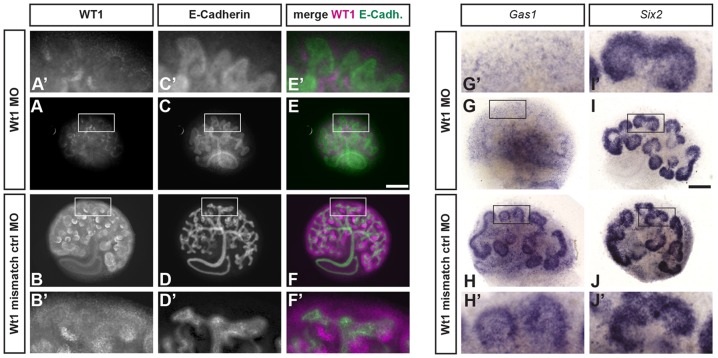
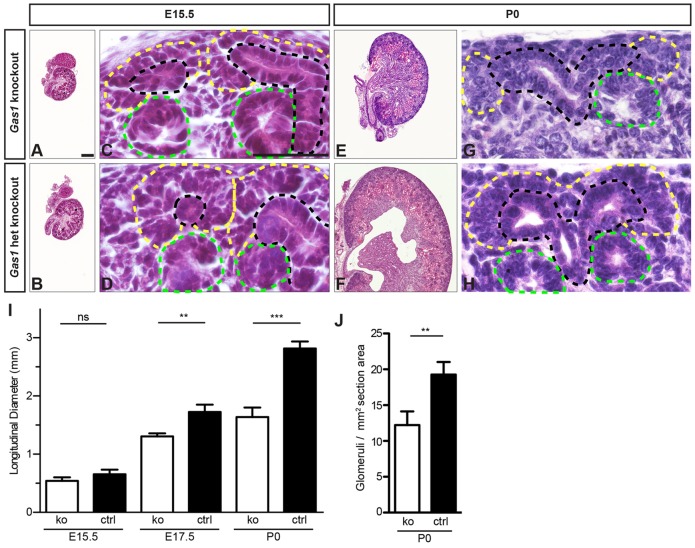
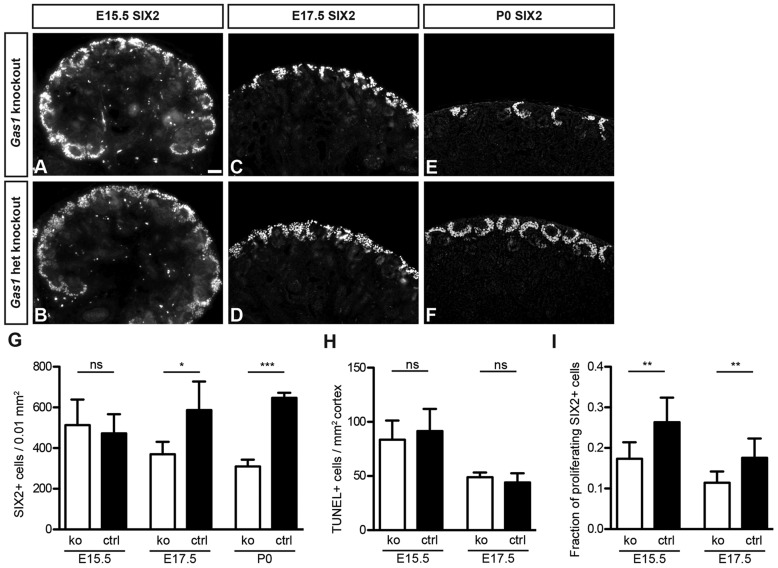
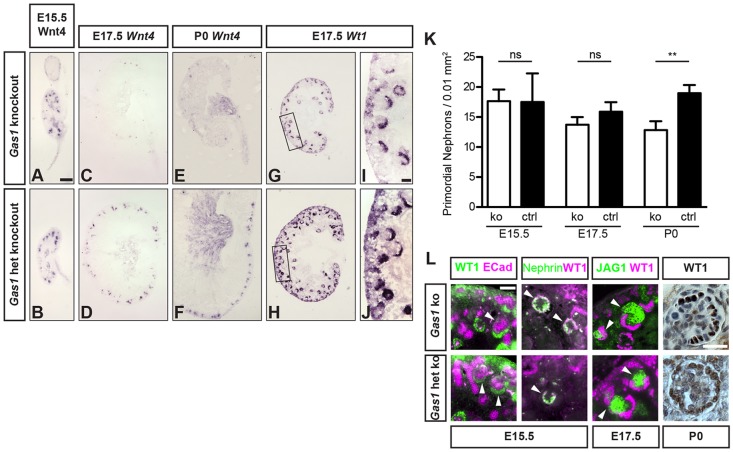
Development of the metanephric kidney depends on tightly regulated interplay between self-renewal and differentiation of a nephron progenitor cell (NPC) pool. Several key factors required for the survival of NPCs have been identified, including fibroblast growth factor (FGF) signaling and the transcription factor Wilms' tumor suppressor 1 (WT1). Here, we present evidence that WT1 modulates FGF signaling by activating the expression of growth arrest-specific 1 (Gas1), a novel WT1 target gene and novel modulator of FGF signaling. We show that WT1 directly binds to a conserved DNA binding motif within the Gas1 promoter and activates Gas1 mRNA transcription in NPCs. We confirm that WT1 is required for Gas1 expression in kidneys in vivo. Loss of function of GAS1 in vivo results in hypoplastic kidneys with reduced nephron mass due to premature depletion of NPCs. Although kidney development in Gas1 knockout mice progresses normally until E15.5, NPCs show decreased rates of proliferation at this stage and are depleted as of E17.5. Lastly, we show that Gas1 is selectively required for FGF-stimulated AKT signaling in vitro. In summary, our data suggest a model in which WT1 modulates receptor tyrosine kinase signaling in NPCs by directing the expression of Gas1.

Keywords: Fibroblast growth factor signaling; Kidney development; Mouse; Nephron progenitor cell.


Figures

Fig. 1.
Fig. 1.
WT1 binds to the Gas1 promoter to control Gas1 expression. (A) Representation of the Gas1 promoter in the UCSC genome browser, including WT1 ChIP-on-chip signals, location of PCR products for ChIP-qPCR, promoter fragments used for luciferase assays and WT1 binding motifs abolished by mutagenesis. The red box indicates the WT1-sensitive element. (B) Cross-species conservation at the conserved WT1 motif abolished by mutagenesis. The WT1 motif logo, consensus sequence, bases changed by mutagenesis and genomic sequence from various species is shown. Dots indicate identical bases, bars represent bases that match the consensus. (C,D) Results of WT1 ChIP-qPCR in embryonic kidneys and LB-22 cells using PCR products as indicated in A. An intron of Gapdhs and the Kdm3b promoter are used as negative (neg) and positive (pos) controls, respectively. (E) Dual luciferase promoter reporter assays in LB-22 cells for fragments shown in A and fragments with mutated WT1 binding sites. (F) Relative luciferase reporter signals for the wild type and mutated (see B) WT1-responsive element. For C-F, data show the mean±s.e.m., n=3; *P<0.05; **P<0.01; ***P<0.001.
Fig. 2.
Fig. 2.
Knockdown of WT1 in kidney organ cultures results in decreased Gas1 mRNA. (A-F) Morpholino oligonucleotide (MO)-based knockdown of WT1 in kidney organ cultures results in decreased levels of WT1 protein. (G-J) In situ hybridization for Gas1 mRNA shows decreased signals in WT1 morphant cultures while Six2+ nephron progenitor cells are maintained. Scale bars: 100 µm.
Fig. 3.
Fig. 3.
Conditional knockdown of WT1 in nephron progenitors in vivo results in decreased Gas1 expression. (A,B) High-power histology of the nephrogenic zone of WT1 knockdown (Wt1ckd) kidneys and controls at stage E16.5. Loss of condensed mesenchyme and pretubular aggregates/induced nephrons at a preserved ureteric bud branch. (C,D) Low-power H&E stain of Wt1ckd kidneys at stage P0 shows hypoplasia with cystic malformations and increased stroma. (E-J) In situ hybridization for Wt1, Gas1 and Six2 mRNA at stage E14.5. Decreased signals for Wt1 and Gas1 are evident in Wt1ckd kidneys. NPCs are preserved at this stage. (K-R) Decreased WT1 and GAS1 in Wt1ckd are visualized by immunofluorescence at stage E15.5. NPCs are decreased in number in Wt1ckd kidneys. Scale bars: 10 µm in A,E,K; 50 µm in C.
Fig. 4.
Fig. 4.
Gas1 knockout kidneys are hypoplastic and show disorganization of the nephrogenic zone. (A-D) Histology of Gas1 knockout kidneys at stage E15.5. Kidneys are normal and adequately sized with condensing mesenchyme (yellow line) and two renal vesicles (green line) surrounding a ureteric bud branch (black line). het, heterozygous. Scale bars: 50 µm (low power), 10 µm (high power). (E-H) Histology at stage P0. Gas1 knockout kidneys are hypoplastic. Condensed mesenchyme is reduced and only a single renal vesicle is present. (I) The longitudinal diameters of kidney sections including the papilla at various stages. ko, knockout; ctrl, heterozygous knockout. Data show the mean±s.d., n≥4; ns, not significant; **P<0.01; ***P<0.001. (J) The numbers of glomeruli in Gas1 knockout and control kidneys at P0. Data show the mean±s.d.; **P<0.01.
Fig. 5.
Fig. 5.
Progressive loss of SIX2+ nephron progenitor cells in Gas1 knockout kidneys due to decreased proliferation. (A-F) Immunofluorescence staining for SIX2 on Gas1 knockout and control kidneys at various stages. A decreased number of SIX2+ nuclei is evident with progression of renal development. het, heterozygous. Scale bar: 10 µm. (G) Quantification of SIX2+ nuclei normalized to cortex surface at various embryonic stages. Data show the mean±s.d., n≥4; ns, not significant; *P<0.05; ***P<0.001. (H) Quantification of TUNEL+ signals normalized to cortical area. Increased cell death is excluded as a reason for NPC loss. Data show the mean±s.d., n=3; ns, not significant. (I) Quantification of SIX2+/BrdU+ cells at E15.5 and E17.5. The proliferative fraction of SIX2+ cells in Gas1 knockout kidneys is decreased at E15.5 and E17.5. ko, knockout; ctrl, heterozygous knockout. Data show the mean±s.d., n=3; **P<0.01.
Fig. 6.
Fig. 6.
Nephrogenesis decreases prematurely in Gas1 knockout kidneys. (A-J) In situ hybridization for Wnt4 and Wt1. Normal signal distribution at E15.5 and near loss of Wnt4+ structures in Gas1 knockout beginning at stage E17.5. Wt1+ S-shaped bodies and glomeruli are visible at E17.5, PTAs and RVs are lacking. Scale bars: 50 µm (low power), 10 µm (high power). (K) Quantification of NCAM+ primordial nephrons normalized to cortical surface. ko, knockout; ctrl, heterozygous knockout. Data show the mean±s.d.; ns, not significant; **P<0.01. (L) Immunofluorescence staining of induced nephrons and glomeruli (arrowheads) for JAG1, WT1, E-cadherin and nephrin show normal signal patterning. Immunohistochemistry for WT1 in glomeruli shows normal distribution of podocytes at P0. het, heterozygous. Scale bars: 5 µm.
Fig. 7.
Fig. 7.
Loss of function of Gas1 does not affect RET signaling in vivo. (A-F) In situ hybridization on stage E15.5 kidney sections for Wnt11, Etv5 and Crlf1 mRNAs as genes depending on RET signaling shows no difference in expression patterns. het, heterozygous. Scale bar: 50 µm. (G) Real-time qPCR results for RET-dependent genes on total RNA extracted from E13.5 kidneys. ko, knockout; ctrl, heterozygous knockout. Data show the mean±s.e.m., n=3; ns, not significant.
Fig. 8.
Fig. 8.
Depletion of Gas1 modulates FGF signaling through AKT in vitro and in vivo. (A) Western blots of whole-cell lysates from LB-22 cells treated with Gas1 siRNA or scramble control and stimulated with 50 ng/ml FGF as indicated. (B) Densitometry of repeat western blots as in A. Results are normalized to the non-stimulated, vehicle-treated control and to total AKT, total ERK or tubulin, respectively. Data show the mean±s.e.m., n≥3; ns, not significant. (C-G) Immunohistochemistry for phospho-Akt at E15.5 shows diminished phospho-Akt signal in condensed mesenchyme upon Gas1 knockout. Black boxes in C,D correspond to high-power panels. Ureteric tips are labeled with asterisks. Arrowheads indicate condensed mesenchyme. Scale bars: 200 µm (low power), 25 µm (high power), 75 µm (mid power).

Similar articles

Cited by

References

    1. Ahn S.-Y., Kim Y., Kim S. T., Swat W. and Miner J. H. (2013). Scaffolding proteins DLG1 and CASK cooperate to maintain the nephron progenitor population during kidney development. J. Am. Soc. Nephrol. 24, 1127-1138 10.1681/ASN.2012111074 - DOI - PMC - PubMed
    1. Akpa M. M., Iglesias D. M., Chu L. L., Cybulsky M., Bravi C. and Goodyer P. (2014). Wilms tumour suppressor, WT1, suppresses epigenetic silencing of the beta-catenin gene. J. Biol. Chem. 290, 2279-2288 10.1074/jbc.M114.573576 - DOI - PMC - PubMed
    1. Allen B. L., Tenzen T. and McMahon A. P. (2007). The Hedgehog-binding proteins Gas1 and Cdo cooperate to positively regulate Shh signaling during mouse development. Genes Dev. 21, 1244-1257 10.1101/gad.1543607 - DOI - PMC - PubMed
    1. Barak H., Huh S.-H., Chen S., Jeanpierre C., Martinovic J., Parisot M., Bole-Feysot C., Nitschke P., Salomon R., Antignac C. et al. (2012). FGF9 and FGF20 maintain the stemness of nephron progenitors in mice and man. Dev. Cell 22, 1191-1207 10.1016/j.devcel.2012.04.018 - DOI - PMC - PubMed
    1. Blank U., Brown A., Adams D. C., Karolak M. J. and Oxburgh L. (2009). BMP7 promotes proliferation of nephron progenitor cells via a JNK-dependent mechanism. Development 136, 3557-3566 10.1242/dev.036335 - DOI - PMC - PubMed

Publication types

MeSH terms