. 2015 Dec;18(17):3096-107.
doi: 10.1017/S1368980015000506. Epub 2015 Mar 25.

Trends in consumption of ultra-processed foods and obesity in Sweden between 1960 and 2010

Affiliations

Trends in consumption of ultra-processed foods and obesity in Sweden between 1960 and 2010

Filippa Juul et al. Public Health Nutr. 2015 Dec.

Abstract

Objective: To investigate how consumption of ultra-processed foods has changed in Sweden in relation to obesity.

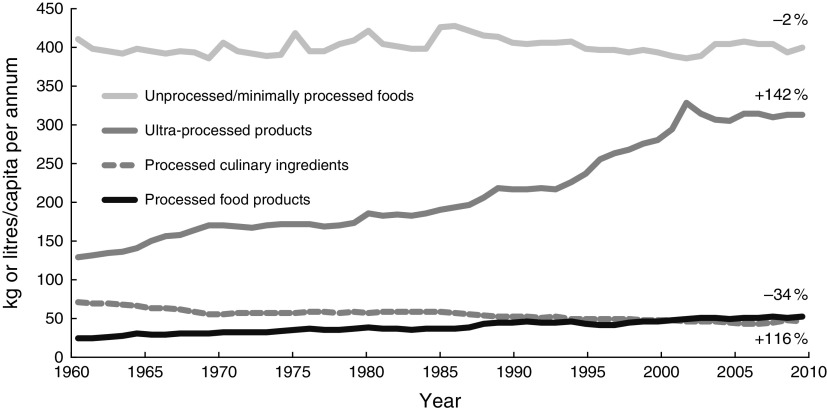
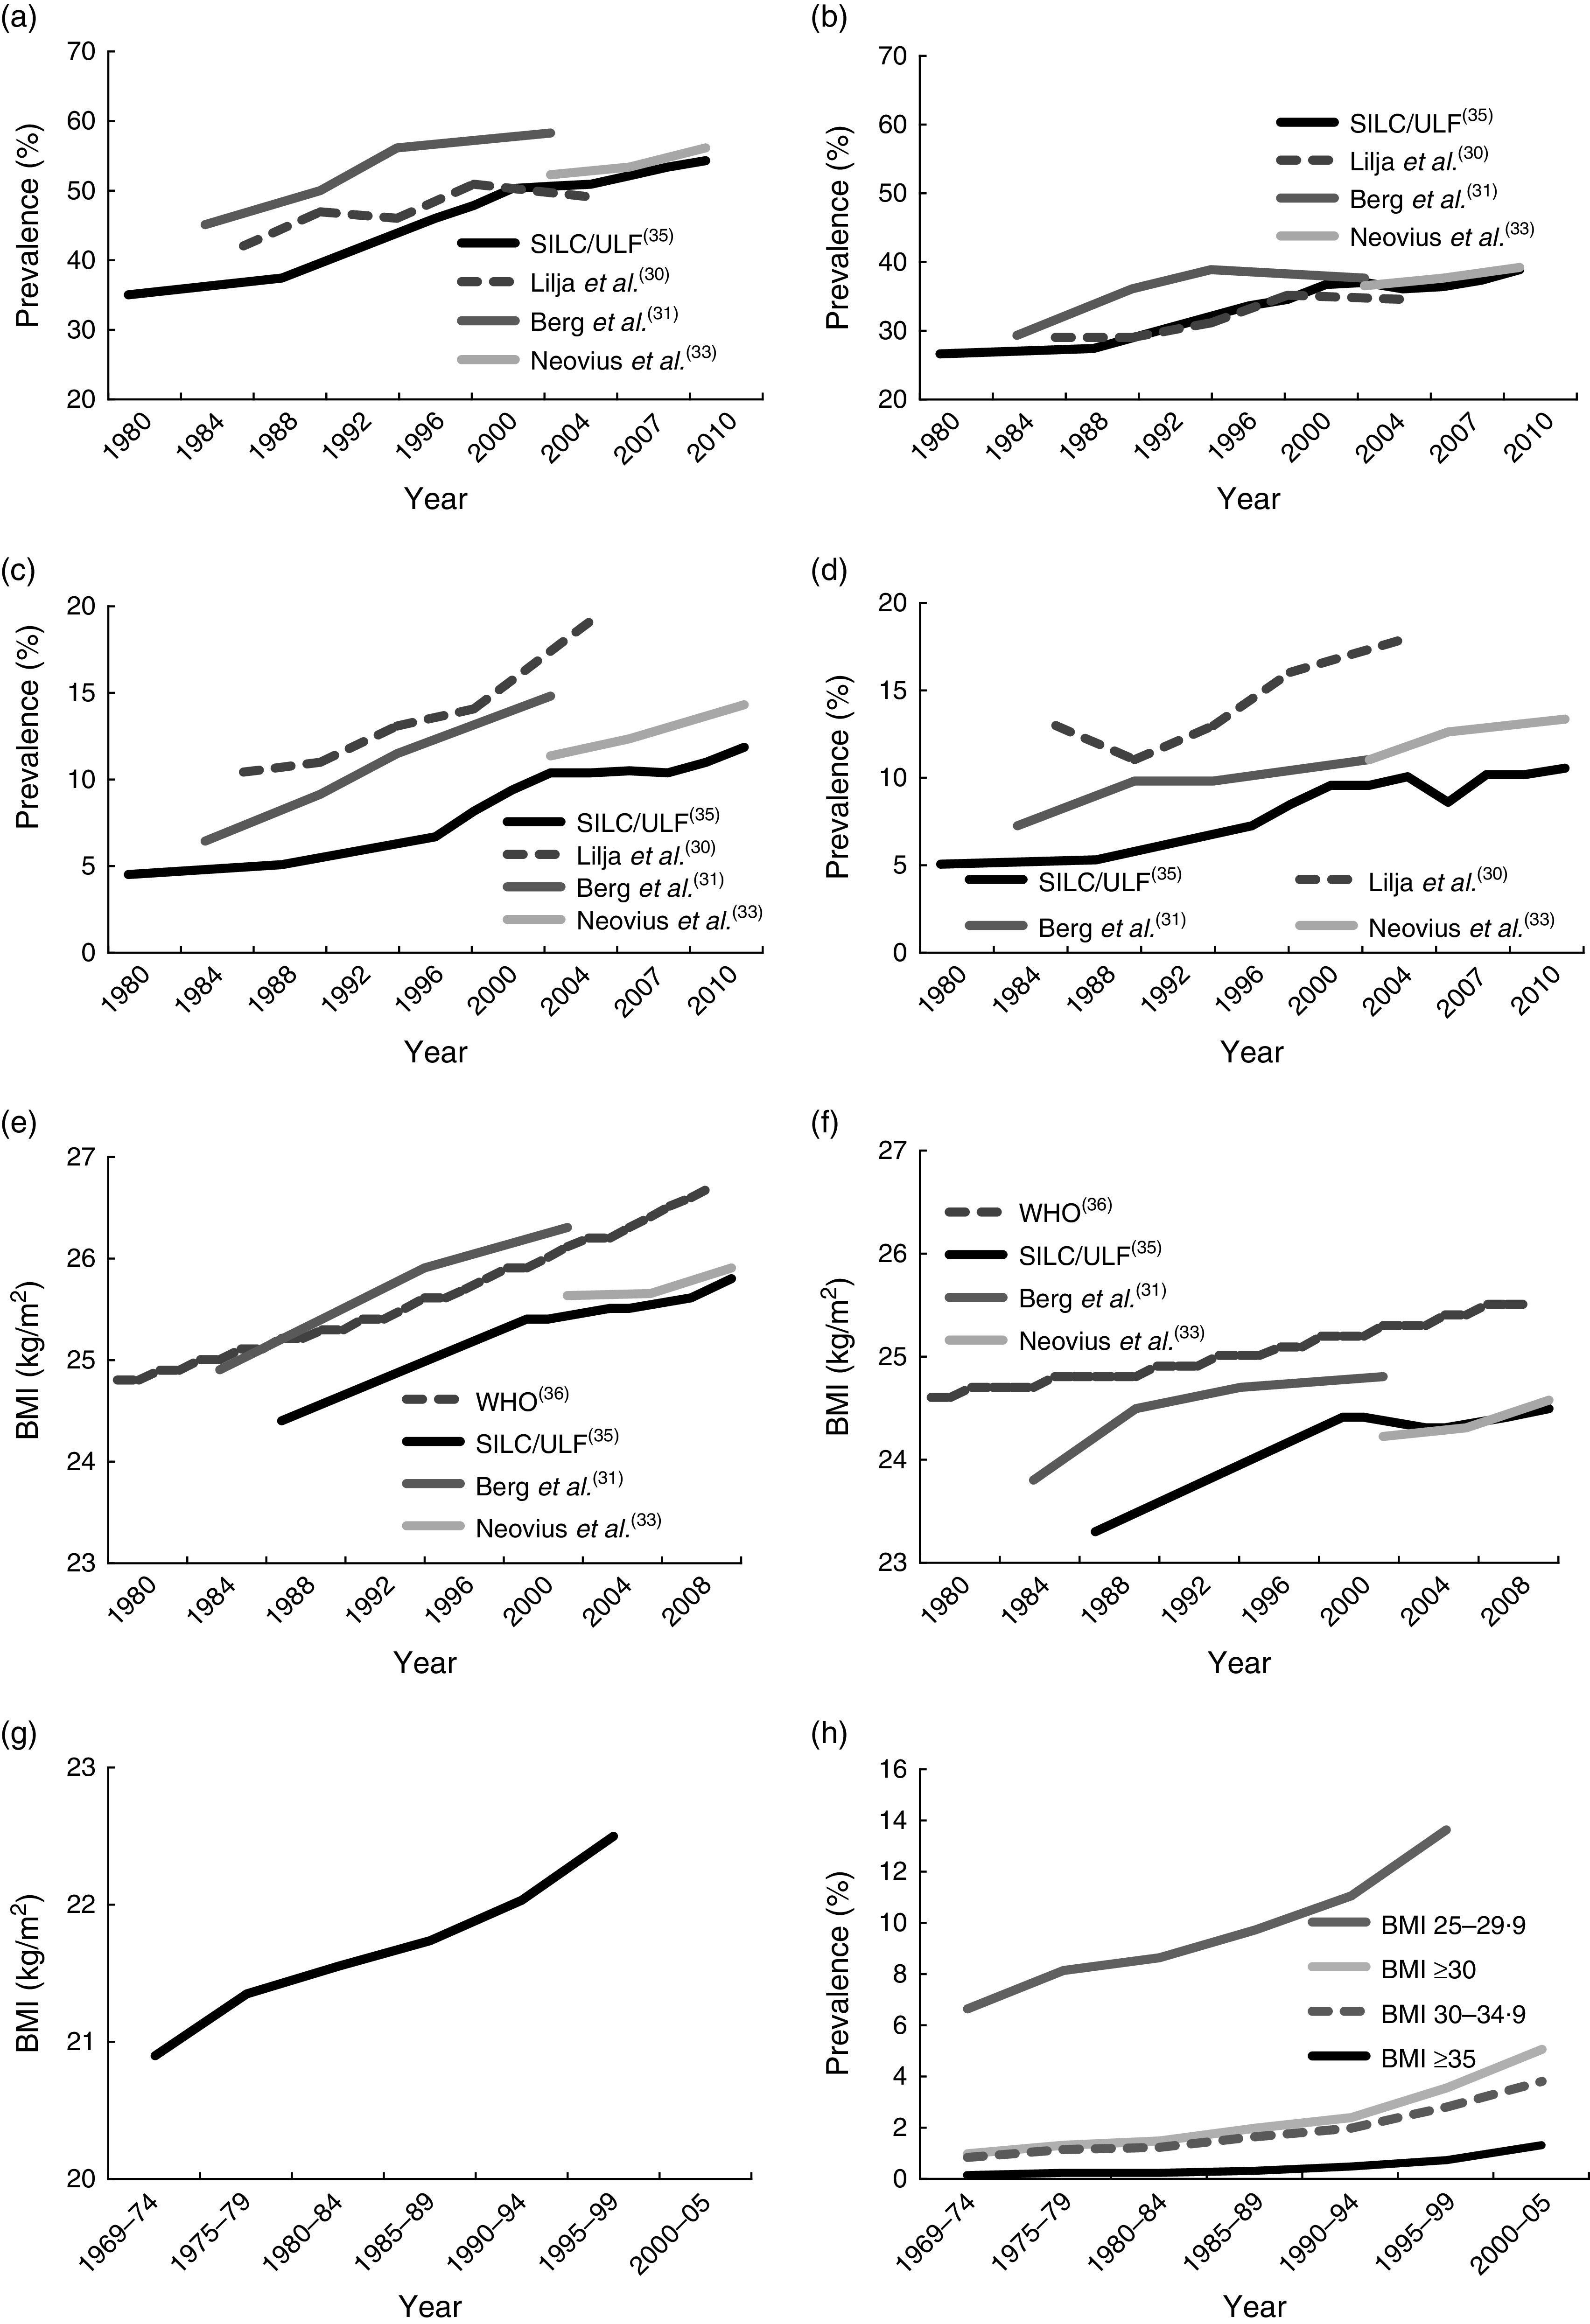
Design: Nationwide ecological analysis of changes in processed foods along with corresponding changes in obesity. Trends in per capita food consumption during 1960-2010 were investigated using data from the Swedish Board of Agriculture. Food items were classified as group 1 (unprocessed/minimally processed), group 2 (processed culinary ingredients) or group 3 (3·1, processed food products; and 3·2, ultra-processed products). Obesity prevalence data were pooled from the peer-reviewed literature, Statistics Sweden and the WHO Global Health Observatory.

Setting: Nationwide analysis in Sweden, 1960-2010.

Subjects: Swedish nationals aged 18 years and older.

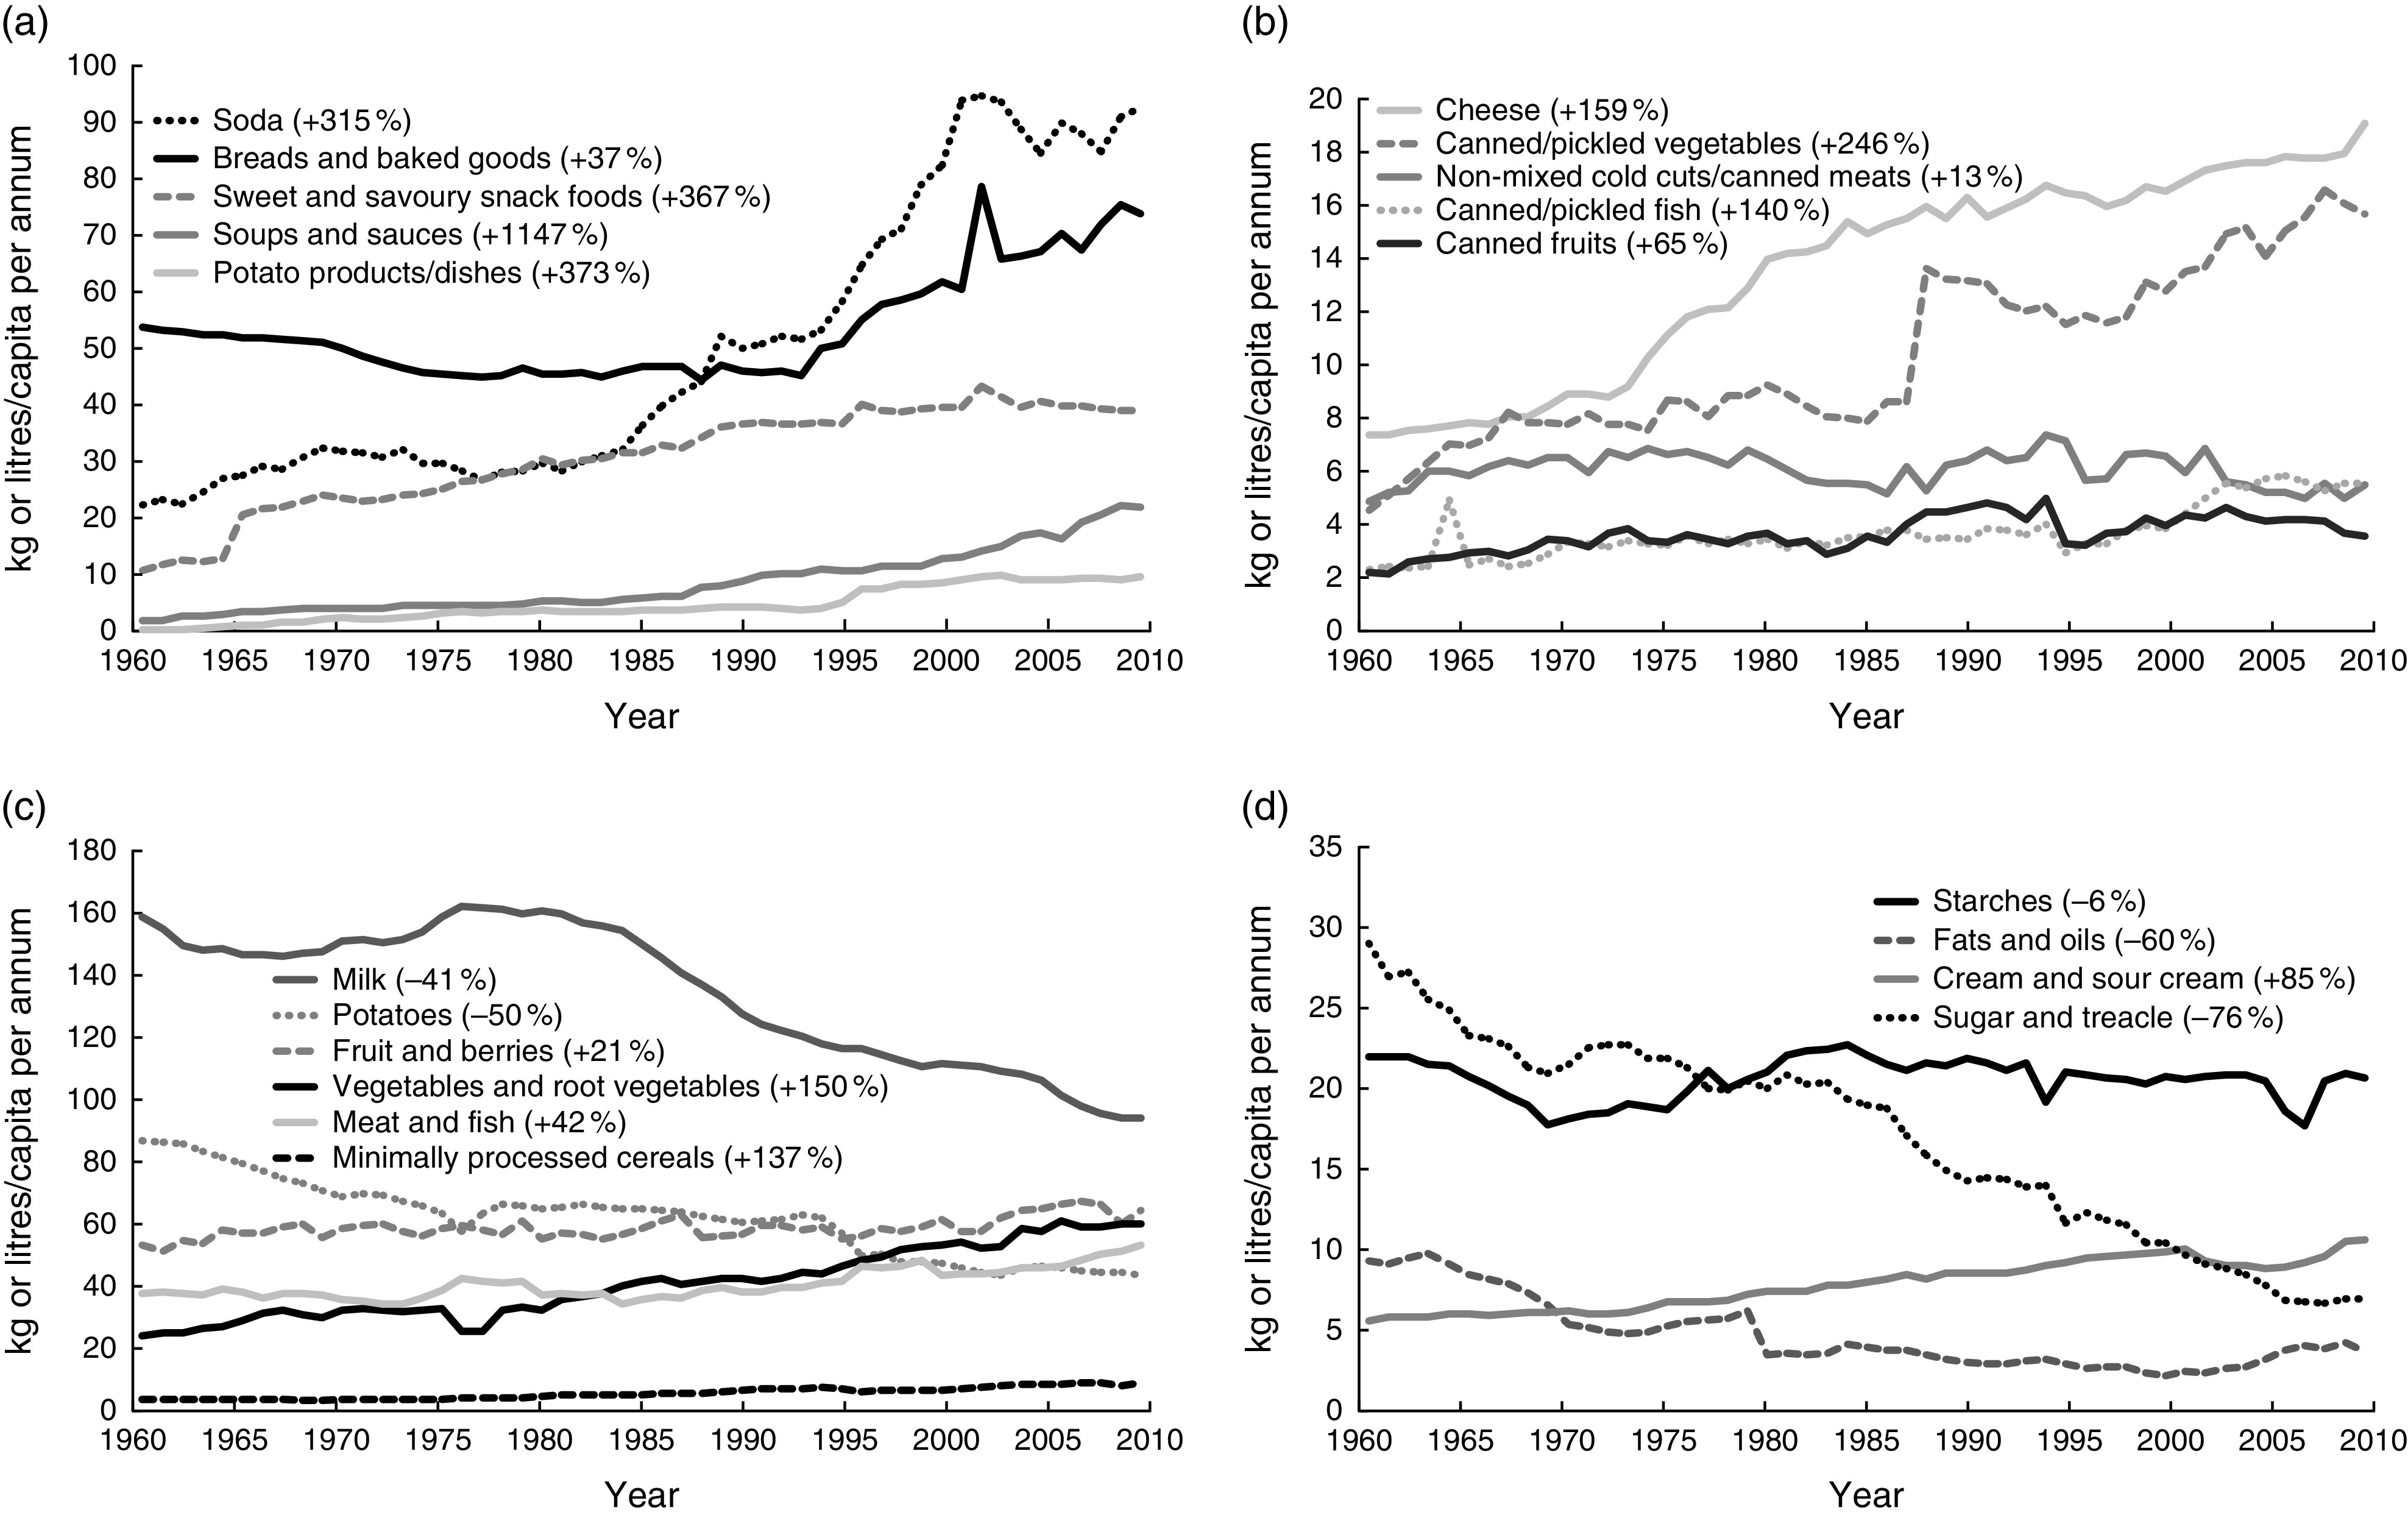
Results: During the study period consumption of group 1 foods (minimal processing) decreased by 2 %, while consumption of group 2 foods (processed ingredients) decreased by 34 %. Consumption of group 3·1 foods (processed food products) increased by 116 % and group 3·2 foods (ultra-processed products) increased by 142 %. Among ultra-processed products, there were particularly large increases in soda (315 %; 22 v. 92 litres/capita per annum) and snack foods such as crisps and candies (367 %; 7 v. 34 kg/capita per annum). In parallel to these changes in ultra-processed products, rates of adult obesity increased from 5 % in 1980 to over 11 % in 2010.

Conclusions: The consumption of ultra-processed products (i.e. foods with low nutritional value but high energy density) has increased dramatically in Sweden since 1960, which mirrors the increased prevalence of obesity. Future research should clarify the potential causal role of ultra-processed products in weight gain and obesity.

Keywords: Industrial food processing; Obesity; Overweight; Ultra-processed food products.


Figures

Fig. 1
Fig. 1
Annual per capita consumption (kilograms or litres) of food and non-alcoholic beverages in Sweden, 1960–2010, according to degree of industrial food processing by the NOVA framework
Fig. 2
Fig. 2
Annual per capita consumption (kilograms or litres) of selected group 1, 2, 3·1 and 3·2 foods in Sweden for years 1960–2010. (a) Ultra-processed products (group 3·2): ‘breads and baked goods’ include all types of breads, pizza, pastries, cookies, cakes and biscuits; ‘potato products/dishes’ include refrigerated, frozen and dehydrated products such as ready-made potato-salad, frozen French fries and instant mashed potato mixes; ‘soda’ refers to caloric and non-caloric flavoured carbonated beverages such as colas, diet sodas and ciders; ‘soups and sauces’ refer to ready-made refrigerated, frozen, canned and dehydrated soups and sauces; ‘sweet and savoury snack foods’ include potato and corn crisps, popcorn, candies, chocolate, ice cream and chocolate milk. (b) Processed food products (group 3·2): ‘cheese’ includes hard and soft varieties, both fresh and cured; ‘canned/pickled vegetables’ refer to vegetables that have been pickled or canned in brine; ‘canned fruits’ refer to fruits canned in syrup; ‘canned/pickled fish’ refer to fish and seafood that have been pickled and/or canned, salted or smoked; ‘non-mixed cold cuts/canned meats’ refer to items such as ham and canned meats. (c) Unprocessed and minimally processed foods (group 1): data refer to fresh and frozen meat, fish, vegetables, fruits and berries; fresh milk including whole-fat, semi-skimmed and skimmed varieties; fresh eggs; fresh potatoes; minimally processed grains including rice, oatmeal and other cereals. (d) Processed culinary ingredients: ‘starches’ include uncooked pasta and noodles, flours, cake and bread mixes, cereal-based formula mixes and potato starch; cream and sour cream; ‘fats and oils’ include butter and plant oils; ‘sugar and treacle’ include brown sugar
Fig. 3
Fig. 3
(a) Annual per capita consumption (litres) of alcohol and caloric/non-caloric sweet beverages in Sweden, 1960–2010. (b) Mean daily per capita energy intake (kJ) in Sweden, 1960–2010. (c) Relative contribution of macronutrients to total energy intake (E%) in Sweden, 1960–2010. (d) Average annual household expenditure (Swedish krona, SEK) on food products and away-from-home eating in Sweden, 1978–2009
Fig. 4
Fig. 4
Overweight and obesity in Sweden. (a) Prevalence of overweight (BMI≥25·0 kg/m2) among adult men in Sweden, 1980–2010. (b) Prevalence of overweight (BMI≥25·0 kg/m2) among adult women in Sweden, 1980–2010. (c) Prevalence of obesity (BMI ≥30·0 kg/m2) among adult men in Sweden, 1980–2010. (d) Prevalence of obesity (BMI≥30·0 kg/m2) among adult women in Sweden, 1980–2010. (e) Mean BMI of adult men in Sweden, 1980–2010. (f) Mean BMI of adult women in Sweden, 1980–2010. (g) Mean BMI of male conscripts in Sweden, 1969–2005. (h) Prevalence of overweight and obesity among male conscripts in Sweden, 1969–2005

References

    1. Slimani N, Deharveng G, Southgate DA et al.. (2009) Contribution of highly industrially processed foods to the nutrient intakes and patterns of middle-aged populations in the European Prospective Investigation into Cancer and Nutrition study. Eur J Clin Nutr 63, Suppl. 4, S206–S225. - PubMed
    1. Stuckler D & Nestle M (2012) Big food, food systems, and global health. PLoS Med 9, e1001242. - PMC - PubMed
    1. Moubarac JC, Claro RM, Baraldi LG et al.. (2013) International differences in cost and consumption of ready-to-consume food and drink products: United Kingdom and Brazil, 2008–2009. Glob Public Health 8, 845–856. - PubMed
    1. Monteiro CA, Levy RB, Claro RM et al.. (2010) A new classification of foods based on the extent and purpose of their processing. Cad Saude Publica 26, 2039–2049. - PubMed
    1. Moubarac J-C, Parra D, Cannon G et al.. (2014) Food classification systems based on food processing: significance and implications for policies and actions. A systematic literature review and assessment. Curr Obes Rep 3, 256–272. - PubMed

MeSH terms