. 2015 May;21(5):813-23.
doi: 10.1261/rna.048769.114. Epub 2015 Mar 24.

Splicing predictions reliably classify different types of alternative splicing

Affiliations

Splicing predictions reliably classify different types of alternative splicing

Anke Busch et al. RNA. 2015 May.

Abstract

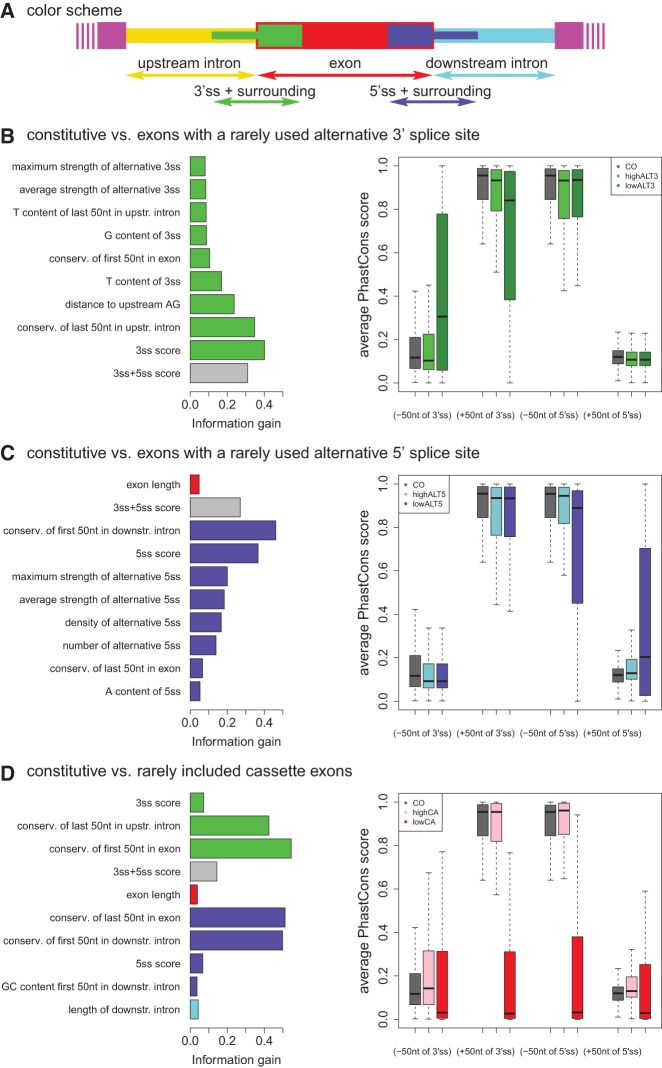
Alternative splicing is a key player in the creation of complex mammalian transcriptomes and its misregulation is associated with many human diseases. Multiple mRNA isoforms are generated from most human genes, a process mediated by the interplay of various RNA signature elements and trans-acting factors that guide spliceosomal assembly and intron removal. Here, we introduce a splicing predictor that evaluates hundreds of RNA features simultaneously to successfully differentiate between exons that are constitutively spliced, exons that undergo alternative 5' or 3' splice-site selection, and alternative cassette-type exons. Surprisingly, the splicing predictor did not feature strong discriminatory contributions from binding sites for known splicing regulators. Rather, the ability of an exon to be involved in one or multiple types of alternative splicing is dictated by its immediate sequence context, mainly driven by the identity of the exon's splice sites, the conservation around them, and its exon/intron architecture. Thus, the splicing behavior of human exons can be reliably predicted based on basic RNA sequence elements.

Keywords: alternative splicing; bioinformatics; splicing predictor; support vector machine.


Figures

FIGURE 1.
FIGURE 1.
Splice-site usage (A) and (B) and exon inclusion (C) levels of exons in our data sets. The plots show the relationship between inclusion/usage levels and the cumulative number of events. Exons in each set were ordered based on their inclusion/usage level. Cassette exons were then grouped in sets of 100, exons with an alternative 3′ or 5′ splice-site were grouped in sets of 20 events and averaged.
FIGURE 2.
FIGURE 2.
ROC curves of SVMs comparing constitutive exons (CO) and (A) exons with an alternative 3′ splice site, (B) exons with an alternative 5′ splice site, (C) cassette exons, (D) rarely included cassette exons (lowCA), exons with a rarely used alternative 3′ splice site (lowALT3), and exons with a rarely used alternative 5′ splice site (lowALT5), and (E) frequently included cassette exons (highCA), exons with a frequently used alternative 3′ splice site (highALT3), and exons with a frequently used alternative 5′ splice site (highALT5). The true positive rate (TPR) is calculated as the number of true positives (TP) divided by the number of positive (P) samples in the test set. The false positive rate (FPR) is calculated as the number of false positives (FP) divided by the number of negative (N) samples in the test set.
FIGURE 3.
FIGURE 3.
Accuracy of the predictions when comparing constitutive exons with alternatively spliced exons. Using the SVM that was trained on constitutive exons and (A) exons with a rarely used (up to 20%) alternative 3′ splice site (CO-lowALT3), (B) exons with a rarely used alternative 5′ splice site (CO-lowALT5), and (C) rarely included cassette exons, predictions were made for new test exons whose alternative splice sites were used with various different frequencies (x-axis). Accuracy is specified as AUC of the ROC curve (y-axis).
FIGURE 4.
FIGURE 4.
Experimental verification. Predictions were made using the SVMs CO-lowALT3 (for exons with an alternative 3′ splice site, drawn in green), CO-lowALT5 (for exons with an alternative 5′ splice site, drawn in blue), and CO-lowCA (for cassette exons, drawn in red). Inclusion/usage levels were determined based on RNA-seq data in HeLa cells (x-axes). The performance of the SVMs is shown on the y-axes as area under the ROC curve (AUC). Abbreviations for all SVMs are used as defined in Materials and Methods.
FIGURE 5.
FIGURE 5.
Most influential features and average conservation ±50 nt around the exon junctions after splitting the data sets into subsets. Color coding for different regions is depicted in A. Features that refer to a combination of several regions are given in gray. The surroundings of the 3′ and 5′ splices site were typically defined as ±50 nt around the exon/intron junctions. The left plots in BD show the information gain of the dominant features when comparing (B) constitutive and exons with a rarely used alternative 3′ splice site, (C) constitutive and exons with a rarely used alternative 5′ splice site, (D) constitutive and rarely included cassette exons. Right plots in BD show the average conservation (PhastCons score) ±50 nt around the exon junctions. The thick line in each box depicts the median, while the upper and lower ends of the box represent the 25% and 75% quantile, respectively. Smallest and largest observations are depicted by the upper and lower end of the whiskers. Constitutive exons (CO) are compared with (B) exons with a frequently or rarely used alternative 3′ splice site (highALT3 and lowALT3, respectively), (C) exons with a frequently or rarely used alternative 5′ splice site (highALT5 and lowALT5, respectively), and (D) frequently and rarely included cassette exons (highCA and lowCA, respectively).

References

    1. Ashiya M, Grabowski PJ 1997. A neuron-specific splicing switch mediated by an array of pre-mRNA repressor sites: evidence of a regulatory role for the polypyrimidine tract binding protein and a brain-specific PTB counterpart. RNA 3: 996–1015. - PMC - PubMed
    1. Aznarez I, Barash Y, Shai O, He D, Zielenski J, Tsui LC, Parkinson J, Frey BJ, Rommens JM, Blencowe BJ 2008. A systematic analysis of intronic sequences downstream of 5′ splice sites reveals a widespread role for U-rich motifs and TIA1/TIAL1 proteins in alternative splicing regulation. Genome Res 18: 1247–1258. - PMC - PubMed
    1. Barash Y, Calarco JA, Gao W, Pan Q, Wang X, Shai O, Blencowe BJ, Frey BJ 2010. Deciphering the splicing code. Nature 465: 53–59. - PubMed
    1. Barash Y, Vaquero-Garcia J, González-Vallinas J, Xiong HY, Gao W, Lee LJ, Frey BJ 2013. AVISPA: a web tool for the prediction and analysis of alternative splicing. Genome Biol 14: R114. - PMC - PubMed
    1. Barbosa-Morais NL, Irimia M, Pan Q, Xiong HY, Gueroussov S, Lee LJ, Slobodeniuc V, Kutter C, Watt S, Colak R, et al. 2012. The evolutionary landscape of alternative splicing in vertebrate species. Science 338: 1587–1593. - PubMed

Publication types

Substances