Epigenetic reprogramming and re-differentiation of a Ewing sarcoma cell line
- PMID: 25806369
- PMCID: PMC4353378
- DOI: 10.3389/fcell.2015.00015
Epigenetic reprogramming and re-differentiation of a Ewing sarcoma cell line
Abstract
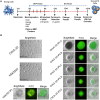
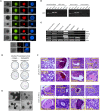
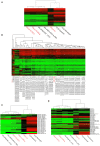
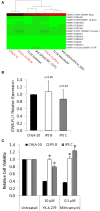
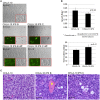
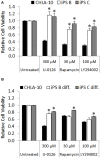
Developmental reprogramming techniques have been used to generate induced pluripotent stem (iPS) cells from both normal and malignant cells. The derivation of iPS cells from cancer has the potential to provide a unique scientific tool to overcome challenges associated with the establishment of cell lines from primary patient samples and a readily expandable source of cells that may be used to model the initial disease. In the current study we developmentally reprogrammed a metastatic Ewing sarcoma (EWS) cell line to a meta-stable embryonic stem (ES)-like state sharing molecular and phenotypic features with previously established ES and iPS cell lines. EWS-iPS cells exhibited a pronounced drug resistant phenotype despite persistent expression of the oncogenic EWS-FLI1 fusion transcript. This included resistance to compounds that specifically target downstream effector pathways of EWS-FLI1, such as MAPK/ERK and PI3K/AKT, which play an important role in EWS pathogenesis. EWS-iPS cells displayed tumor initiation abilities in vivo and formed tumors exhibiting characteristic Ewing histopathology. In parallel, EWS-iPS cells re-differentiated in vitro recovered sensitivity to molecularly targeted chemotherapeutic agents, which reiterated pathophysiological features of the cells from which they were derived. These data suggest that EWS-iPS cells may provide an expandable disease model that could be used to investigate processes modulating oncogenesis, metastasis, and chemotherapeutic resistance in EWS.
Keywords: Ewing sarcoma; drug resistance; epigenetics; induced pluripotent stem cells; reprogramming.
Figures
Similar articles
-
Overexpression of HOX genes is prevalent in Ewing sarcoma and is associated with altered epigenetic regulation of developmental transcription programs.Epigenetics. 2014 Dec;9(12):1613-25. doi: 10.4161/15592294.2014.988048. Epigenetics. 2014. PMID: 25625846 Free PMC article.
-
BET bromodomain inhibitors suppress EWS-FLI1-dependent transcription and the IGF1 autocrine mechanism in Ewing sarcoma.Oncotarget. 2016 Jul 12;7(28):43504-43517. doi: 10.18632/oncotarget.9762. Oncotarget. 2016. PMID: 27259270 Free PMC article.
-
Ewing's sarcoma cancer stem cell targeted therapy.Curr Stem Cell Res Ther. 2014 Jan;9(1):46-62. doi: 10.2174/1574888x08666131203123125. Curr Stem Cell Res Ther. 2014. PMID: 24294922 Review.
-
Challenges in modeling EWS-FLI1-driven transgenic mouse model for Ewing sarcoma.Am J Transl Res. 2021 Nov 15;13(11):12181-12194. eCollection 2021. Am J Transl Res. 2021. PMID: 34956445 Free PMC article. Review.
-
KDM5A and PHF2 positively control expression of pro-metastatic genes repressed by EWS/Fli1, and promote growth and metastatic properties in Ewing sarcoma.Oncotarget. 2020 Oct 27;11(43):3818-3831. doi: 10.18632/oncotarget.27737. eCollection 2020 Oct 27. Oncotarget. 2020. PMID: 33196691 Free PMC article.
Cited by
-
IGF-1R and mTOR Blockade: Novel Resistance Mechanisms and Synergistic Drug Combinations for Ewing Sarcoma.J Natl Cancer Inst. 2016 Aug 30;108(12):djw182. doi: 10.1093/jnci/djw182. Print 2016 Dec. J Natl Cancer Inst. 2016. PMID: 27576731 Free PMC article.
-
Applications of iPSCs in Cancer Research.Biomark Insights. 2015 Jul 29;10(Suppl 1):125-31. doi: 10.4137/BMI.S20065. eCollection 2015. Biomark Insights. 2015. PMID: 26279620 Free PMC article. Review.
-
Cancer in a dish: progress using stem cells as a platform for cancer research.Am J Cancer Res. 2018 Jun 1;8(6):944-954. eCollection 2018. Am J Cancer Res. 2018. PMID: 30034933 Free PMC article. Review.
-
Application of induced pluripotency in cancer studies.Rep Pract Oncol Radiother. 2018 May-Jun;23(3):207-214. doi: 10.1016/j.rpor.2018.04.005. Epub 2018 Apr 24. Rep Pract Oncol Radiother. 2018. PMID: 29760595 Free PMC article. Review.
-
Establishment of a novel patient-derived Ewing's sarcoma cell line, NCC-ES1-C1.In Vitro Cell Dev Biol Anim. 2018 Dec;54(10):770-778. doi: 10.1007/s11626-018-0302-2. Epub 2018 Oct 15. In Vitro Cell Dev Biol Anim. 2018. PMID: 30324244
References
LinkOut - more resources
Full Text Sources
Other Literature Sources
Research Materials
Miscellaneous

