. 2015 Mar 25:6:6626.
doi: 10.1038/ncomms7626.

Generation and expansion of highly pure motor neuron progenitors from human pluripotent stem cells

Affiliations

Generation and expansion of highly pure motor neuron progenitors from human pluripotent stem cells

Zhong-Wei Du et al. Nat Commun. .

Abstract

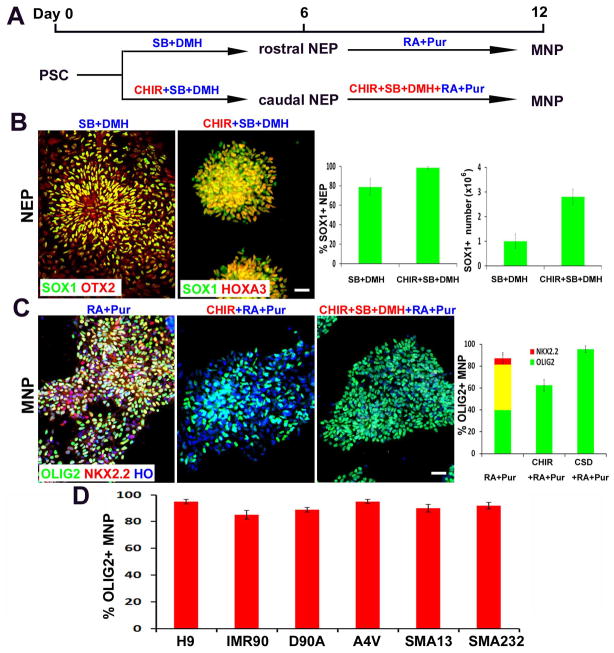
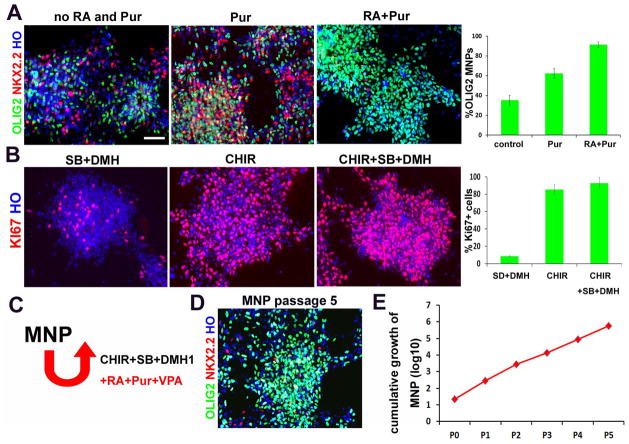
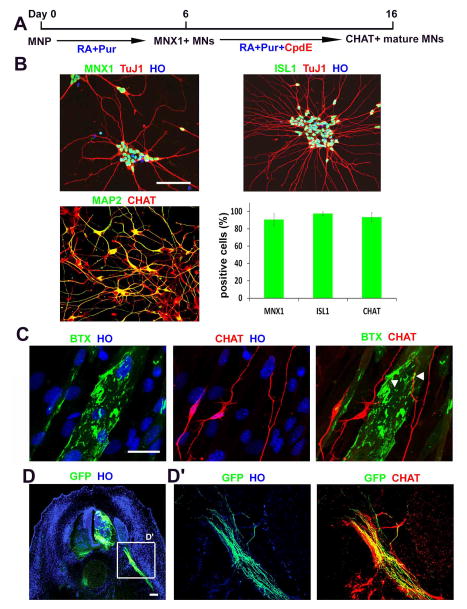
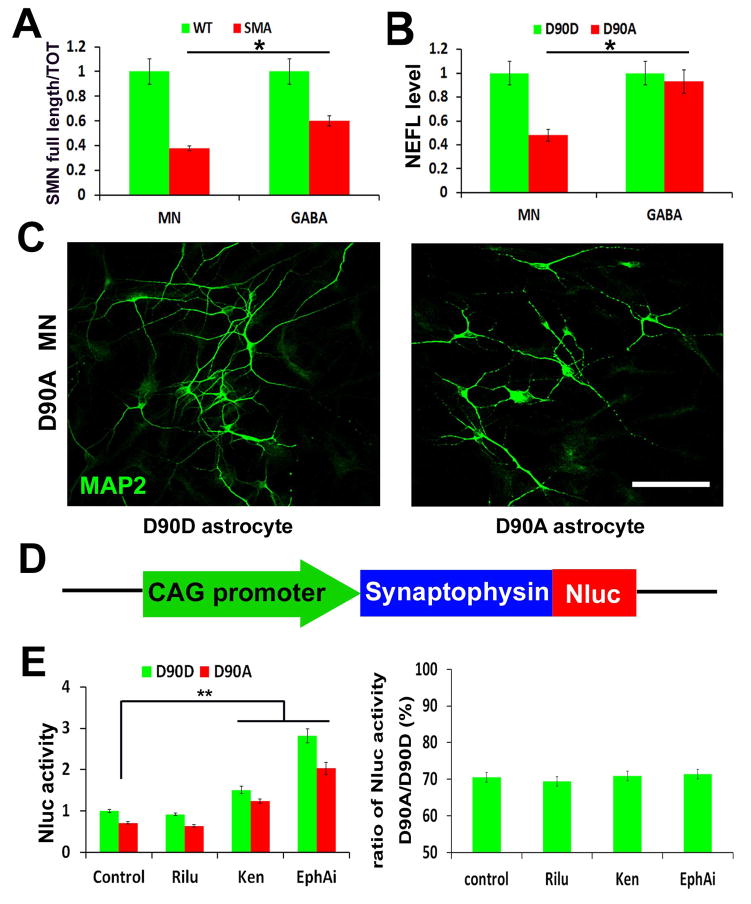
Human pluripotent stem cells (hPSCs) have opened new opportunities for understanding human development, modelling disease processes and developing new therapeutics. However, these applications are hindered by the low efficiency and heterogeneity of cell types, such as motorneurons (MNs), differentiated from hPSCs as well as our inability to maintain the potency of lineage-committed progenitors. Here by using a combination of small molecules that regulate multiple signalling pathways, we develop a method to guide human embryonic stem cells to a near-pure population (>95%) of motor neuron progenitors (MNPs) in 12 days, and an enriched population (>90%) of functionally mature MNs in an additional 16 days. More importantly, the MNPs can be expanded for at least five passages so that a single MNP can be amplified to 1 × 10(4). This method is reproducible in human-induced pluripotent stem cells and is applied to model MN-degenerative diseases and in proof-of-principle drug-screening assays.


Conflict of interest statement

Competing financial interests

The authors declare no competing financial interests.

Figures

Figure 1
Figure 1. Generation of highly-pure population of MNPs from hPSCs
(A) Schematics showing the time course and small molecule cocktail for hPSC differentiation into MNPs. (B) Representative images of SOX1+ NEPs after 6 days of culture in CHIR+SB+DMH vs. SB+DMH condition. The regional identity (OTX2+ vs. HOXA3+) were stained. Scale bars: 50μm. Quantification of SOX1+ NEP percentage and number is shown on right (>500 cells from random fields were manually counted in each condition). The bar graph shows the mean±s.d. (n=3 in each condition). (C) Representative images of pure MNPs at Day12 under different conditions, which express OLIG2 (green) but not NKX2.2 (red). Scale bars: 50μm. Quantification of OLIG2+, NKX2.2+ and OLIG2+/NKX2.2+ cells is shown on right (>500 cells from random fields were manually counted in each condition). The bar graph shows the mean±s.d. (n=3 in each condition). (D) The efficiency of OLIG2+ MNP differentiation from multiple hPSC lines (>500 cells from random fields were manually counted in each cell line). The bar graph shows the mean±s.d. (n=3 in each cell line).
Figure 2
Figure 2. Expansion of OLIG2+ MNPs
(A) Representative images of pure OLIG2+ (green)/NKX2.2+ (red) MNPs maintained under different conditions. Scale bars: 50μm. Quantification of OLIG2+/NKX2.2− cells is shown on right (>500 cells from random fields were manually counted in each condition). The bar graph shows the mean±s.d. (n=3 in each condition). (B) Representative images of Ki67+ (red) proliferating progenitors maintained under different conditions. Scale bars: 50μm. Quantification of Ki67+ cells is shown on right (>500 cells from random fields were manually counted in each condition). The bar graph shows the mean±s.d. (n=3 in each condition). (C) Schematics showing the expansion of MNPs with the combination of small molecules. (D) Representative images of MNPs expanded for at least 5 passages yet maintained the OLIG2 (green) expression. (E) Cumulative hPSC-derived MNP counts over five passages (passages denoted p1–p5). One 6-well of cells were manually counted in each passage, and total cell numbers were calculated by times passage ratio.
Figure 3
Figure 3. MNPs differentiate into enriched functional MNs
(A) Schematics showing the time course and small molecule cocktail for MNP differentiation into mature MNs. (>500 cells from random fields were manually counted in each condition). The bar graph shows the mean±s.d. (n=3 in group). (B) Representative images of MNs showing MNX1+, ISL1+ (green) and CHAT+ (red) on. Scale bars: 50μm. Quantification of MNX1+, ISL1+ and CHAT+ is shown (C) MNs, stained with CHAT antibody (red), formed neuromuscular junctions, labelled with bungarotoxin (BTX, green), when co-cultured with myotubes. Scale bars: 100μm. (D) Representative image of xenotransplantation of GFP labeled human MNs into a developing chicken embryo. Scale bars: 50μm. (D′) magnification of the field showing that human MN axons (GFP+/CHAT+) projected ventrally through the ventral roots.
Figure 4
Figure 4. Enriched MNs for disease modelling and screening
(A) The qPCR quantification of the ratio of full length SMN vs. total SMN in wildtype (WT) and SMA disease MNs, GABA neurons. The bar graph shows the mean±s.e.m. (*p<0.05, t-test, n= 3 in each group). (B) The qPCR quantification of NEFL mRNA level in ALS (D90A) and corrected (D90D) MNs, GABA neurons. The bar graph shows the mean±s.e.m. (*p<0.05, t-test, n= 3 in each group). (C) Representative image of ALS (D90A) MNs when culturing on ALS (D90A) astrocytes and corrected (D90D) astrocytes, which showed neurite fragmentation and reduced neurite length. Scale bars: 50μm. (D) Schematics of SYP-Nluc reporter. (E) Quantification of Nluc activity (left panel) and ratio (right panel) of SYP-Nluc reporter MNs on ALS (D90A) and corrected (D90D) astrocytes, when comparing between the control, Riluzole (Rilu), Kenpaullone (Ken) and EphA inhibitor (EphAi) groups. The bar graph shows the mean±s.e.m. (** P<0.01, Tukey’s test, n= 8 in each group).

References

    1. Grskovic M, Javaherian A, Strulovici B, Daley GQ. Induced pluripotent stem cells--opportunities for disease modelling and drug discovery. Nat Rev Drug Discov. 2011;10:915–929. - PubMed
    1. Han SS, Williams LA, Eggan KC. Constructing and deconstructing stem cell models of neurological disease. Neuron. 2011;70:626–644. - PubMed
    1. Goldman SA, Nedergaard M, Windrem MS. Glial progenitor cell-based treatment and modeling of neurological disease. Science. 2012;338:491–495. - PMC - PubMed
    1. Ma F, et al. Generation of functional erythrocytes from human embryonic stem cell-derived definitive hematopoiesis. Proc Natl Acad Sci U S A. 2008;105:13087–13092. - PMC - PubMed
    1. Kattman SJ, et al. Stage-specific optimization of activin/nodal and BMP signaling promotes cardiac differentiation of mouse and human pluripotent stem cell lines. Cell Stem Cell. 2011;8:228–240. - PubMed

Publication types

MeSH terms