. 2015 Mar 25:4:e06557.
doi: 10.7554/eLife.06557.

Lpcat3-dependent production of arachidonoyl phospholipids is a key determinant of triglyceride secretion

Affiliations

Lpcat3-dependent production of arachidonoyl phospholipids is a key determinant of triglyceride secretion

Xin Rong et al. Elife. .

Abstract

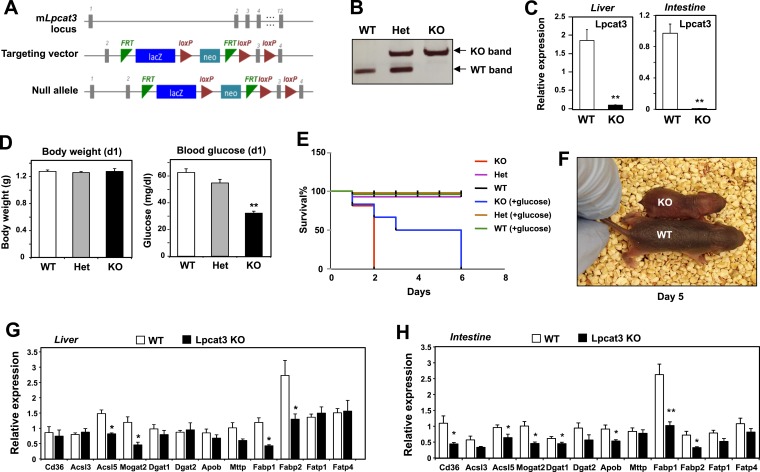
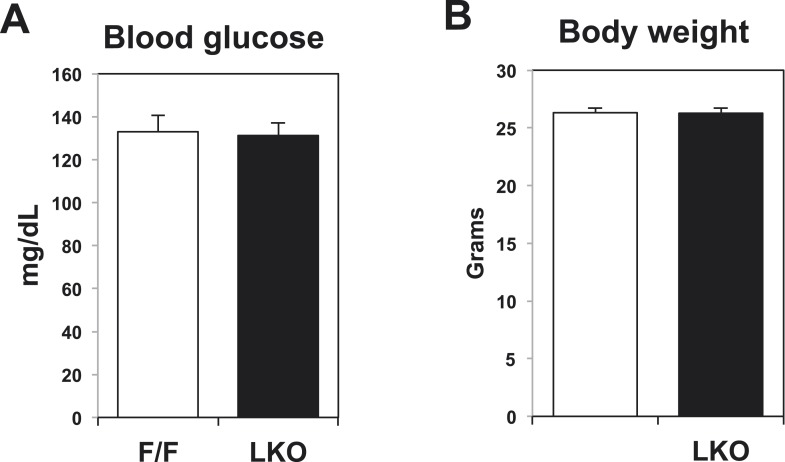
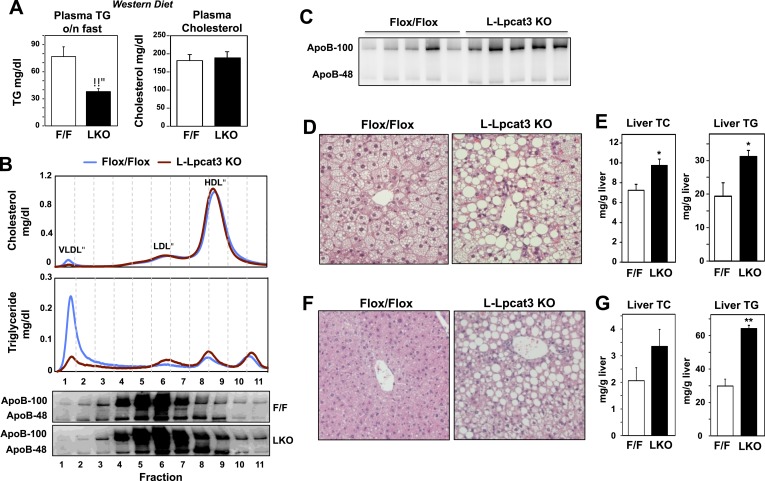
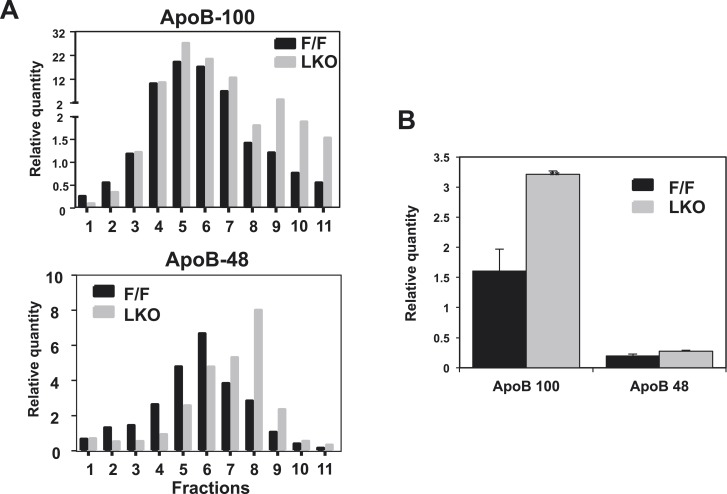
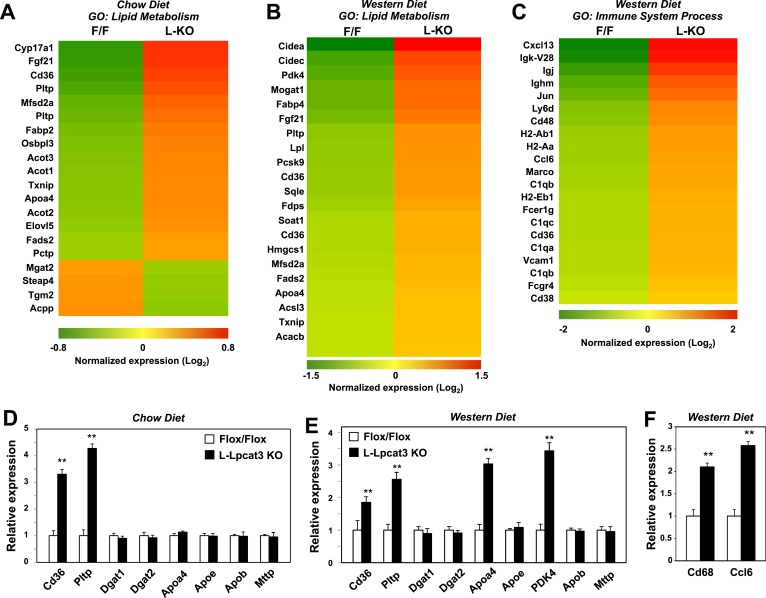
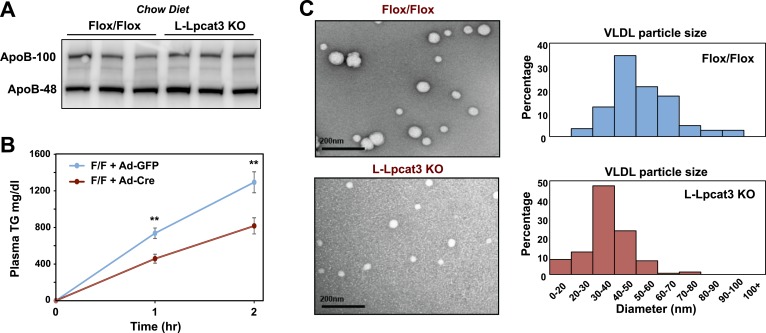
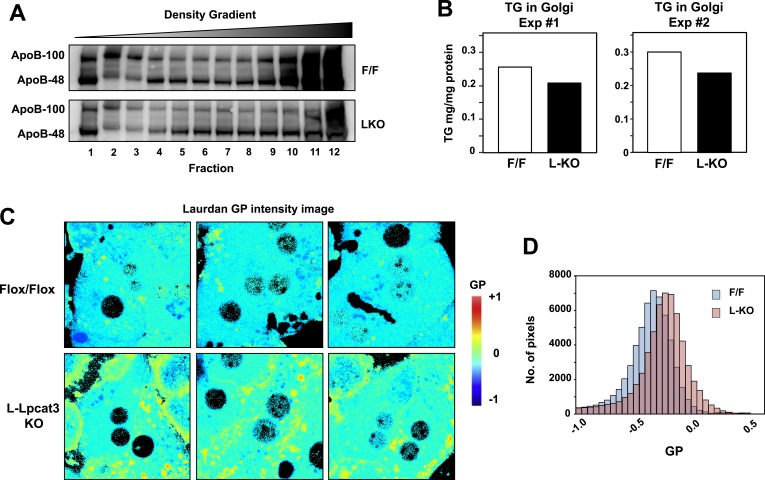
The role of specific phospholipids (PLs) in lipid transport has been difficult to assess due to an inability to selectively manipulate membrane composition in vivo. Here we show that the phospholipid remodeling enzyme lysophosphatidylcholine acyltransferase 3 (Lpcat3) is a critical determinant of triglyceride (TG) secretion due to its unique ability to catalyze the incorporation of arachidonate into membranes. Mice lacking Lpcat3 in the intestine fail to thrive during weaning and exhibit enterocyte lipid accumulation and reduced plasma TGs. Mice lacking Lpcat3 in the liver show reduced plasma TGs, hepatosteatosis, and secrete lipid-poor very low-density lipoprotein (VLDL) lacking arachidonoyl PLs. Mechanistic studies indicate that Lpcat3 activity impacts membrane lipid mobility in living cells, suggesting a biophysical basis for the requirement of arachidonoyl PLs in lipidating lipoprotein particles. These data identify Lpcat3 as a key factor in lipoprotein production and illustrate how manipulation of membrane composition can be used as a regulatory mechanism to control metabolic pathways.

Keywords: cell biology; human biology; lipoprotein; medicine; mouse; nuclear receptor; phospholipid.


Conflict of interest statement

SGY: Reviewing editor, eLife.

PT: Reviewing editor, eLife.

The other authors declare that no competing interests exist.

Figures

Figure 1.
Figure 1.. Generation and analysis of global Lpcat3 knockout mice.
(A) Strategy for generating global Lpcat3 knockout mice. A ‘knock-out first/conditional-ready’ gene-targeting vector was used to generate targeted cells. A gene-trap cassette is located between the two FRT sites. LacZ, β-galactosidase; neo, neomycin phosphotransferase II. (B) Genotyping of Lpcat3+/+ (WT), Lpcat3+/− (Het), and Lpcat3−/− (KO) mice. Genomic DNA was prepared from tail biopsies, and PCR products were separated on a 1% agarose gel. (C) Expression of Lpcat3 in liver and small intestine of newborn Lpcat3−/− and Lpcat3+/+ pups. Gene expression was quantified by real-time PCR (n ≥ 5/group). Values are means ± SEM. (D) The body weight and blood glucose of Lpcat3+/+ (WT), Lpcat3−/+ (Het), and Lpcat3−/− (KO) newborn pups (n ≥ 8/group). Values are means ± SEM. (E) Kaplan–Meier survival curve of Lpcat3+/+ (WT), Lpcat3−/+ (Het) and Lpcat3−/− (KO) pups after birth (n ≥ 20 mice/group). The neonatal lethality can be delayed by injection of 50 μl 10% glucose solution once per day after born. 5 Lpcat3+/+ (WT), 9 Lpcat3−/+ (Het) and 6 Lpcat3−/− (KO) mice were used in the rescue experiment. (F) Representative photograph of Lpcat3+/+ (WT) and Lpcat3−/− (KO) pups after 5 days of glucose injections. (GH) Gene expression in livers (G) and small intestines (H) of Lpcat3+/+ (WT) and Lpcat3−/− (Lpcat3 KO) newborn pups. Gene expression was quantified by real-time PCR (n ≥ 5/group). Values are means ± SEM. Statistical analysis was performed using Student's t-test (C, G and H) and one-way ANOVA with Bonferroni post-hoc tests (D). *p < 0.05; **p < 0.01. DOI: http://dx.doi.org/10.7554/eLife.06557.003
Figure 2.
Figure 2.. Altered triglyceride (TG) metabolism in liver-specific Lpcat3 knockout mice.
(A) Strategy for generating tissue-specific Lpcat knockout mice. Lpcat3−/+ mice carrying the conditional-ready knockout allele were mated with Flpe transgenic mice to generate the Lpcat3fl/fl mice. Lpcat3fl/fl mice were bred with tissue-specific Cre transgenic mice to generate tissue-specific Lpcat3 knockout mice. (B) Expression of Lpcat family members in liver of Lpcat3fl/fl (F/F) and Lpcat3fl/fl Albumin-Cre (L-KO) mice fed a chow diet. Gene expression was quantified by real-time PCR (n ≥ 6/group) (left panel). Primary hepatocytes from Lpcat3fl/fl (F/F) and Lpcat3fl/fl Albumin-Cre (L-KO) mice were treated overnight with 1 μM LXR agonist GW3965 (GW). Lpcat3 expression was quantified by real-time PCR (right panel). Ct values in Lpcat3fl/fl liver samples were shown. Values are means ± SEM. (C) Plasma lipid levels in chow diet-fed Lpcat3fl/fl (F/F) and Lpcat3fl/fl Albumin-Cre (L-KO) mice under fed (ad libitum) or overnight (o/n) fasting (n ≥ 8/group). Plasma levels of cholesterol and NEFA were measured after an overnight fast. Values are means ± SEM. (D) Plasma was harvested from chow diet-fed Lpcat3fl/fl (F/F) and Lpcat3fl/fl Albumin-Cre (L-KO) mice after an overnight fast. ApoB protein was analyzed by western blotting and quantified (Figure 2—figure supplement 2B). (E) Plasma from Lpcat3fl/fl (F/F) and Lpcat3fl/fl Albumin-Cre (L-Lpcat3-KO) mice fasted overnight was pooled (n = 5). Lipoprotein profiles were analyzed by fast protein liquid chromatography (FPLC) (upper panel). ApoB protein in each corresponding fraction was analyzed by western blot (lower panel) and quantified (Figure 2—figure supplement 2A). (F) Lipid contents in livers of chow diet-fed Lpcat3fl/fl (F/F) and Lpcat3fl/fl Albumin-Cre (L-KO) mice fasted overnight (n ≥ 8/group). Values are means ± SEM. (G) Hematoxylin and eosin staining of liver sections from chow-fed Lpcat3fl/fl (F/F) and Lpcat3fl/fl Albumin-Cre (L-KO) mice after an overnight fast. (H) Liver expression of Lpcat3 (left panel) and plasma TG levels (right panel) in Lpcat3fl/fl mice 3 weeks after being injected with an adenovirus encoding GFP or Cre. Mice were sacrificed under fed conditions (ad libitum) or after overnight fasting (o/n) (n ≥ 6/group). Gene expression was measured by real-time. Values are means ± SEM. Statistical analysis was performed with a Student's t-test (B, C, F, H). *p < 0.05; **p < 0.01. DOI: http://dx.doi.org/10.7554/eLife.06557.005
Figure 2—figure supplement 1.
Figure 2—figure supplement 1.. Blood glucose levels and body weight in control and liver-specific Lpcat3 KO mice (LKO).
DOI: http://dx.doi.org/10.7554/eLife.06557.006
Figure 2—figure supplement 2.
Figure 2—figure supplement 2.. Quantification of western blots.
Immunoblot results of apoB-100 and apoB-48 proteins in (A) Figure 2E and (B) Figure 2D were quantified by densitometry. DOI: http://dx.doi.org/10.7554/eLife.06557.007
Figure 3.
Figure 3.. Dietary challenge accentuates metabolic phenotypes in liver-specific Lpcat3 knockout mice.
(A) Plasma lipids of Lpcat3fl/fl (F/F) and Lpcat3fl/fl Albumin-Cre (L-KO) mice fed on a western diet for 9 weeks. Plasma was collected from mice fasted for 6 hr (n ≥ 8/group). Values are means ± SEM. (B) Plasma samples same as in (A) were pooled (n = 5). Lipoprotein profile was analyzed by FPLC (upper panel). ApoB protein in each fraction was analyzed by western blot (lower panel) and quantified (Figure 3—figure supplement 1A). (C) ApoB protein in plasma samples same as in (A) was analyzed by western blot and quantified (Figure 3—figure supplement 1B). (DE) Hematoxylin and eosin staining (D) and lipid contents (E) of livers from western diet-fed Lpcat3fl/fl (F/F) and Lpcat3fl/fl Albumin-Cre (L-KO) mice. Values are means ± SEM. (FG) Hematoxylin and eosin staining (F) and lipid contents (G) of livers from high sucrose diet-fed Lpcat3fl/fl (F/F) and Lpcat3fl/fl Albumin-Cre (L-KO) mice. Mice were fed on diet for 3 weeks and sacrificed after 6 hr fasting. Values are means ± SEM. Statistical analysis was performed using Student's t-test (A, E and G). *p < 0.05; **p < 0.01. DOI: http://dx.doi.org/10.7554/eLife.06557.009
Figure 3—figure supplement 1.
Figure 3—figure supplement 1.. Quantification of western blots.
Immunoblot blot results of apoB-100 and apoB-48 proteins in (A) Figure 3B and (B) Figure 3C were quantified by densitometry. DOI: http://dx.doi.org/10.7554/eLife.06557.010
Figure 4.
Figure 4.. Altered TG metabolism in intestine-specific Lpcat3 knockout mice.
(A) Induction of Lpcat3 mRNA expression in duodenum of mice treated with 40 mg/kg/day GW3956 by oral gavage for 3 days (n = 5/group). Gene expression was measured by real-time PCR. Values are means ± SEM. (B) Representative photograph and body weight of newborn Lpcat3fl/fl Villin-cre (IKO) and control Lpcat3fl/fl (F/F) pups (n = 5/group for body weight measurement). Values are means ± SEM. (C) Representative photograph and body weight of 1 week-old Lpcat3fl/fl Villin-cre (IKO) and control Lpcat3fl/fl (F/F) pups (n ≥ 6/group for body weight measurement). Values are means ± SEM. (D) Expression of Lpcat family members in 1 week-old Lpcat3fl/fl (F/F) and Lpcat3fl/fl Villin-cre (IKO) duodenum measured by real-time PCR (n ≥ 6/group). Ct values of F/F samples were shown. Values are means ± SEM. (E) Blood glucose, plasma lipids and insulin levels in 1 week-old Lpcat3fl/fl (F/F) and Lpcat3fl/fl Villin-cre (IKO) pups (n ≥ 6/group). Values are means ± SEM. (F) Hematoxylin and eosin staining of intestines from 1 week-old Lpcat3fl/fl (WT) and Lpcat3fl/fl Villin-cre (IKO) pups. (G) Expression of genes in duodenum of 1 week-old Lpcat3fl/fl (WT) and Lpcat3fl/fl Villin-cre (IKO) pups. Gene expression was measured by real-time PCR (n ≥ 6/group). Values are means ± SEM. Statistical analysis was performed using Student's t-test (A, B, D, E and F). *p < 0.05; **p < 0.01. DOI: http://dx.doi.org/10.7554/eLife.06557.011
Figure 5.
Figure 5.. Lpcat3 is required for the incorporation of arachidonate into phosphatidylcholine (PC) in mouse liver and very low-density lipoprotein (VLDL).
(AB) ESI-MS/MS analysis of the abundance of PC species in livers from Lpcat3fl/fl (Flox/Flox) and Lpcat3fl/fl Albumin-Cre (L-Lpcat3 KO) mice fed on a chow diet (A) and a western diet (B) (n ≥ 5/group). (C) ESI-MS/MS analysis of the abundance of PC species in plasma VLDL fraction from Lpcat3fl/fl (fl/fl) and Lpcat3fl/fl Albumin-Cre (L-Lpcat3 KO) mice fed on a chow diet. Plasma was harvested from mice after overnight fasting. VLDL fractions were pooled from 5 mice/group. (D) GC-FID analysis of the abundance of arachidonoyl acyl chain in triglyceride (TAG) in livers from Lpcat3fl/fl (F/F) and Lpcat3fl/fl Albumin-Cre (L-KO) mice fed on a chow diet. Statistical analysis was performed using Student's t-test. Values are means ± SEM. *p < 0.05; **p < 0.01. DOI: http://dx.doi.org/10.7554/eLife.06557.013
Figure 5—figure supplement 1.
Figure 5—figure supplement 1.. Lpcat3 is required for the incorporation of arachidonate into phosphatidylethanolamine in mouse liver.
(AB) ESI-MS/MS analysis of the abundance of phosphatidlyethanolamine (PE) species in livers from Lpcat3fl/fl (Flox/Flox) and Lpcat3fl/fl Albumin-Cre (L-Lpcat3 KO) mice fed on a chow diet (A) and a western diet (B). DOI: http://dx.doi.org/10.7554/eLife.06557.014
Figure 6.
Figure 6.. Analysis of cholesteryl ester and lysoPC species in L-Lpcat3 KO mice.
(AB) ESI-MS/MS analysis of the abundance of cholesteryl ester (A) and lysophosphatidylcholine (LysoPC) (B) species in livers of Lpcat3fl/fl (Flox/Flox) and Lpcat3fl/fl Albumin-Cre (L-Lpcat3 KO) mice fed on a chow diet (n ≥ 5/group). (CD) ESI-MS/MS analysis of the abundance of cholesteryl ester (C) and lysophosphatidylcholine (LysoPC) (D) species in livers of Lpcat3fl/fl (Flox/Flox) and Lpcat3fl/fl Albumin-Cre (L-Lpcat3 KO) mice fed on a western diet (n ≥ 5/group). Statistical analysis was performed using Student's t-test. Values are means ± SEM. *p < 0.05; **p < 0.01. DOI: http://dx.doi.org/10.7554/eLife.06557.015
Figure 7.
Figure 7.. Altered gene expression linked to lipid metabolism and inflammation in liver-specific Lpcat3 knockout mice.
(A) Gene expression in livers of Lpcat3fl/fl (F/F) and Lpcat3fl/fl Albumin-Cre (L-KO) mice fed on a chow diet was analyzed by Affymetrix arrays. Select genes under the gene ontology (GO) term ‘lipid metabolism’ are presented by heatmap. Samples from 5 mice/group were pool for analysis. (BC) Gene expression in livers of Lpcat3fl/fl (F/F) and Lpcat3fl/fl Albumin-Cre (L-KO) mice fed on a western diet for 9 weeks was analyzed by Affymetrix arrays. Select genes under the GO term ‘lipid metabolism’ (B) and ‘immune system process’ (C) are presented by heatmap. Samples from 5 mice/group were pool for analysis. (D) Expression of selective lipid metabolism genes in livers of Lpcat3fl/fl (Fl/Fl) and Lpcat3fl/fl Albumin-Cre (L-Lpcat3 KO) mice fed on a chow diet was analyzed by real-time PCR (n ≥ 5/group). Values are means ± SEM. (EF) Expression of selective lipid metabolism (E) and inflammation (F) genes in livers of Lpcat3fl/fl (Fl/Fl) and Lpcat3fl/fl Albumin-Cre (L-Lpcat3 KO) mice fed on a western diet was analyzed by real-time PCR (n ≥ 5/group). Values are means ± SEM. Statistical analysis was performed using Student's t-test (D, E and F). **p < 0.01. DOI: http://dx.doi.org/10.7554/eLife.06557.016
Figure 7—figure supplement 1.
Figure 7—figure supplement 1.. Chronic deletion of Lpcat3 does not induce unfolded protein response downstream gene expression.
(A) Gene expression in livers of Lpcat3fl/fl (F/F) and Lpcat3fl/fl Albumin-Cre (L-KO) mice fed on a chow diet was analyzed by Affymetrix arrays. Select ER stress marker genes are presented by heatmap. Samples from 5 mice/group were pool for analysis. (B) Gene expression in livers of Lpcat3fl/fl (F/F) and Lpcat3fl/fl Albumin-Cre (L-KO) mice fed on a western diet was analyzed by Affymetrix arrays. Select ER stress marker genes are presented by heatmap. Samples from 5 mice/group were pool for analysis. DOI: http://dx.doi.org/10.7554/eLife.06557.017
Figure 8.
Figure 8.. Loss of Lpcat3 from liver impairs hepatic TG secretion.
(A) ApoB protein in livers from Lpcat3fl/fl (Flox/Flox) and Lpcat3fl/fl Albumin-Cre (L-Lpcat3 KO) mice fed on a chow diet was analyzed by western blot (n = 3). (B) VLDL-TG secretion in Lpcat3fl/fl mice transduced with adenoviral expressed Cre (Ad-Cre), compared to control GPF (Ad-GFP) for 4 weeks. Mice were fasted for 6 hr followed by intravenous injection of tyloxapol. Plasma TG was measured at indicated durations after tyloxapol injection. Values are means ± SEM. (C) Plasma VLDL particle size in Lpcat3fl/fl Albumin-Cre mice. Isolated VLDL particles from Lpcat3fl/fl (Fl/Fl) and Lpcat3fl/fl Albumin-Cre (L-Lpcat3 KO) mice fed on a western diet were stained with 2.0% uranyl acetate and visualized by electron microscopy (EM) (left) and their size quantified (right). Statistical analysis was performed using two-way ANOVA with Bonferroni post hoc tests (B). **p < 0.01. DOI: http://dx.doi.org/10.7554/eLife.06557.018
Figure 9.
Figure 9.. Reduced nascent lipoprotein particle size in the lumen of Golgi and secretory vesicles in Lpcat3-deficient liver.
EM of imidazole-stained liver sections. Lpcat3fl/fl (Fl/Fl) and Lpcat3fl/fl Albumin-Cre (L-Lpcat3 KO) mice were fasted for 6 hr. Samples were fixed and processed as described in the methods. Arrowheads indicate nascent lipoprotein particles. DOI: http://dx.doi.org/10.7554/eLife.06557.019
Figure 9—figure supplement 1.
Figure 9—figure supplement 1.. Loss of Lpcat3 in liver does not alter membrane structure in ER and mitochondria.
(A) EM of imidazole-stained liver sections. Arrowheads indicate nascent lipoprotein particles in smooth ER lumen. (B) EM of imidazole-stained liver sections. Mitochondria are shown. (C) EM of imidazole-stained liver sections. Rough ER is shown. DOI: http://dx.doi.org/10.7554/eLife.06557.020
Figure 10.
Figure 10.. Lpcat3 activity regulates membrane lipid mobility and apoB lipidation in hepatocytes.
(A) The distribution of apoB-containing lipoproteins in the Golgi fractions isolated from livers of Lpcat3fl/fl (F/F) and Lpcat3fl/fl Albumin-Cre (LKO) mice. Golgi luminal contents were subject to a density gradient ultracentrifugation. 12 fractions from the gradient were harvested from top to bottom and analyzed by western blot. (B) Triglyceride contents of the Golgi fractions isolated from livers of Lpcat3fl/fl (F/F) and Lpcat3fl/fl Albumin-Cre (LKO) mice. Results from two representative experiments were shown. (C) Live primary hepatocytes from Lpcat3fl/fl (Flox/Flox) and Lpcat3fl/fl Albumin-Cre (L-Lpcat3 KO) mice were stained with laurdan. The laurdan emission spectrum was captured by a 2-photon laser-scan microscope. Generalized polarization (GP) was calculated from the emission intensities obtained from images. Higher GP value indicates that membranes are more ordered and less dynamic. The GP value of each pixel was used to generate a pseudocolor GP image. (D) The binary histograms of the GP distribution of the GP images (n = 4). The size of the GP binary is 0.05. DOI: http://dx.doi.org/10.7554/eLife.06557.021
Figure 11.
Figure 11.. Lpcat3 is required for LXR-dependent VLDL TG secretion from liver.
Plasma lipoprotein profile from flox/flox and L-Lpcat3 mice gavaged with LXR agonist GW 3965 (20 mg/kg) for 2 days. Pooled plasma (5 mice/group) was analyzed by FPLC. Increases in VLDL TG were calculated based on the area under the curve. DOI: http://dx.doi.org/10.7554/eLife.06557.022
Figure 12.
Figure 12.. Schematic illustration of the role of the LXR-Lpcat3 pathway in VLDL lipidation.
Activation of LXRs promotes the incorporation of arachidonate into intracellular membranes through the induction of Lpcat3 expression. This change in membrane composition creates a dynamic membrane environment that facilitates the transfer of TG synthesized on ER and/or in cytosolic LD to nascent apoB–containing lipoproteins particles, leading to the efficient lipidation of apoB–containing lipoproteins. DOI: http://dx.doi.org/10.7554/eLife.06557.023

References

    1. Abumrad NA, Davidson NO. Role of the gut in lipid homeostasis. Physiological Reviews. 2012;92:1061–1085. doi: 10.1152/physrev.00019.2011. - DOI - PMC - PubMed
    1. Ågren JJ, Kurvinen JP, Kuksis A. Isolation of very low density lipoprotein phospholipids enriched in ethanolamine phospholipids from rats injected with Triton WR 1339. Biochimica et Biophysica Acta. 2005;1734:34–43. doi: 10.1016/j.bbalip.2005.02.001. - DOI - PubMed
    1. Angermuller S, Fahimi HD. Imidazole-buffered osmium tetroxide: an excellent stain for visualization of lipids in transmission electron microscopy. The Histochemical Journal. 1982;14:823–835. doi: 10.1007/BF01033631. - DOI - PubMed
    1. Bligh EG, Dyer WJ. A rapid method of total lipid extraction and purification. Canadian Journal of Biochemistry and Physiology. 1959;37:911–917. doi: 10.1139/o59-099. - DOI - PubMed
    1. Bowden JA, Shao F, Albert CJ, Lally JW, Brown RJ, Procknow JD, Stephenson AH, Ford DA. Electrospray ionization tandem mass spectrometry of sodiated adducts of cholesteryl esters. Lipids. 2011;46:1169–1179. doi: 10.1007/s11745-011-3609-2. - DOI - PMC - PubMed

Publication types

MeSH terms