. 2015 Mar 25;10(3):e0122192.
doi: 10.1371/journal.pone.0122192. eCollection 2015.

Towards anatomic scale agent-based modeling with a massively parallel spatially explicit general-purpose model of enteric tissue (SEGMEnT_HPC)

Affiliations

Towards anatomic scale agent-based modeling with a massively parallel spatially explicit general-purpose model of enteric tissue (SEGMEnT_HPC)

Robert Chase Cockrell et al. PLoS One. .

Abstract

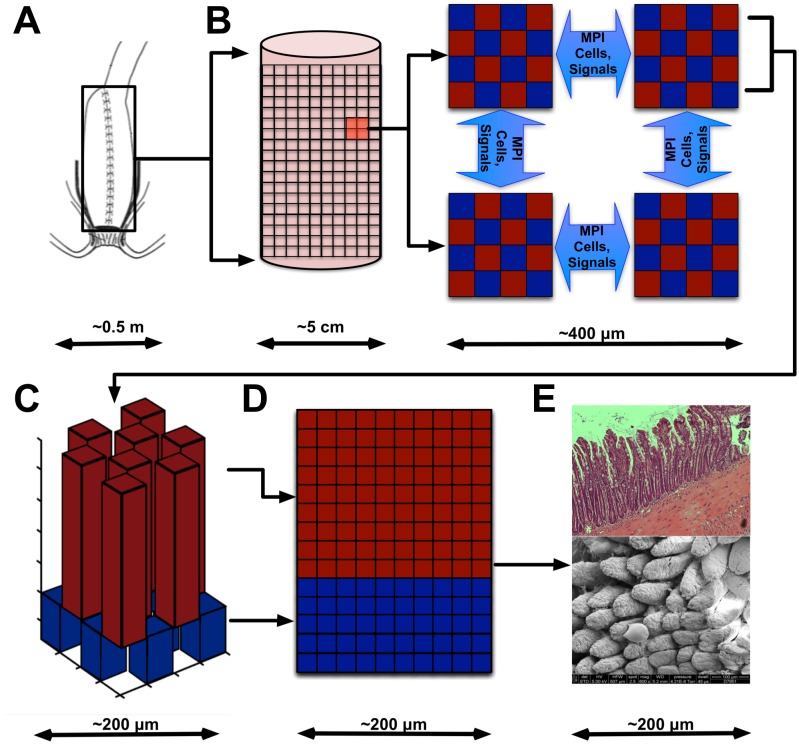
Perhaps the greatest challenge currently facing the biomedical research community is the ability to integrate highly detailed cellular and molecular mechanisms to represent clinical disease states as a pathway to engineer effective therapeutics. This is particularly evident in the representation of organ-level pathophysiology in terms of abnormal tissue structure, which, through histology, remains a mainstay in disease diagnosis and staging. As such, being able to generate anatomic scale simulations is a highly desirable goal. While computational limitations have previously constrained the size and scope of multi-scale computational models, advances in the capacity and availability of high-performance computing (HPC) resources have greatly expanded the ability of computational models of biological systems to achieve anatomic, clinically relevant scale. Diseases of the intestinal tract are exemplary examples of pathophysiological processes that manifest at multiple scales of spatial resolution, with structural abnormalities present at the microscopic, macroscopic and organ-levels. In this paper, we describe a novel, massively parallel computational model of the gut, the Spatially Explicitly General-purpose Model of Enteric Tissue_HPC (SEGMEnT_HPC), which extends an existing model of the gut epithelium, SEGMEnT, in order to create cell-for-cell anatomic scale simulations. We present an example implementation of SEGMEnT_HPC that simulates the pathogenesis of ileal pouchitis, and important clinical entity that affects patients following remedial surgery for ulcerative colitis.


Conflict of interest statement

Competing Interests: The authors have declared that no competing interests exist.

Figures

Fig 1
Fig 1
Panel A presents an illustration of anatomic configuration of the ileal “J-pouch.” Panel B illustrates how the j-pouch is modeled as a cylinder and distributed to the computational processes. Panel C shows how crypt and villus topologies are represented on a single processor. Panel D shows how these topologies are unwrapped to form a series of two-dimensional grids. This panel shows a congruent surface of a single face of a villus-crypt complex, where the villus component is shaded in red, and the crypt component shaded in blue. Note that the “central” portions of the villi and crypts are offset, leading to an alternating pattern of rectangular prisms formed by the planes of the two-dimensional grids. The portions of the grids that make up the tip of the villus and the valley of the crypt are omitted from this depiction. Finally, Panel E displays images of the actual biological system represented by SEGMEnT_HPC, seen in cross-sectional standard histology above and via scanning electron microscopy below.
Fig 2
Fig 2. Signaling networks instantiated in SEGMEnT.
Morphogen signaling pathway components are shaded in blue; inflammatory signaling components are shaded in orange. Stimulation/production relationships are depicted by green connectors; inhibitory relationships are seen as red connectors. The signaling network comprises the Wingless-related integration site (Wnt), Bone Morphogenetic Protein (BMP), Phosphotase and tensin homolog/phosphoinositide 3-kinase (PTEN/PI3K), Sonic Hedgehog Homolog (Hh), Tumor Necrosis Factor (TNF)-α, Interferon (IFN)-γ, RIP Kinase, nuclear factor kappa-light-chain-enhancer of activated B cells (NF-κB), Janus Kinase (JAK), Signal transducer and activator of transcription 3 (Stat3), and reactive oxygen species (ROSs), and Interleukin (IL) 6,10,13, and 15 signaling pathways.
Fig 3
Fig 3. Scaling Curves.
Panel A displays the weak scaling curve for SEGMEnT_HPC. Compute time per iteration is plotted against the number of processing cores simultaneously simulating ~100,000 cells. Panel B displays the strong scaling curve for SEGMEnT_HPC. Compute time per processor is shown for ~350,000 agents on 1, 4, 16, and 64 processing cores. Each processing core simulates 256, 64, 16, and 4 crypt-villus topologies respectively.
Fig 4
Fig 4. Tissue Scaling Curves.
We present tissue scaling curves for systems of 4, 16, and 64 crypt-villus topologies. The number of processors simulating these topologies is plotted against the total CPU-time utilized by the simulation. As the number of topologies per processor is increased, SEGMEnT_HPC approaches the ideal scaling curve. The maximum number of processors tested was 12,672. SEGMEnT_HPC displays excellent potential to scale up to anatomic scale (>100,000 processing cores) while making efficient use of computational resources, as there is no evidence of significant divergence between the actual and ideal scaling curves.
Fig 5
Fig 5. Healthy Tissue Cell Population.
Total cellular population for a simulation of healthy epithelial tissue on 12,672 processing cores is plotted against simulated time. At peak population, 1,038,136,974 cells were simulated simultaneously. The time period prior to equilibrium is an initialization stage for the model. Note the initial rise in cellular populations and subsequent short oscillation are artifacts due to initialization and equilibration of the simulation.
Fig 6
Fig 6. Tissue Rendering.
Fig. 6 displays 16 mm2 tissue sample cutouts (Panels A, B, and C) and a 20 mm2 cutout (Panel D). These renderings are a post-processing output of SEGMEnT_HPC. Cellular spatial location information for select processing cores is written to file. These coordinates are then mapped from their two-dimensional grids back onto the topology that they represent. The entire simulation is not rendered due to size. Panel A presents healthy tissue in homeostasis. Panel B presents tissue with an applied circular ulcer, which spreads slightly due to inflammation. Panel C presents tissue recovery after inflammatory stimuli has been removed. Panel D presents tissue that has been exposed to an inflammatory gradient as described in the sample output section above.

References

    1. An G, Mi Q, Dutta-Moscato J, Vodovotz Y. Agent-based models in translational systems biology. Wiley Interdisciplinary Reviews: Systems Biology and Medicine. 2009; 1: 159–171. 10.1002/wsbm.45 - DOI - PMC - PubMed
    1. Bonabeau E. Agent-based modeling: methods and techniques for simulating human systems. Proc Natl Acad Sci U S A. 2002; 99 Suppl 3: 7280–7287. - PMC - PubMed
    1. Hunt CA, Kennedy RC, Kim SH, Ropella GE. Agent-based modeling: a systematic assessment of use cases and requirements for enhancing pharmaceutical research and development productivity. Wiley Interdiscip Rev Syst Biol Med. 2013; 5: 461–480. 10.1002/wsbm.1222 - DOI - PMC - PubMed
    1. An G. Dynamic knowledge representation using agent-based modeling: ontology instantiation and verification of conceptual models Systems Biology: Springer; 2009; pp. 445–468. - PubMed
    1. Engelberg JA, Datta A, Mostov KE, Hunt CA. MDCK cystogenesis driven by cell stabilization within computational analogues. PLoS Comput Biol. 2011; 7: e1002030 10.1371/journal.pcbi.1002030 - DOI - PMC - PubMed

Publication types