. 2015 Mar 25:6:6588.
doi: 10.1038/ncomms7588.

Trained immunity in newborn infants of HBV-infected mothers

Affiliations

Trained immunity in newborn infants of HBV-infected mothers

Michelle Hong et al. Nat Commun. .

Abstract

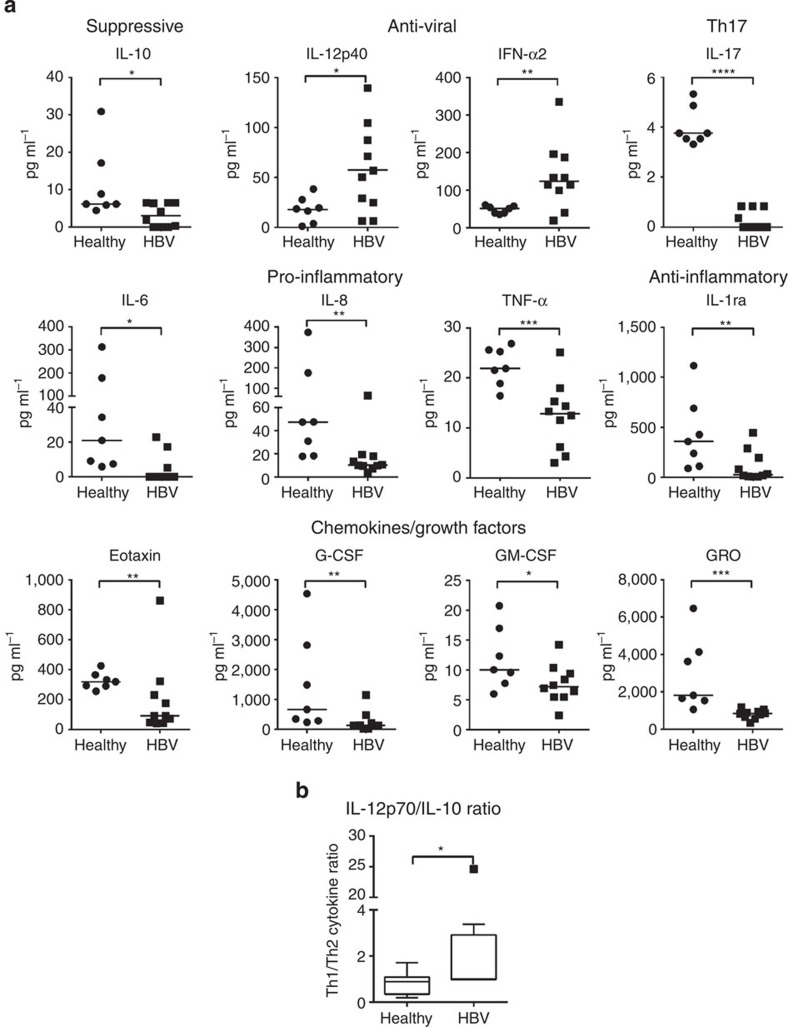
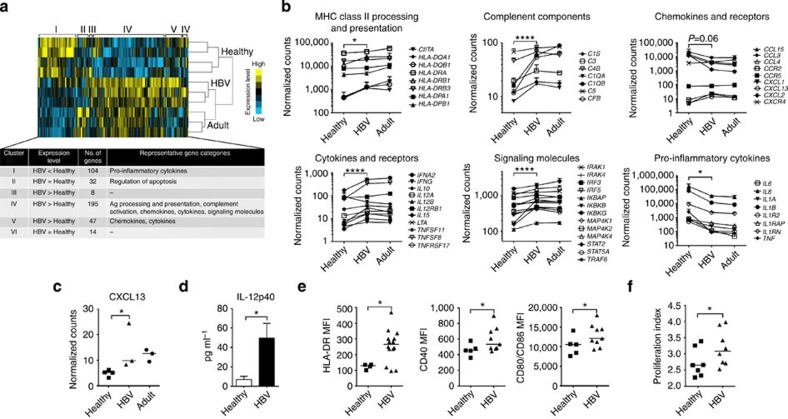
The newborn immune system is characterized by an impaired Th1-associated immune response. Hepatitis B virus (HBV) transmitted from infected mothers to newborns is thought to exploit the newborns' immune system immaturity by inducing a state of immune tolerance that facilitates HBV persistence. Contrary to this hypothesis, we demonstrate here that HBV exposure in utero triggers a state of trained immunity, characterized by innate immune cell maturation and Th1 development, which in turn enhances the ability of cord blood immune cells to respond to bacterial infection in vitro. These training effects are associated with an alteration of the cytokine environment characterized by low IL-10 and, in most cases, high IL-12p40 and IFN-α2. Our data uncover a potentially symbiotic relationship between HBV and its natural host, and highlight the plasticity of the fetal immune system following viral exposure in utero.


Figures

Figure 1
Figure 1. High levels of IL-12p40 and IFN-α2, and low levels of IL-10 and pro-inflammatory cytokines in the CB of Asian HBV+ mothers.
(a) CB plasma cytokines were determined by multiplex assay in seven healthy controls and ten HBV+ mothers. Horizontal line represents the median. (b) Ratio of Th1/Th2 cytokine (IL-12p70/IL-10) in healthy and HBV-exposed CB. P-values were calculated using Mann–Whitney test. *P<0.05, **P<0.01, ***P<0.001 and ****P<0.0001.
Figure 2
Figure 2. HBV exposure in utero enhances CB CD14+ monocyte maturation and activation.
(a) Immune gene profiling on sorted CD14+ monocytes performed using Nanostring technology. Non-supervised hierarchical clustering of the expression of 400 immune-related genes differentially expressed between CD14+ monocytes from healthy (‘Healthy’, n=4) and HBV-exposed (‘HBV’, n=3) CB. CD14+ monocytes from healthy adult peripheral blood mononuclear cells (PBMCs; ‘Adult’, n=3) were included for comparison. Table shows the comparative mRNA levels, number of genes and representative gene categories in each gene cluster. (b) The differentially expressed genes between healthy and HBV-exposed CB monocytes can be broadly grouped into six gene categories. Graphs show the mean mRNA expression (in Nanostring counts) for representative immune genes in monocytes of healthy CB, HBV-exposed CB and adult peripheral blood within these six different gene categories. P-values between healthy and HBV-exposed CB were calculated using two-way analysis of variance with Bonferroni’s post test (refer to Supplementary Table 2). (c) The mRNA expression (in Nanostring counts) of the chemokine CXCL13 in monocytes measured with Nanostring technology. (d) Sorted CD14+ monocytes from healthy (n=4) and HBV-exposed (n=3) CB were incubated with 1 μg ml−1 ssRNA40 (TLR8 agonist) for 18 h and IL-12p40 in the supernatant measured using luminex. Data show mean±s.e.m. of each group. (e) The median fluorescence intensity (MFI) expression of HLA-DR, CD40 and CD80/CD86 on CD14+ monocytes from healthy (n=5) and HBV-exposed (n=10) CB. (f) Sorted CD14+ monocytes from healthy (n=7) or HBV-exposed (n=8) CB were incubated with allogeneic CFSE-labelled CD3+T cells (E:T ratio 1) for 7 days and CFSE staining analysed using flow cytometry. T-cell proliferation index was calculated using Flowjo. Horizontal line in dot plots represents the median. P-values in cf were calculated using Mann–Whitney test, one-tailed. *P<0.05, ****P<0.0001.
Figure 3
Figure 3. HBV exposure in utero induces a robust Th1-polarized response in the CB.
(a) CB mononuclear cells were stimulated overnight with phorbol myristate acetate (PMA)/ionomycin and the cytokine production by CD3+T cells was measured using intracellular cytokine staining. Dot plots show the percentages of cytokine-producing CD3+T cells from healthy (HC; n=6) or HBV-exposed (HBV; n=11) CB. Cytokine production by CD3+T cells from the peripheral blood of pediatric and young adult patients with chronic HBV (HBV; n=10) and age-matched healthy controls (HC; n=33) were included for comparison. Horizontal line represents the median. (b) Representative FACS dot plots of Th1 cytokine (TNF-α, IFN-γ and IL-2) production from healthy and HBV-exposed CB T cells after PMA/ionomycin stimulation. (c) Graphical representation of single-, double- and triple-producer Th1 cells and their respective percentages in mean±s.e.m. in HBV-exposed CB. (d) Percentage of T cells expressing the Th1 marker, T-bet, in CB of healthy (n=4) and HBV+ (n=4) mothers. P-values were calculated using Mann–Whitney test.*P<0.05.
Figure 4
Figure 4. HBV exposure in utero triggers a state of ‘trained immunity’ against unrelated bacterial challenge.
CB mononuclear cells from healthy (n=3) or HBV+ (n=3) mothers were incubated with the bacteria P. aeruginosa, UPEC, S. typhimurium, A. baumanii or L. monocytogenes (multiplicity of infection (MOI) 1) for 18 h and the cytokine production in the supernatant was analysed using multiplex assay. Bar graphs show the mean±s.e.m. of each data set. P-values were calculated using two-way analysis of variance and multiple comparisons were done using uncorrected Fisher’s least significant difference test. *P<0.05 and **P<0.01.
Figure 5
Figure 5. HBV-induced immune cell maturation is neonatal in origin.
(a) FISH analysis with X- and Y-chromosome-specific probes to detect maternal cells in male CB. Graphs show the percentages of maternal cells (mean±s.e.m.) in CB unfractionated and fractionated cells (n=2 per group). Statistical significance between groups was calculated using Mann–Whitney test, one-tailed. P-value <0.05 is considered statistically significant. NS denotes nonsignificant. (b) Representative FISH images from each sorted cell population in healthy and HBV-exposed CB. Nuclei were counterstained with DAPI (blue), X- and Y-chromosomes in green and red, respectively. Maternal cells (white arrow) contain green chromosome X signals and no Y signals. Scale bar, 5 μm. (c) Quantitative PCR analysis using 48:48 Dynamic Arrays (Biomark System-Fluidigm) of CD14+ single cells derived from HBV-exposed CB of male neonate. Two male (M)-specific genes (XKRY and TTY1) are expressed in CB cells and not in female (F) cells. Similarly, XIST gene is selectively expressed in female cells. Black, no detected expression.
Figure 6
Figure 6. HBV-induced immune cell maturation is associated with the presence of HBsAg.
(a) CD2 cells were enriched from CB using MACS beads and the presence of HBsAg was detected using immunofluorescent staining. Detection of HBsAg in CB cells (white arrow) from healthy and HBV+ mothers (green–HBsAg; blue–DAPI). Images are representative of seven CB samples per group. CB cells incubated with recombinant HBsAg was used as positive control. Scale bar, 50 μm. (b) Percentage of HBsAg+ cells among DAPI+ cells in healthy and HBV-exposed CB (n=7 per group). P-value was calculated using Mann–Whitney test. **P<0.01.
Figure 7
Figure 7. IL-12p40 and IFN-α2 trigger the maturation of healthy CB immune cells in vitro.
CB mononuclear cells from healthy mothers (n=3) were incubated with rhIL-12p40 or rhIFN-α2, either alone or in different combinations of concentrations, overnight and the activation phenotypes of T cells and monocytes were analysed by FACS. Graphs (a,b) show the data from one representative sample. Dotted lines indicate the basal level without any cytokine stimulation. (a) The percentage of T-bet+ cells in CD4+ and CD8+ CB T cells. (b) The median fluorescence intensity (MFI) of expression of HLA-DR, CD40 and CD80/CD86 on CB monocytes. (c) The activation phenotypes of T cells and monocytes in CB cells (n=2, denoted 1 and 2) stimulated with physiological concentrations of rhIL-12p40 (0.1 ng ml−1) and rhIFN-α2 (0.4 ng ml−1).

References

    1. Adkins B., Leclerc C. & Marshall-Clarke S. Neonatal adaptive immunity comes of age. Nat. Rev. Immunol. 4, 553–564 (2004) . - PubMed
    1. Elahi S. et al. Immunosuppressive CD71 erythroid cells compromise neonatal host defence against infection. Nature 504, 158–162 (2013) . - PMC - PubMed
    1. Liaw Y. F. & Chu C. M. Hepatitis B virus infection. Lancet 373, 582–592 (2009) . - PubMed
    1. Beasley R. P. et al. Prevention of perinatally transmitted hepatitis B virus infections with hepatitis B immune globulin and hepatitis B vaccine. Lancet 2, 1099–1102 (1983) . - PubMed
    1. Milich D. R. et al. Is a function of the secreted hepatitis B e antigen to induce immunologic tolerance in utero? Proc. Natl Acad. Sci. USA 87, 6599–6603 (1990) . - PMC - PubMed

MeSH terms

Associated data