. 2015 Nov;53(5):625-36.
doi: 10.1165/rcmb.2014-0221OC.

Role of signal transducer and activator of transcription 1 in murine allergen-induced airway remodeling and exacerbation by carbon nanotubes

Affiliations

Role of signal transducer and activator of transcription 1 in murine allergen-induced airway remodeling and exacerbation by carbon nanotubes

Elizabeth A Thompson et al. Am J Respir Cell Mol Biol. 2015 Nov.

Abstract

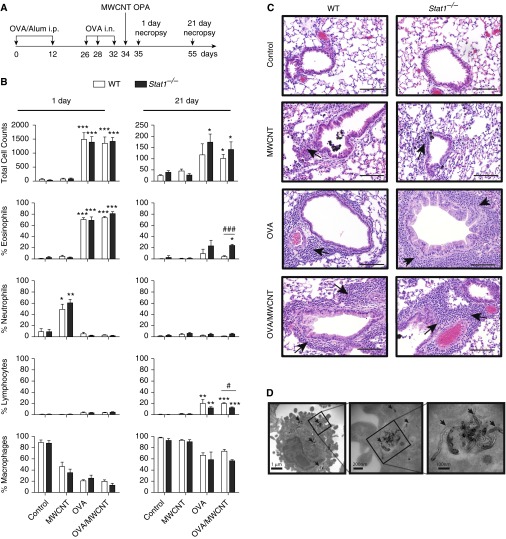
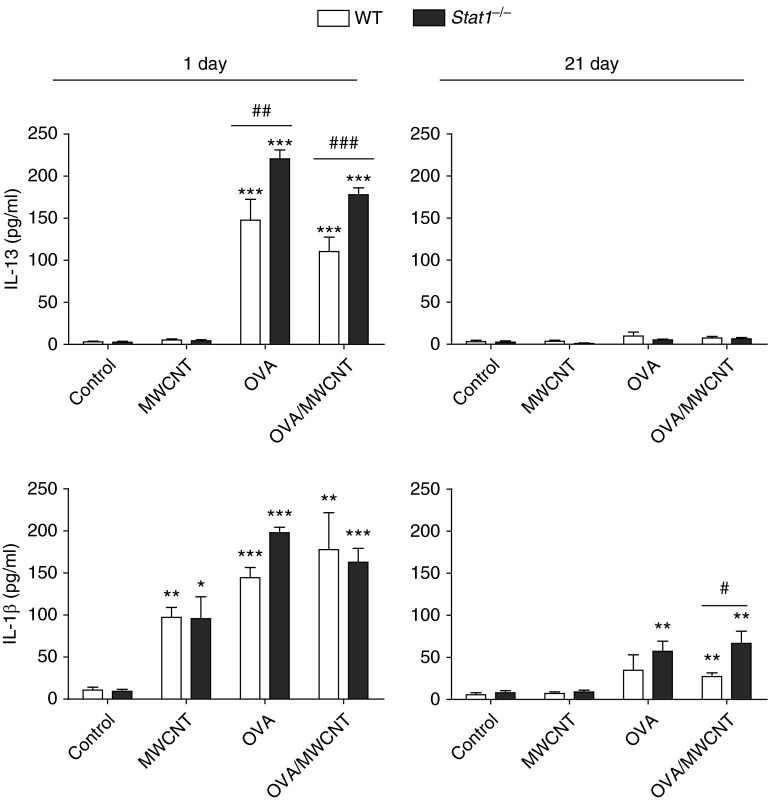
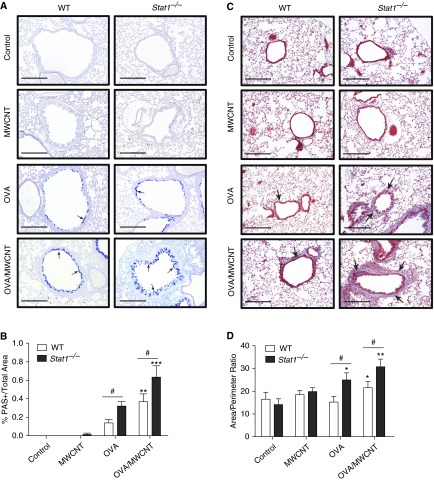
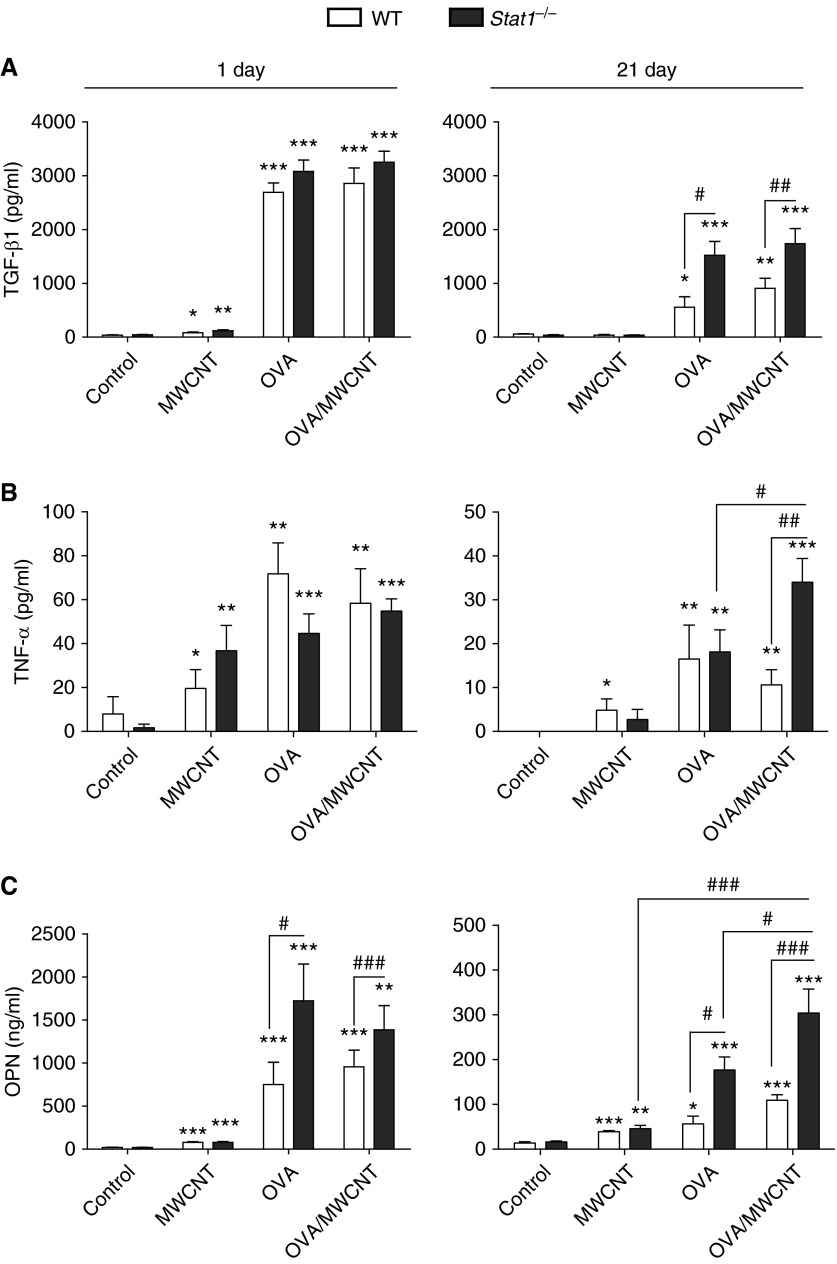
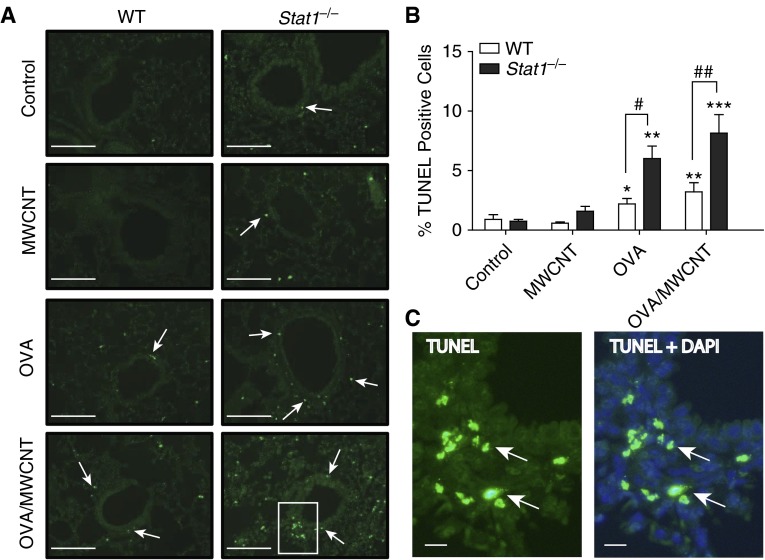
Asthma is characterized by a T helper type 2 phenotype and by chronic allergen-induced airway inflammation (AAI). Environmental exposure to air pollution ultrafine particles (i.e., nanoparticles) exacerbates AAI, and a concern is possible exacerbation posed by engineered nanoparticles generated by emerging nanotechnologies. Signal transducer and activator of transcription (STAT) 1 is a transcription factor that maintains T helper type 1 cell development. However, the role of STAT1 in regulating AAI or exacerbation by nanoparticles has not been explored. In this study, mice with whole-body knockout of the Stat1 gene (Stat1(-/-)) or wild-type (WT) mice were sensitized to ovalbumin (OVA) allergen and then exposed to multiwalled carbon nanotubes (MWCNTs) by oropharygneal aspiration. In Stat1(-/-) and WT mice, OVA increased eosinophils in bronchoalveolar lavage fluid, whereas MWCNTs increased neutrophils. Interestingly, OVA sensitization prevented MWCNT-induced neutrophilia and caused only eosinophilic inflammation. Stat1(-/-) mice displayed increased IL-13 in bronchoalveolar lavage fluid at 1 day compared with WT mice after treatment with OVA or OVA and MWCNTs. At 21 days, the lungs of OVA-sensitized Stat1(-/-) mice displayed increased eosinophilia, goblet cell hyperplasia, airway fibrosis, and subepithelial apoptosis. MWCNTs further increased OVA-induced goblet cell hyperplasia, airway fibrosis, and apoptosis in Stat1(-/-) mice at 21 days. These changes corresponded to increased levels of profibrogenic mediators (transforming growth factor-β1, TNF-α, osteopontin) but decreased IL-10 in Stat1(-/-) mice. Finally, fibroblasts isolated from the lungs of Stat1(-/-) mice produced significantly more collagen mRNA and protein in response to transforming growth factor-β1 compared with WT lung fibroblasts. Our results support a protective role for STAT1 in chronic AAI and exacerbation of remodeling caused by MWCNTs.

Keywords: airway remodeling; allergen; asthma; carbon nanotubes; nanomaterials.


Figures

Figure 1.
Figure 1.
Signal transducer and activator of transcription (STAT) 1 deficiency does not increase acute lung inflammation at 1 day after exposure to allergen and multiwalled carbon nanotubes (MWCNTs) but increases chronic eosinophilia at 21 days. (A) Schematic illustration of mouse exposure protocol for ovalbumin (OVA) sensitization by intraperitoneal injection (i.p.) and intranasal aspiration (i.n.) followed by oropharyngeal aspiration (OPA) of MWCNTs. (B) Total cell counts and relative percentages of inflammatory cell types in bronchoalveolar lavage fluid (BALF) at 1 and 21 days after exposure of mice to MWCNTs with or without OVA allergen sensitization. Open bars represent wild-type (WT) mice and solid bars represent Stat1−/− mice. Data are the mean ± SEM (n = 4 animals control and OVA groups, n = 6 MWCNT and OVA/MWCNT groups). *P < 0.0.05, **P < 0.01, ***P < 0.001 compared with control, as determined by one-way ANOVA; #P < 0.05 and ###P < 0.001 between genotypes within a treatment group as determined by two-way ANOVA. (C) Representative photomicrographs of hematoxylin and eosin–stained lung sections from each genotype and treatment group 1 and 21 days after MWCNT treatment. Scale bar, 200 μm. Arrows indicate inflammatory cell infiltration. (D) Transmission electron micrographs showing MWCNTs in alveolar macrophages adjacent to airways (arrows indicate MWCNT).
Figure 2.
Figure 2.
STAT1 deficiency increases levels of IL-13 at 1 day and IL-1β in the BALF at 21 days after exposure to allergen and MWCNTs. IL-13 (upper panels) and IL-1β (lower panels) in BALF were measured by ELISA. Open bars represent WT mice and solid bars represent Stat1−/− mice. Data are the mean ± SEM (n = 4 animals control and OVA groups, n = 6 MWCNT and OVA/MWCNT groups). *P < 0.05, **P < 0.01, ***P < 0.001 compared with control as determined by one-way ANOVA; #P < 0.05, ##P < 0.01, ###P < 0.001 between genotypes within the same treatment group as determined by two-way ANOVA.
Figure 3.
Figure 3.
STAT1 deficiency increases mucous cell metaplasia (MCM) and airway fibrosis after allergen sensitization and exposure to MWCNTs. (A) Representative photomicrographs of Alcian blue–periodic acid Schiff (AB-PAS) staining mucus (arrows) in lung sections from WT and Stat1−/− mice 21 days after MWCNT exposure and presensitization to OVA allergen. Scale bars, 500 μm. (B) Quantification of MCM showing the percentage of epithelial area positive for AB-PAS divided by total airway epithelial area at 21 days measured by the Image J protocol described in Materials and Methods. Open bars represent WT mice and solid bars represent Stat1−/− mice. Data are the mean ± SEM (n = 4 animals control and OVA groups, n = 6 MWCNT and OVA/MWCNT groups). **P < 0.01, ***P < 0.001 compared with control for each genotype as determined by one-way ANOVA; #P < 0.05 between genotypes as determined by two-way ANOVA. (C) Representative photomicrographs of trichrome-positive airway fibrosis (arrows) in the lungs of mice from each genotype and treatment group 21 days after MWCNT treatment. Scale bars, 500 μm. (D) Quantification of airway fibrosis by area:perimeter ratio method described in Materials and Methods. Data are the mean ± SEM (n = 4 animals control and OVA groups, n = 6 MWCNT and OVA/MWCNT groups). *P < 0.05, **P < 0.01 compared with control for each genotype as determined by one-way ANOVA; #P < 0.05 between genotypes within the same treatment group as determined by two-way ANOVA.
Figure 4.
Figure 4.
STAT1 suppresses mediators of fibrosis in BALF after OVA sensitization and exposure to MWCNTs. Protein levels of (A) transforming growth factor (TGF)-β1, (B) TNF-α, and (C) osteopontin (OPN) were assessed in BALF using ELISA. Open bars represent WT mice and solid bars represent Stat1−/− mice. Data are the mean ± SEM (n = 4 animals, control and OVA groups; n = 6 animals, MWCNT and OVA/MWCNT groups). *P < 0.0.05, **P < 0.01, ***P < 0.001 compared with control as determined by one-way ANOVA; #P < 0.05, ##P < 0.01, ###P < 0.001 between genotypes within the same treatment group as determined by two-way ANOVA.
Figure 5.
Figure 5.
Primary lung fibroblasts from Stat1−/− mice display increased collagen mRNAs and soluble collagen protein after treatment with recombinant TGF-β1. Confluent, quiescent primary WT or Stat1−/− mouse lung fibroblasts (MLFs) were treated with recombinant TGF-β1 for 48 or 72 hours before collecting RNA from cells and harvesting cell supernatants, respectively. Collagen mRNAs (collagen [Col] 1A1 and Col1A2) were measured by Taqman real-time RT-PCR at 48 hours, and collagen protein levels were measured by Sircol assay at 72 hours. Open bars represent WT MLF and solid bars represent Stat1−/− MLF. (A) Col1A1 mRNA levels at 48 hours in WT and Stat1−/− MLF. (B) Col1A2 mRNA levels at 48 hours in WT and Stat1−/− MLF. (C) Soluble collagen levels in supernatants from WT and Stat1−/− MLF 72 hours after treatment with 10 ng/ml TGF-β1 or medium alone (control). Collagen mRNA data are the mean ± SEM of four separate dishes of cells from two experiments, and collagen protein data are the mean ± SEM from three separate dishes from a single experiment. *P < 0.0.05, **P < 0.01, ***P < 0.001 compared with control as determined by one-way ANOVA; #P < 0.05 and ###P < 0.001 between genotypes as determined by two-way ANOVA.
Figure 6.
Figure 6.
STAT1 mediates IL-10 mRNA expression but suppresses Foxp3 mRNA levels in lung tissue after OVA sensitization and exposure to MWCNTs. Levels of IL-10 and Foxp3 mRNA in lung tissue from WT mice (open bars) or Stat1−/− mice (solid bars) were measure by Taqman real-time RT-PCR. (A) IL-10 mRNA levels at 1 and 21 days after exposure to MWCNT after OVA sensitization. (B) Foxp3 mRNA levels at 1 and 21 days after exposure to MWCNT after OVA sensitization. Data are the mean ± SEM (n = 3 animals for each group). *P < 0.0.05, **P < 0.01 compared with control as determined by one-way ANOVA; ##P < 0.01, ###P < 0.001 between genotypes within the same treatment group as determined by two-way ANOVA.
Figure 7.
Figure 7.
Stat1−/− mice display significant increases in apoptosis compared with WT mice after OVA sensitization and treatment with MWCNTs. (A) Representative photomicrographs of terminal deoxynucleotidyl transferase dUTP nick end labeling (TUNEL) staining in lung tissue of mice from each genotype and treatment group at 21 days after MWCNT exposure (20× magnification). Arrows indicate TUNEL-positive cells. Scale bars, 500 μm. (B) Quantification of the percentages of TUNEL-positive cells relative to total number of 4′,6-diamidino-2-phenylindole (DAPI)–positive cells 21 days after MWCNT exposure using the Image J protocol described in Materials and Methods. Open bars represent WT mice and solid bars represent Stat1−/− mice. Data are the mean ± SEM (n = 4 animals, control and OVA groups; n = 6 animals, MWCNT and OVA/MWCNT groups). Significant differences compared with controls were determined by one-way ANOVA (*P < 0.05, **P < 0.01, ***P < 0.001). Significant differences between genotypes were determined by two-way ANOVA (#P < 0.05, ##P < 0.01). (C) Higher magnification of inset image in A for Stat1−/− group after OVA/MWCNT treatment showing TUNEL image and merged TUNEL + DAPI. Arrows indicate TUNEL-positive cells. Scale bars, 50 μm.

References

    1. Akinbami OJ, Moorman JE, Bailey C, Zahran HS, King M, Johnson CA, Liu X. Trends in asthma prevalence, health care use, and mortality in the United States, 2001–2010. NCHS. 2012;94:1–8. - PubMed
    1. Holgate ST. The epidemic of allergy and asthma. Nature. 1999;402:B2–B4. - PubMed
    1. Drazen JM. Asthma and the human genome project: summary of the 45th Annual Thomas L. Petty Aspen Lung Conference. Chest. 2003;123:447S–449S. - PubMed
    1. Mosmann TR, Coffman RL. TH1 and TH2 cells: different patterns of lymphokine secretion lead to different functional properties. Annu Rev Immunol. 1989;7:145–173. - PubMed
    1. Romagnani S. Human TH1 and TH2 subsets: doubt no more. Immunol Today. 1991;12:256–257. - PubMed

Publication types

MeSH terms