. 2015 Mar 25;10(3):e0115312.
doi: 10.1371/journal.pone.0115312. eCollection 2015.

Classifying measures of biological variation

Affiliations

Classifying measures of biological variation

Hans-Rolf Gregorius et al. PLoS One. .

Abstract

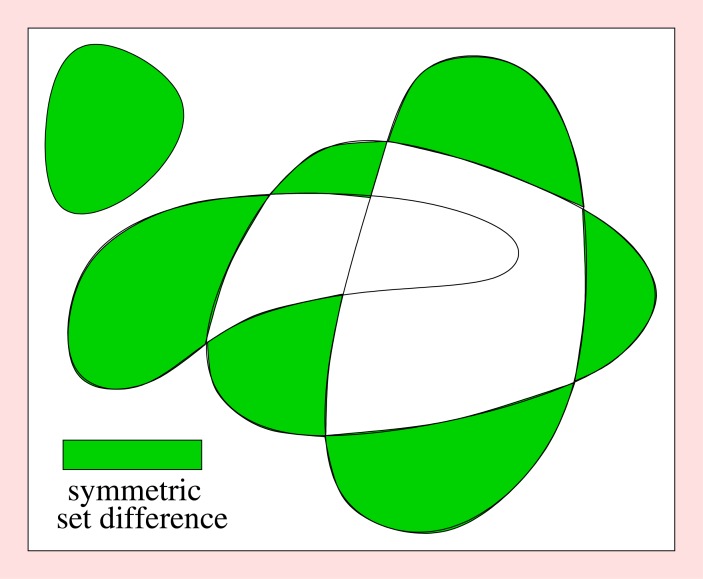
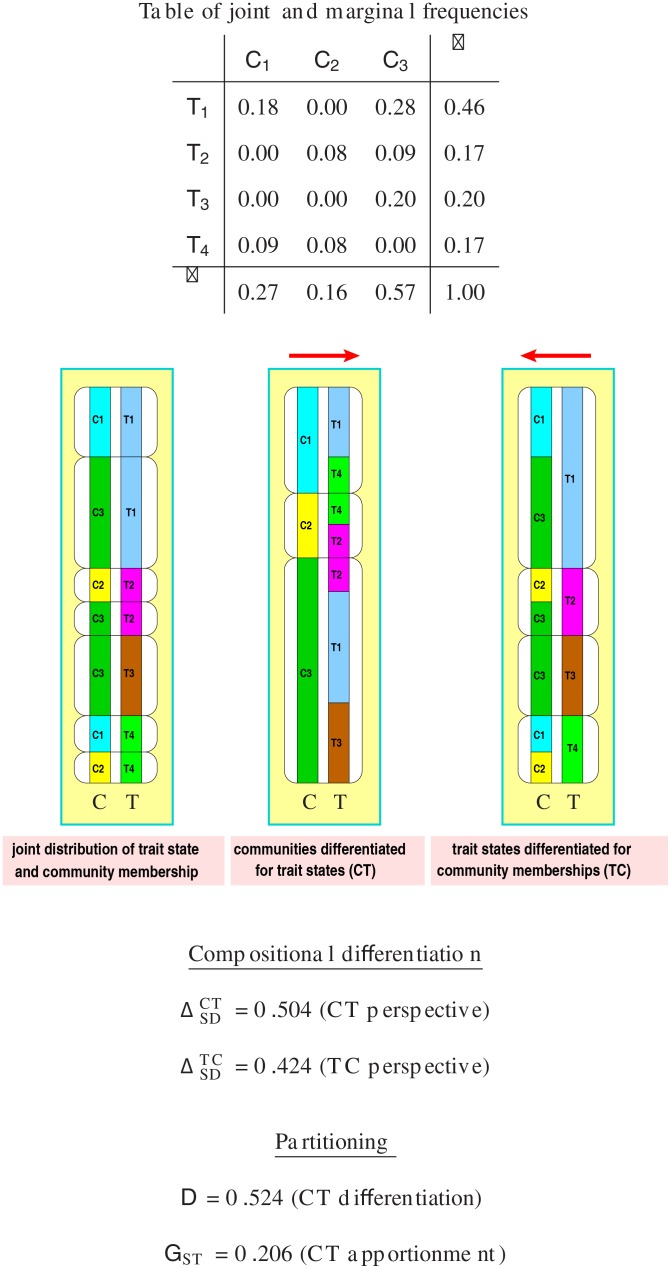
Biological variation is commonly measured at two basic levels: variation within individual communities, and the distribution of variation over communities or within a metacommunity. We develop a classification for the measurement of biological variation on both levels: Within communities into the categories of dispersion and diversity, and within metacommunities into the categories of compositional differentiation and partitioning of variation. There are essentially two approaches to characterizing the distribution of trait variation over communities in that individuals with the same trait state or type tend to occur in the same community (describes differentiation tendencies), and individuals with different types tend to occur in different communities (describes apportionment tendencies). Both approaches can be viewed from the dual perspectives of trait variation distributed over communities (CT perspective) and community membership distributed over trait states (TC perspective). This classification covers most of the relevant descriptors (qualified measures) of biological variation, as is demonstrated with the help of major families of descriptors. Moreover, the classification is shown to open ways to develop new descriptors that meet current needs. Yet the classification also reveals the misclassification of some prominent and widely applied descriptors: Dispersion is often misclassified as diversity, particularly in cases where dispersion descriptor allow for the computation of effective numbers; the descriptor GST of population genetics is commonly misclassified as compositional differentiation and confused with partitioning-oriented differentiation, whereas it actually measures partitioning-oriented apportionment; descriptors of β-diversity are ambiguous about the differentiation effects they are supposed to represent and therefore require conceptual reconsideration.


Conflict of interest statement

Competing Interests: The authors have declared that no competing interests exist.

Figures

Fig 1
Fig 1. Difference.
The asymmetric measure d of difference between objects x i illustrated in matrix form is consistent, since it fulfills requirements (a) d(x, y) ≥ 0, (b) d(x, x) = 0, and (c) d(x, y) = 0 implies d(x, z) = d(y, z) for all z. The resulting equivalence classes are {x 1, x 2, x 3}, {x 4, x 5}, and {x 6}. The measure cannot distinguish between objects from the same class, but it can distinguish between objects from different classes. These three classes represent the primary partition of objects into the three types that are distinguishable by this measure.
Fig 2
Fig 2. Dispersion.
Two examples demonstrating that dispersion does not reflect the number of types. Upper frame: Defining dispersion as the variation range maxx, y d(x, y) for d(x, y) = ∣xy∣, the smaller set {−5,0,5} has the same dispersion of 10 as the larger set {-5,-3,-2,-1,1,2,3,5}. Lower frame: Defining dispersion as the variance ∑x, y p xp yd(x, y) with d(x,y)=12(xy)2, the smaller set {−4,0,4} has approximately the same dispersion of ca. 10.667 as the larger set {-5.354126, -3, -2, -1, 1, 2, 3, 5.354126}.
Fig 3
Fig 3. Effective variable.
Diagram of the ingredients of the concept of effective variable and their relationships. Left: Three (real) communities that are identical in their characteristic variable (CV) but differ in their target variable (TV). Right: The ideal community that equals the real communities in its characteristic variable; the uniquely specified target variable of the ideal community summarizes the values of the target variable of the real communities into a single effective value.
Fig 4
Fig 4. Diversity portraits.
Top: Difference matrix of five types and the corresponding clustering of types for increasing difference level (y-axis). In addition to the primary partition, three hierarchically organized higher order partitions arise. Bottom: Four diversity portraits based on the above difference matrix showing Rényi diversity of different orders a as functions of difference level. In all cases, the diversity function shows a stepwise decrease as the difference level increases (see [17]).
Fig 5
Fig 5. Compositional differentiation.
Shaded areas represent the symmetric difference between four sets (closed curves), illustrating the extent of compositional differentiation via community characteristics of any one set that is not shared with its respective complement (modified from [40]).
Fig 6
Fig 6. Perspectives of differentiation.
Example of the dual perspectives of differentiation based on a qualitative trait T and community membership C. Top: Table of joint frequencies of the trait states and communities and the corresponding marginal frequencies. Columns refer to the CT perspective, rows to the TC perspective. Center: Illustrations of the joint frequency distribution and the distributions for the dual perspectives CT (sorted by communities, columns) and TC (sorted by types, rows). Arrows emphasize the direction of the perspective. Bottom: Values of the descriptors ΔSDCT, ΔSDTC (compositional differentiation), D (partitioning-oriented differentiation), and G ST (partitioning-oriented apportionment) for the frequencies in the table (for explicit specification of the descriptors, see text).

References

    1. Hubálek Z (2000) Measures of species diversity in ecology: an evaluation. Folia Zool 49: 241–260.
    1. Tuomisto H (2010) A consistent terminology for quantifying species diversity? Yes, it does exist. Oecologia 164: 853–860. 10.1007/s00442-010-1812-0 - DOI - PubMed
    1. Jurasinski G, Koch M (2011) Commentary: Do we have a consistent terminology for species diversity? We are on the way. Oecologia 167: 893–902. 10.1007/s00442-011-2126-6 - DOI - PubMed
    1. Kaplan J, Winther R (2013) Prisoners of abstraction? The theory and measure of genetic variation, and the very concept of “race”. Biological Theory 7: 401–412. 10.1007/s13752-012-0048-0 - DOI
    1. Woltereck R (1909) Weitere experimentelle Untersuchungen über Artveränderung, speziell über das Wesen quantitativer Artunterschiede bei Daphnien. Verhandlungen der deutschen zoologischen Gesellschaft 19: 110–173.

Publication types