

Relation between chemotaxis and consumption of amino acids in bacteria
- PMID: 25807888
- PMCID: PMC5008178
- DOI: 10.1111/mmi.13006
Relation between chemotaxis and consumption of amino acids in bacteria
Abstract
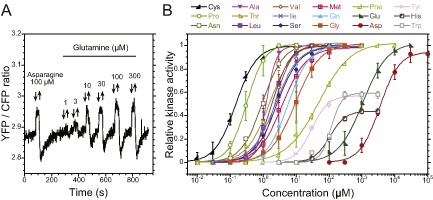
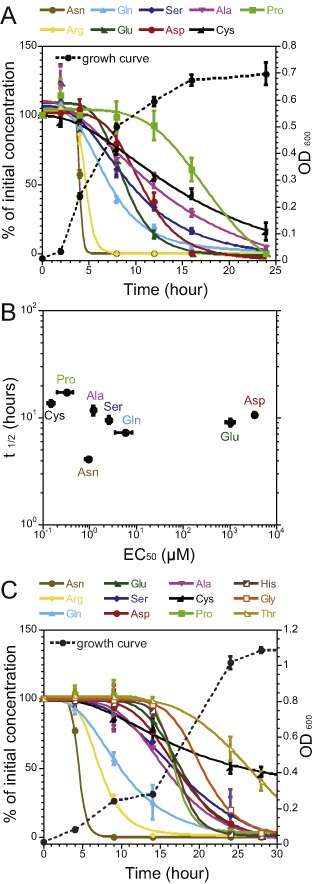
Chemotaxis enables bacteria to navigate chemical gradients in their environment, accumulating toward high concentrations of attractants and avoiding high concentrations of repellents. Although finding nutrients is likely to be an important function of bacterial chemotaxis, not all characterized attractants are nutrients. Moreover, even for potential nutrients, the exact relation between the metabolic value of chemicals and their efficiency as chemoattractants has not been systematically explored. Here we compare the chemotactic response of amino acids with their use by bacteria for two well-established models of chemotactic behavior, Escherichia coli and Bacillus subtilis. We demonstrate that in E. coli chemotaxis toward amino acids indeed strongly correlates with their utilization. However, no such correlation is observed for B. subtilis, suggesting that in this case, the amino acids are not followed because of their nutritional value but rather as environmental cues.
© 2015 The Authors. Molecular Microbiology published by John Wiley & Sons Ltd.
Figures


Similar articles
-
Bacterial chemotaxis: biochemistry of behavior in a single cell.Crit Rev Microbiol. 1985;12(2):95-130. doi: 10.3109/10408418509104426. Crit Rev Microbiol. 1985. PMID: 2992881 Review.
-
Bacillus subtilis CheD is a chemoreceptor modification enzyme required for chemotaxis.J Biol Chem. 2002 Jul 12;277(28):25356-62. doi: 10.1074/jbc.M201334200. Epub 2002 May 13. J Biol Chem. 2002. PMID: 12011078
-
Chemotaxis in Bacillus subtilis: how bacteria monitor environmental signals.Pharmacol Ther. 1995;68(1):87-104. doi: 10.1016/0163-7258(95)00027-5. Pharmacol Ther. 1995. PMID: 8604438 Review.
-
Receptors for chemotaxis in Bacillus subtilis.J Bacteriol. 1975 Sep;123(3):824-7. doi: 10.1128/jb.123.3.824-827.1975. J Bacteriol. 1975. PMID: 808536 Free PMC article.
-
Stable isotope labeling by amino acids applied to bacterial cell culture.Methods Mol Biol. 2014;1188:9-22. doi: 10.1007/978-1-4939-1142-4_2. Methods Mol Biol. 2014. PMID: 25059601
Cited by
-
The pH Robustness of Bacterial Sensing.mBio. 2022 Oct 26;13(5):e0165022. doi: 10.1128/mbio.01650-22. Epub 2022 Sep 26. mBio. 2022. PMID: 36154178 Free PMC article.
-
Predicting the decision making chemicals used for bacterial growth.Sci Rep. 2019 May 10;9(1):7251. doi: 10.1038/s41598-019-43587-8. Sci Rep. 2019. PMID: 31076576 Free PMC article.
-
Experimental evolution partially restores functionality of bacterial chemotaxis network with reduced number of components.PLoS Genet. 2025 Jul 10;21(7):e1011784. doi: 10.1371/journal.pgen.1011784. eCollection 2025 Jul. PLoS Genet. 2025. PMID: 40638701 Free PMC article.
-
Evolution of glutamatergic signaling and synapses.Neuropharmacology. 2021 Nov 1;199:108740. doi: 10.1016/j.neuropharm.2021.108740. Epub 2021 Jul 31. Neuropharmacology. 2021. PMID: 34343611 Free PMC article. Review.
-
Sulphur-Acquisition Pathways for Cysteine Synthesis Confer a Fitness Advantage to Bacteria in Plant Extracts.Environ Microbiol. 2025 Jun;27(6):e70126. doi: 10.1111/1462-2920.70126. Environ Microbiol. 2025. PMID: 40528555 Free PMC article.
References
-
- Bacilio‐Jimenez, M. , Aguilar‐Flores, S. , Ventura‐Zapata, E. , Perez‐Campos, E. , Bouquelet, S. , and Zenteno, E. (2003) Chemical characterization of root exudates from rice (Oryza sativa) and their effects on the chemotactic response of endophytic bacteria. Plant Soil 249: 271–277.
-
- Burg, D. , Guillaume, J. , and Tailliez, R. (1982) Chemotaxis by Rhizobium meliloti . Arch Microbiol 133: 162–163.
Publication types
MeSH terms
Substances
LinkOut - more resources
Full Text Sources
Other Literature Sources
Molecular Biology Databases
