. 2015 Jul;78(1):3-20.
doi: 10.1002/ana.24408. Epub 2015 Apr 16.

Cerebrospinal fluid markers reveal intrathecal inflammation in progressive multiple sclerosis

Affiliations

Cerebrospinal fluid markers reveal intrathecal inflammation in progressive multiple sclerosis

Mika Komori et al. Ann Neurol. 2015 Jul.

Abstract

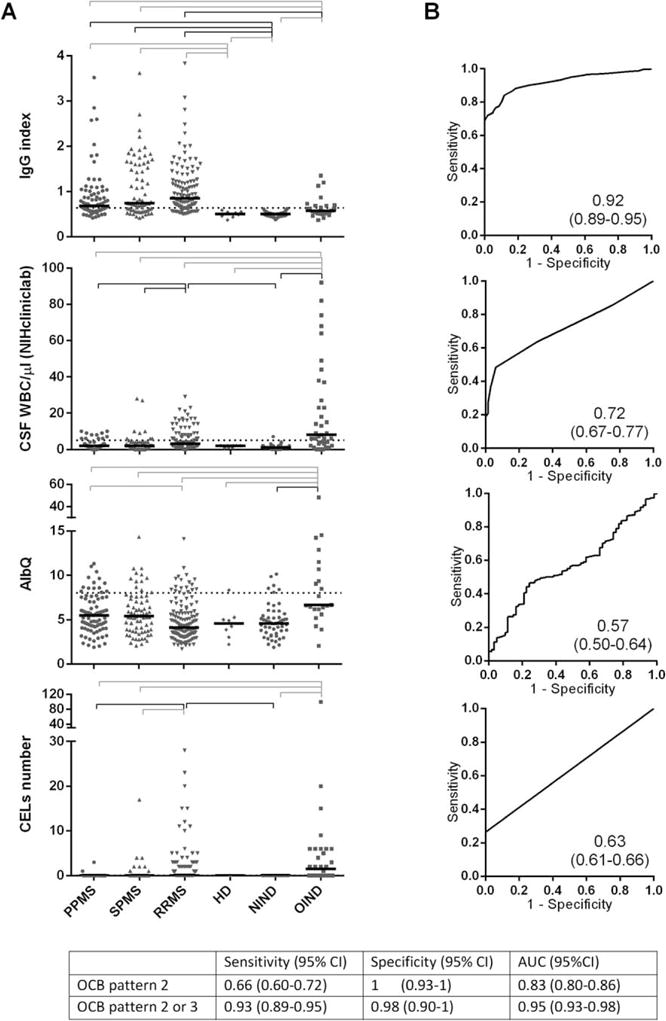
Objective: The management of complex patients with neuroimmunological diseases is hindered by an inability to reliably measure intrathecal inflammation. Currently implemented laboratory tests developed >40 years ago either are not dynamic or fail to capture low levels of central nervous system (CNS) inflammation. Therefore, we aimed to identify and validate biomarkers of CNS inflammation in 2 blinded, prospectively acquired cohorts of untreated patients with neuroimmunological diseases and embedded controls, with the ultimate goal of developing clinically useful tools.

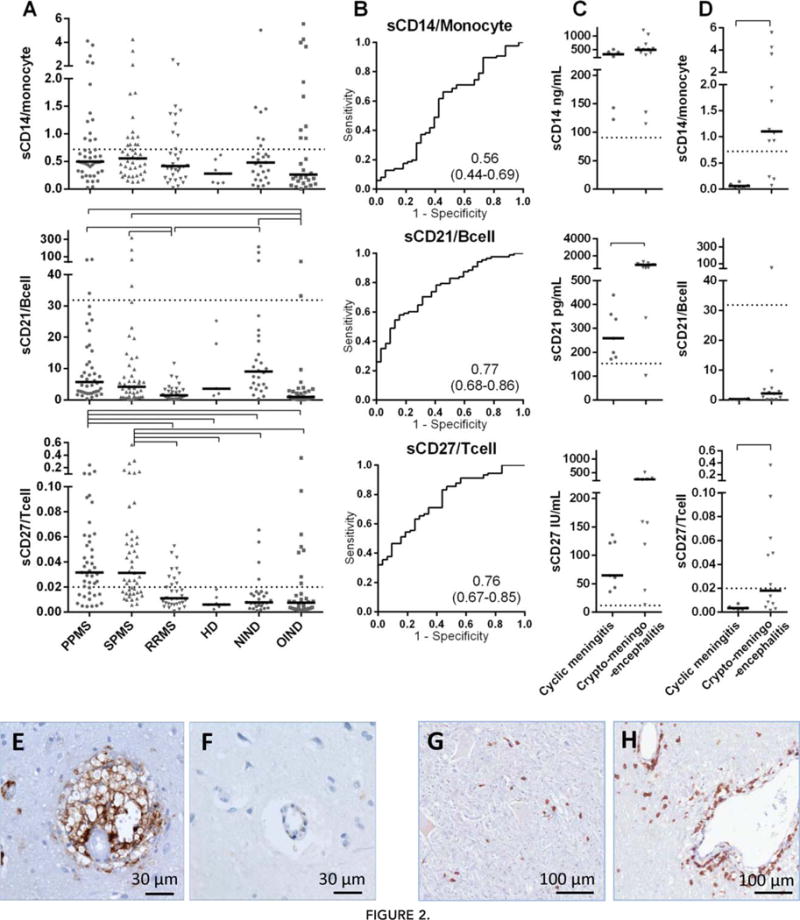
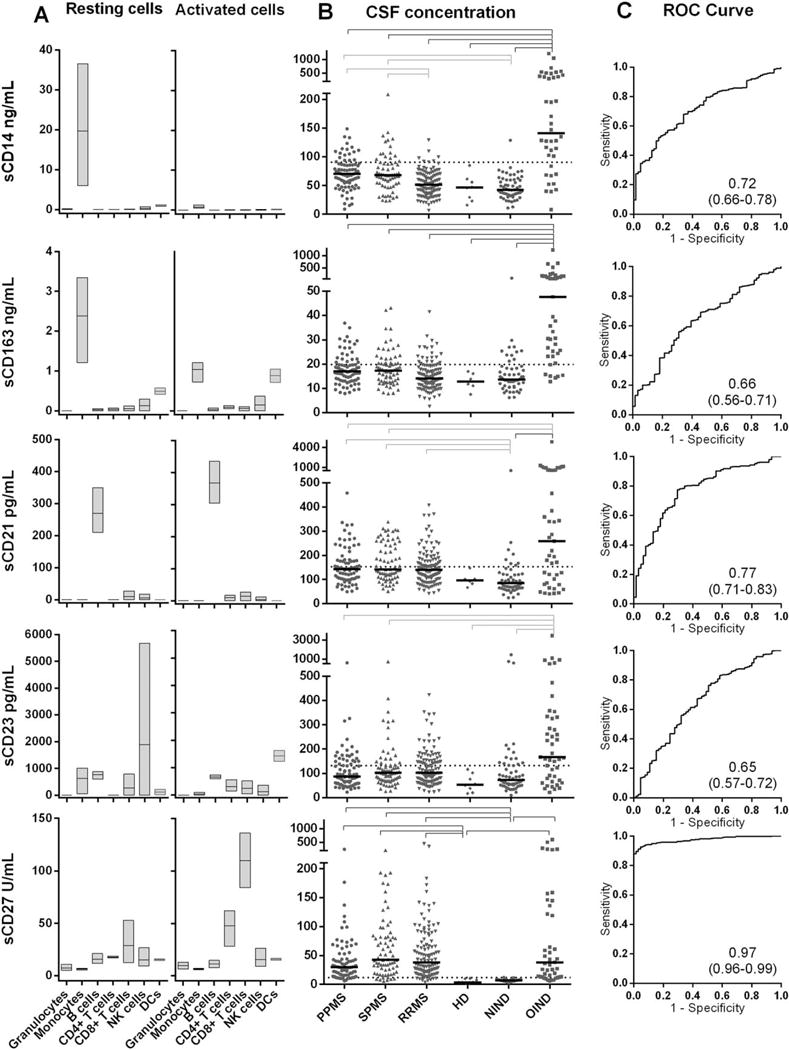
Methods: Because biomarkers with maximum utility reflect immune phenotypes, we included an assessment of cell specificity in purified primary immune cells. Biomarkers were quantified by optimized electrochemiluminescent immunoassays.

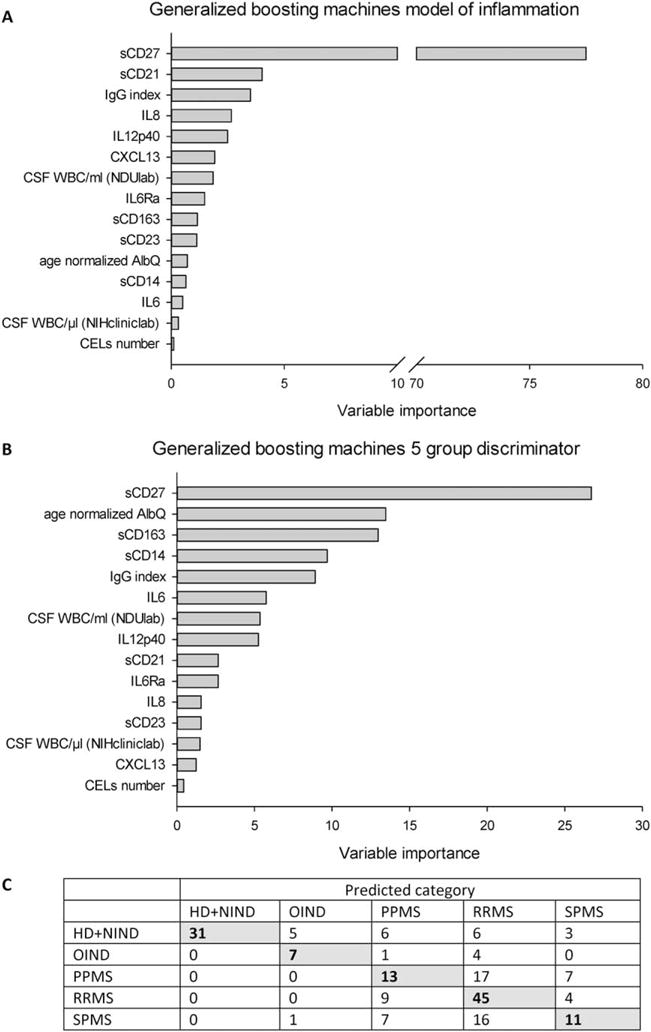
Results: Among markers with cell-specific secretion, soluble CD27 is a validated biomarker of intrathecal T-cell activation, with an area under the receiver operating characteristic curve of 0.97. Comparing the quantities of cerebrospinal fluid (CSF) immune cells and their respective cell-specific soluble biomarkers (released by CSF cells as well as their counterparts in CNS tissue) provided invaluable information about stationary CNS immune responses, previously attainable via brain biopsy only. Unexpectedly, progressive and relapsing-remitting multiple sclerosis (MS) patients have comparable numbers of activated intrathecal T and B cells, which are preferentially embedded in CNS tissue in the former group.

Interpretation: The cell-specific biomarkers of intrathecal inflammation may improve diagnosis and management of neuroimmunological diseases and provide pharmacodynamic markers for future therapeutic developments in patients with intrathecal inflammation that is not captured by imaging, such as in progressive MS.


Conflict of interest statement

Potential Conflicts of Interest

Nothing to report.

Figures

FIGURE 1
FIGURE 1
Validation of traditional biomarkers for intrathecal inflammation. (A) Traditional intrathecal inflammatory biomarkers, including immunoglobulin G (IgG) index, white blood cell (WBC) counts in unspun cerebrospinal fluid (CSF; CSF WBC/μl; NIH clinical laboratory), albumin quotient (AlbQ), number of contrast-enhancing lesions (CELs) on brain magnetic resonance imaging performed at the time of lumbar puncture, and oligoclonal bands (OCBs), were validated in coded CSF samples of combined Cohorts A and B (n = 386). Primary progressive multiple sclerosis (PPMS), secondary progressive MS (SPMS), relapsing–remitting MS (RRMS), healthy donors (HD), noninflammatory neurological diseases (NIND), and other inflammatory neurological diseases (OIND) were compared between each diagnostic category. OCB type 2 represents OCBs in CSF but not in serum, indicative of isolated intrathecal oligoclonal IgG synthesis. OCB type 3 represents identical OCBs in the CSF and serum plus additional, CSF-specific OCBs. Gray brackets represent statistical significance (p < 0.01) that was reproduced only in 1 of the independent cohorts (data not shown), whereas black brackets highlight those differences that reached statistical significance (p < 0.05) in each independent cohort based on the analysis of variance and Tukey’s correction method for pairwise multiple comparisons. Dotted lines represent the upper limit of normal values (mean + 2 standard deviations) of HDs for IgG index and AlbQ. For CSF WBC/μl (NIH clinic laboratory) the NIH Clinical Center normal limit (≤ 5 cells/μl) was utilized in the figure. For CEL quantification, 0 was considered normal. Thick black bars represent the median for each diagnostic category. (B) The area under the receiver operation characteristic curves (AUCs) and 95% confidence intervals (CIs; in parentheses) based on binary outcome: with (OIND and all MS groups) versus without (HD and NIND) intrathecal inflammation.
FIGURE 2
FIGURE 2
Combination of biologically related biomarkers. Three combinatorial biomarkers using Cohort B patients (the only cohort with available cerebrospinal fluid [CSF] immunophenotyping data) were calculated as ratios between the measured concentrations of cell-specific soluble CSF biomarkers and absolute numbers of corresponding CSF cells/ml of CSF (soluble [s]CD14/monocytes, sCD21/B cells, CD27/CD4+CD8 T cells). (A) Combinatorial biomarker levels in primary progressive multiple sclerosis (PPMS), secondary progressive MS (SPMS), relapsing–remitting MS (RRMS), healthy donors (HD), noninflammatory neurological diseases (NIND), and other inflammatory neurological diseases (OIND) were compared between each diagnostic category. Dotted lines represent the upper limit of normal values, calculated as mean + 2 standard deviations of the HD cohort; thick black bars represent the median for each diagnostic category. Black brackets highlight statistically significant differences (p < 0.05) between diagnostic categories (PPMS, SPMS, RRMS, HD, NIND, and OIND) based on pairwise multiple comparisons with Tukey’s correction. (B) Area under the receiver operation characteristic curves and 95% confidence intervals (in parentheses), where the binary outcome is defined as patients with progressive MS (who have elevated ratios and therefore likely more immobile cells in central nervous system [CNS] tissue) versus patients with RRMS (who have more mobile immune cells detectable in the CSF). (C) Results from measured concentrations of the cell-specific soluble CSF biomarkers sCD14, sCD21, and sCD27 for 2 homogeneous diagnostic subcategories of OIND: patients with cyclic meningitis (patients with cyclic aseptic meningitis without accumulation of neurological disability) and nonimmunocompromised patients with cryptococcal meningoencephalitis (patients with both CSF pleocytosis and accumulation of neurological disability). (D) Results from the sCD14/monocyte, sCD21/B-cell, and sCD27/T-cell ratios in the same 2 diagnostic subcategories of OIND patients. Thick bars represent cohort medians, and dotted lines represent upper limits of normal values (calculated as mean + 2 standard deviations from HD). Brackets highlight statistically significant differences (p < 0.05) between the 2 diagnostic categories based on 2-sample t test. (E–H) CNS autopsy tissue staining from a nonimmunocompromised cryptococcal meningoencephalitis patient (E, F) and a patient with undiagnosed CNS conditions, who was demonstrated to be neuroinflammatory based on autopsy results (G, H). (E) Brain tissue stained with anti-CD68 antibody showing accumulation of macrophages (brown) around a vessel. (F) Adjacent brain tissue stained with anti-CD3 antibody demonstrating a relative paucity of T cells. (G) Spinal cord tissue stained with anti-CD8 antibody showing invasion of CD8+ T cells into the tissue. (H) Brain tissue stained with anti-CD8 antibody showing accumulation of CD8+ T cells in perivascular space and their infiltration of brain tissue.
FIGURE 3
FIGURE 3
Interleukin (IL)-12p40 and IL-8 are the most useful biomarkers of intrathecal inflammation among tested cytokines and chemokines. (A, B) Candidate biomarkers (IL-8, C-X-C motif chemokine 13 [CXCL13], IL-12p40, IL-6, and IL-6Ra) from the cytokine/chemokine category were quantified using commercially available or newly developed electrochemiluminescence sandwich immunoassays in cultured supernatants from purified, negatively selected immune subtypes (A) or coded cerebrospinal fluid (CSF) samples from combined Cohorts A and B (n = 386; B); 1 × 10⁶/ml of purified granulocytes, monocytes, B cells, CD4+ and CD8+ T cells, natural killer (NK) cells, and dendritic cells (DCs) from healthy donors (HD; n = 3) were either left untreated (A, left) or polyclonally stimulated with phorbol myristate acetate/Ionomycin (A, right) for 48 hours before collection of supernatants. Biomarker concentrations were recalculated per million cells of each specific subtype using flow cytometry data for purity of each seeded culture. In B, CSF biomarker concentrations in primary progressive multiple sclerosis (PPMS), secondary progressive MS (SPMS), relapsing–remitting MS (RRMS), HD, noninflammatory neurological diseases (NIND), and other inflammatory neurological diseases (OIND) were compared between each diagnostic category. Gray brackets represent statistically significant differences (p < 0.01) that were reproduced in only 1 of the cohorts, whereas black brackets represent those differences that reached statistical significance (p < 0.05) in both cohorts based on pairwise multiple comparisons with Tukey’s correction method. Dotted lines represent the upper limit of normal values (calculated as mean + 2 standard deviations from HD); thick black bars represent the median for each diagnostic category. (C) Area under the receiver operation characteristic (ROC) curves and 95% confidence intervals (in parentheses), where the binary outcome is defined as with (OIND and all MS groups) versus without intrathecal inflammation (HD and NIND).
FIGURE 4
FIGURE 4
Cell surface markers have more restricted cellular origin, and soluble (s)CD27 is an outstanding biomarker of intrathecal (T-cell–mediated) inflammation. (A) Candidate biomarkers (sCD14, sCD163, sCD21, sCD23, and sCD27) from cell surface markers were quantified using newly developed electrochemiluminescence sandwich immunoassays in cultured supernatants from purified, negatively selected immune subtypes or coded cerebrospinal fluid (CSF) samples from combined Cohorts A and B (n = 386; B); 1 × 10⁶/ml of purified granulocytes, monocytes, B cells, CD4+ and CD8+ T cells, natural killer (NK) cells, and dendritic cells (DCs) from healthy donors (HD; n = 3) were either left untreated (A, left) or polyclonally stimulated with phorbol myristate acetate/Ionomycin (A, right) for 48 hours before collection of supernatants. Biomarker concentrations were recalculated per million cells of each specific subtype using flow cytometry data for purity of each seeded culture. (B) CSF biomarker concentrations in primary progressive multiple sclerosis (PPMS), secondary progressive MS (SPMS), relapsing–remitting MS (RRMS), HD, noninflammatory neurological diseases (NIND), and other inflammatory neurological diseases (OIND) were compared between each diagnostic category. Gray brackets represent statistically significant differences (p < 0.01) that were reproduced in only 1 of the cohorts, whereas black brackets represent those differences that reached statistical significance (p < 0.05) in both cohorts based on pairwise multiple comparisons with Tukey’s correction method. Dotted lines represent the upper limit of normal values (calculated as mean + 2 standard deviations from HD); thick black bars represent the median for each diagnostic category. (C) Area under the receiver operation characteristic (ROC) curves and 95% confidence intervals (in parentheses), where the binary outcome is defined as with (OIND and all MS groups) versus without intrathecal inflammation (HD and NIND).
FIGURE 5
FIGURE 5
Correlation matrix for all biomarkers. All biomarkers included in this study were analyzed with the Pearson correlation method. Only statistically significant correlations (p < 0.001 to account for multiple comparisons) are depicted with color, with strength of positive or negative correlation color-coded based on the provided heat map. Biomarkers were shown in groups as follows. Traditional biomarkers: the number of contrast-enhancing lesions (CELs) on brain magnetic resonance imaging performed at the time of lumbar puncture, immunoglobulin G (IgG) index, albumin quotient (AlbQ), age-normalized AlbQ, and white blood cell (WBC) counts per microliter in unspun cerebrospinal fluid (CSF) at the NIH Clinical Center. Enhanced cell counts: WBC counts per milliliter in CSF at the Neuroimmunological Diseases Unit (NDU) laboratory, absolute monocyte counts, B-cell counts, and T-cell counts. Cytokines and chemokines: interleukin (IL)-8, C-X-C motif chemokine 13 (CXCL13), IL-12p40, IL-6, and IL-6Ra. Soluble (s) cell surface markers: sCD14, sCD163, sCD21, sCD23, and sCD27. Calculated markers: sCD14 per monocytes, sCD21 per B cells, and sCD27 per T cells.
FIGURE 6
FIGURE 6
Ability of biomarkers to differentiate disease groups. Gradient boosting machines (GBM) results with cerebrospinal fluid (CSF) biomarkers are shown as plots of relative importance of biomarker variables. (A) In predicting presence versus absence of intrathecal inflammation, soluble (s)CD27 dominated the other variables in the classifier. (B) GBM variable importance results for 5 diagnostic categories. sCD27 was still the most important variable, but this time many additional variables contribute to predicting the response categories. (C) Confusion matrix for the validation cohort of the 5 diagnostic category GBM classifier. There were perfect predictions of noninflammatory neurological diseases (NIND) + healthy donors (HD) category, but misclassification of at least a few subjects from all remaining diagnostic groups, created by classifying new observations into the category with the highest predicted probability from the GBM. AlbQ = albumin quotient; CEL = contrast-enhancing lesion; CXCL13 = C-X-C motif chemokine 13; IL = interleukin; IgG = immunoglobulin G; NDU = Neuroimmunological Diseases Unit; OIND = other inflammatory neurological diseases; PPMS = primary progressive multiple sclerosis; RRMS = relapsing–remitting multiple sclerosis; SPMS = secondary progressive multiple sclerosis; WBC = white blood cells.

References

    1. Sormani MP, Bruzzi P. MRI lesions as a surrogate for relapses in multiple sclerosis: a meta-analysis of randomised trials. Lancet Neurol. 2013;12:669–676. - PubMed
    1. Filippi M, Rocca MA, Barkhof F, et al. Association between pathological and MRI findings in multiple sclerosis. Lancet Neurol. 2012;11:349–360. - PubMed
    1. Stangel M, Fredrikson S, Meinl E, et al. The utility of cerebrospinal fluid analysis in patients with multiple sclerosis. Nat Rev Neurol. 2013;9:267–276. - PubMed
    1. Petzold A. Intrathecal oligoclonal IgG synthesis in multiple sclerosis. J Neuroimmunol. 2013;262:1–10. - PubMed
    1. Axelsson M, Mattsson N, Malmestrom C, et al. The influence of disease duration, clinical course, and immunosuppressive therapy on the synthesis of intrathecal oligoclonal IgG bands in multiple sclerosis. J Neuroimmunol. 2013;264:100–105. - PubMed

Publication types

MeSH terms