. 2015 Mar 26:6:6606.
doi: 10.1038/ncomms7606.

Aberrant hippocampal neurogenesis contributes to epilepsy and associated cognitive decline

Affiliations

Aberrant hippocampal neurogenesis contributes to epilepsy and associated cognitive decline

Kyung-Ok Cho et al. Nat Commun. .

Abstract

Acute seizures after a severe brain insult can often lead to epilepsy and cognitive impairment. Aberrant hippocampal neurogenesis follows the insult but the role of adult-generated neurons in the development of chronic seizures or associated cognitive deficits remains to be determined. Here we show that the ablation of adult neurogenesis before pilocarpine-induced acute seizures in mice leads to a reduction in chronic seizure frequency. We also show that ablation of neurogenesis normalizes epilepsy-associated cognitive deficits. Remarkably, the effect of ablating adult neurogenesis before acute seizures is long lasting as it suppresses chronic seizure frequency for nearly 1 year. These findings establish a key role of neurogenesis in chronic seizure development and associated memory impairment and suggest that targeting aberrant hippocampal neurogenesis may reduce recurrent seizures and restore cognitive function following a pro-epileptic brain insult.


Figures
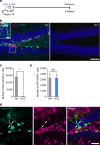
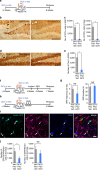
Figure 1
Figure 1. Genetic ablation of adult-born granule neurons.
(a) Time line showing the experimental design. (b) Representative confocal images from three independent experiments showing dentate gyrus DCX immunostaining in mice treated with either Veh or GCV for 4 weeks. Scale bar, 50 μm. Inset shows the cells co-localized with NeuroD and DCX. Scale bar, 10 μm. (c) A graph showing the number of NeuroD/DCX-expressing newborn neurons in the dentate gyrus in Veh (n=4) and GCV group (n=5). Mann–Whitney U-test, P=0.016, U<0.001. (d) Representative confocal images of hippocampal neural stem cells co-expressing Nestin-GFP and GFAP out of three independent experiments. Arrows indicate representative merged cells. Scale bar, 20 μm. (e) A graph showing the number of GFP/GFAP-positive neural stem cells in Veh and GCV groups (n=6 per group). Student’s t-test, P=0.976, t(10)=0.031. Data presented as mean±s.e.m. *P<0.05. NS, not significant.
Figure 2
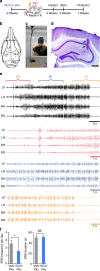
Figure 2. Ablation of neurogenesis reduces spontaneous seizures.
(a) Time line showing the experimental design. (b) Two subdural screws and two bipolar hippocampal in-depth electrodes were implanted to record EEG. LF, left frontal screw; LH, left hippocampal depth electrode; RH, right hippocampal depth electrode; RO, right occipital screw. (c) Video/EEG monitoring was performed on a freely moving mouse with a tethered system. (d) A representative Nissl image from four independent experiments showing a hippocampal electrode track (arrows). Scale bar, 500 μm. (e) A representative EEG trace from eight independent experiments showing generalized seizure activity. Details are presented as initial (1), middle (2) and end sections (3). (f) Graphs showing the frequency and duration of SRS of GCV-treated mice (n=18) and Veh-treated mice (n=15). Student’s t-test, P=0.037, t(31)=2.185 for the left graph; Student’s t-test, P=0.875, t(31)=−0.159 for the right graph. Data presented as mean±s.e.m. *P<0.05. NS, not significant.
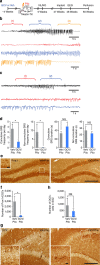
Figure 3
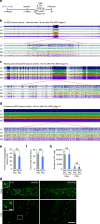
Figure 3. Ablating neurogenesis does not affect acute seizure severity
(a) Experimental time line. After 4 weeks of GCV or Veh treatment, video/EEG was recorded from 1 h before pilocarpine (Pilo) injection to 3 days after acute seizures. (bd) Representative EEG traces from two independent experiments showing EEG stage 1, stage 2 and stage 3, respectively. (e) A graph showing time to the first EEG seizure, which was not different between Veh/Pilo (n=10) and GCV/Pilo groups (n=13). Mann–Whitney U-test, P=0.457, U=53.000. (f) A graph showing time to status epilepticus (SE) between Veh- and GCV-treated groups (n=10 for Veh/Pilo, n=13 for GCV/Pilo). Mann–Whitney U-test, P=0.154, U=42.000. (g) Representative microscopic images from four independent experiments showing degenerating neurons labelled with FJC after acute seizures. FJC-positive cells were observed in the hilus and the CA3 subregion of the hippocampus in both Veh/Pilo and GCV/Pilo groups. Scale bar, 100 μm. Insets show typical FJC-positive cells in the hilus and the CA3 subregion. Scale bar, 20 μm. (h) A graph showing the number of FJC-positive cells in the hilus and the CA3 subregion of the hippocampus between Veh/Pilo (n=4) and GCV/Pilo (n=5) groups. Mann–Whitney U-test, P=1.000, U=10.000 for the hilar analysis; Mann–Whitney U-test, P=0.327, U=6.000 for the CA3 analysis. Data presented as mean±s.e.m. NS, not significant. LF, left frontal; LH, left hippocampal; RH, right hippocampal; RO, right occipital.
Figure 4
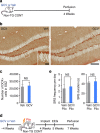
Figure 4. No off-target effects of GCV administration.
(a) Experimental time line. Non-transgenic control mice without thymidine kinase (Non-TG CONT) were administered GCV or Veh for 4 weeks. (b) Representative microscopic images from four independent experiments showing DCX immunoreactivity between Veh and GCV groups. Scale bar, 100 μm. Inset shows typical DCX-positive cells. Scale bar, 20 μm. (c) A graph showing the number of DCX-expressing cells in the subgranular zone (SGZ) between Veh and GCV groups (n=3 per group). Student’s t-test, P=0.818, t(4)=−0.246. (d) Time line to show experimental design. (e) Graphs showing the frequency and duration of SRS between Veh/Pilo (n=8) and GCV/Pilo groups (n=6). Student’s t-test, P=0.803, t(12)=−0.255 for the left graph; Student’s t-test, P=0.664, t(6.243)=−0.456 for the right graph. Data presented as mean±s.e.m. NS, not significant.
Figure 5
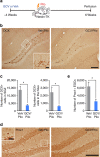
Figure 5. Ablating adult neurogenesis reduces aberrant neurogenesis.
(a) Time line for histologic analysis. (b) Representative microscopic images from three independent experiments showing DCX immunoreactivity at 6 weeks after pilocarpine (Pilo) injection. Scale bar is 100 μm. Inset shows typical DCX-positive cells after pilocarpine. Scale bar is 20 μm. (c) A graph showing the number of DCX-expressing cells in the SGZ and the hilus in Veh/Pilo (n=8) and GCV/Pilo group (n=7). Student’s t-test, P=0.003, t(8.569)=4.156 for the left graph; Student’s t-test, P=0.020, t(7.137)=2.971 for the right graph. (d) Representative microscopic images from three independent experiments showing the dentate gyrus stained with Prox1, a marker for granule neurons. Scale bar, 100 μm. Inset shows a typical ectopic granule neuron. Scale bar, 20 μm. (e) A graph showing the number of EGCs in the hilus of Veh/Pilo (n=8) and GCV/Pilo group (n=8). Student’s t-test, P=0.012, t(9.871)=3.056. Data presented as mean±s.e.m. *P<0.05.
Figure 6
Figure 6. Seizures persist after near-complete ablation of neurogenesis.
(a) Experimental design. (b) Microscopic images from three experiments showing DCX immunoreactivity at 6 weeks after pilocarpine (Pilo) injection. Scale bar, 200 μm. Inset shows typical DCX-positive cells in epilepsy. Scale bar, 20 μm. (c) Graphs showing the number of DCX-expressing cells in subgranular zone (SGZ) and the hilus in Veh/Pilo/Veh (n=11) and GCV/Pilo/GCV group (n=12). Mann–Whitney U-test, P<0.001, U=3.000 for the left graph; Mann–Whitney U-test, P<0.001, U=8.000 for the right graph. (d) Microscopic images from three experiments showing the dentate gyrus stained with Prox1, a marker for granule neurons. Scale bar, 100 μm. Inset shows typical EGCs in epilepsy. Scale bar, 20 μm. (e) A graph showing the number of EGCs in the hilus of Veh/Pilo/Veh (n=11) and GCV/Pilo/GCV group (n=12). Mann–Whitney U-test, P<0.001, U=8.000. (f) Experimental design. (g) Graphs showing SRS frequency and duration between Veh/Pilo/Veh (n=24) and GCV/Pilo/GCV groups (n=22). Mann–Whitney U-test, P=0.092, U=187.500 for the left graph; Student’s t-test, P=0.404, t(41)=−0.843 for the right graph. (h) Experimental design. (i) Confocal images from three experiments showing representative Nestin-TK GFP/GFAP/BrdU- (arrows) and GFAP/BrdU-immunoreactive cells (arrowheads) in the hilus. Scale bar, 20 μm. (j) Graphs showing the number of proliferating reactive astrocytes expressing Nestin-TK GFP, examined by Nestin-TK GFP/GFAP/BrdU+ cells and proliferating astrocytes not expressing Nestin-TK GFP, labelled as GFAP/BrdU staining, between Veh/Pilo/Veh (n=5) and GCV/Pilo/GCV group (n=6). Student’s t-test, P=0.049, t(9)=2.281 for the left graph; Student’s t-test, P=0.270, t(9)=1.174 for the right graph. Data presented as mean±s.e.m. *P<0.05. NS, not significant.
Figure 7
Figure 7. Ablating neurogenesis rescues cognitive decline in epilepsy.
(a,b) Experimental time line is shown. (c) A graph showing the preference ratio of NO location (NL) test in sham mice (n=10) and pilocarpine-injected mice (n=9). Student’s t-test, P=0.0001, t(17)=5.017. (d) A graph showing the preference ratio of NL test between Veh (n=16) and GCV (n=17) groups. Student’s t-test, P=0.008, t(31)=−2.850. (e,f) Graphs showing the preference ratio in NO test (n=4 for sham, n=5 for Pilo; n=18 for Veh/Pilo, n=15 for GCV/Pilo). (e) Mann–Whitney U-test, P=1.000, U=10.000. (f) Student’s t-test, P=0.937, t(31)=−0.080. Data presented as mean±s.e.m. *P<0.05. NS, not significant.
Figure 8
Figure 8. Ablating neurogenesis leads to long-term suppression of SRS.
(a) Time line to show experimental design. (b) A representative EEG trace showing convulsive seizure activity from three independent experiments. Details are presented as initial (1), middle (2) and end sections (3). (c) A representative EEG trace showing non-convulsive seizure activity from three independent experiments. Details are presented as initial (1) and end sections (2). (d) Graphs showing the frequency and duration of convulsive SRS and non-convulsive SRS between Veh (n=8) and GCV (n=8) groups. Student’s t-test, P=0.028, t(9.396)=2.603; Mann–Whitney U-test, P=0.038, U=13.500; Mann–Whitney U-test, P=0.053, U=9.000; Mann–Whitney U-test, P=0.739, U=5.000 from left to right. (e) Microscopic images from three independent experiments showing the dentate gyrus stained with Prox1, a marker for granule neurons. Scale bar, 200 μm. Inset shows typical ectopic granule neurons. Scale bar, 20 μm. (f) A graph showing the number of EGCs in the hilus in Veh/Pilo (n=6) and GCV/Pilo group (n=4). Student’s t-test, P=0.045, t(5.004)=2.665. (g) Microscopic images from three independent experiments showing DCX immunoreactivity in epilepsy. Scale bar, 200 μm. Inset shows typical DCX-positive cells in SGZ. Scale bar, 20 μm. (h) A graph showing the number of DCX-expressing cells in the subgranular zone (SGZ) between Veh/Pilo (n=6) and GCV/Pilo (n=4) groups. Mann–Whitney U-test, P=0.831, U=11.000. Data presented as mean±s.e.m. *P<0.05. NS, not significant.

References

    1. Chang B. S. & Lowenstein D. H. Epilepsy. New Engl. J. Med. 349, 1257–1266 (2003) . - PubMed
    1. Engel J. Jr Mesial temporal lobe epilepsy: what have we learned? Neuroscientist 7, 340–352 (2001) . - PubMed
    1. Pitkanen A. & Sutula T. P. Is epilepsy a progressive disorder? Prospects for new therapeutic approaches in temporal-lobe epilepsy. Lancet Neurol. 1, 173–181 (2002) . - PubMed
    1. Eriksson P. S. et al. Neurogenesis in the adult human hippocampus. Nat. Med. 4, 1313–1317 (1998) . - PubMed
    1. Ming G. L. & Song H. Adult neurogenesis in the mammalian central nervous system. Annu. Rev. Neurosci. 28, 223–250 (2005) . - PubMed

Publication types

MeSH terms

Substances

LinkOut - more resources