. 2015 Feb 15:12:18.
doi: 10.1186/s12977-015-0148-6.

An integrated map of HIV genome-wide variation from a population perspective

An integrated map of HIV genome-wide variation from a population perspective

Guangdi Li et al. Retrovirology. .

Abstract

Background: The HIV pandemic is characterized by extensive genetic variability, which has challenged the development of HIV drugs and vaccines. Although HIV genomes have been classified into different types, groups, subtypes and recombinants, a comprehensive study that maps HIV genome-wide diversity at the population level is still lacking to date. This study aims to characterize HIV genomic diversity in large-scale sequence populations, and to identify driving factors that shape HIV genome diversity.

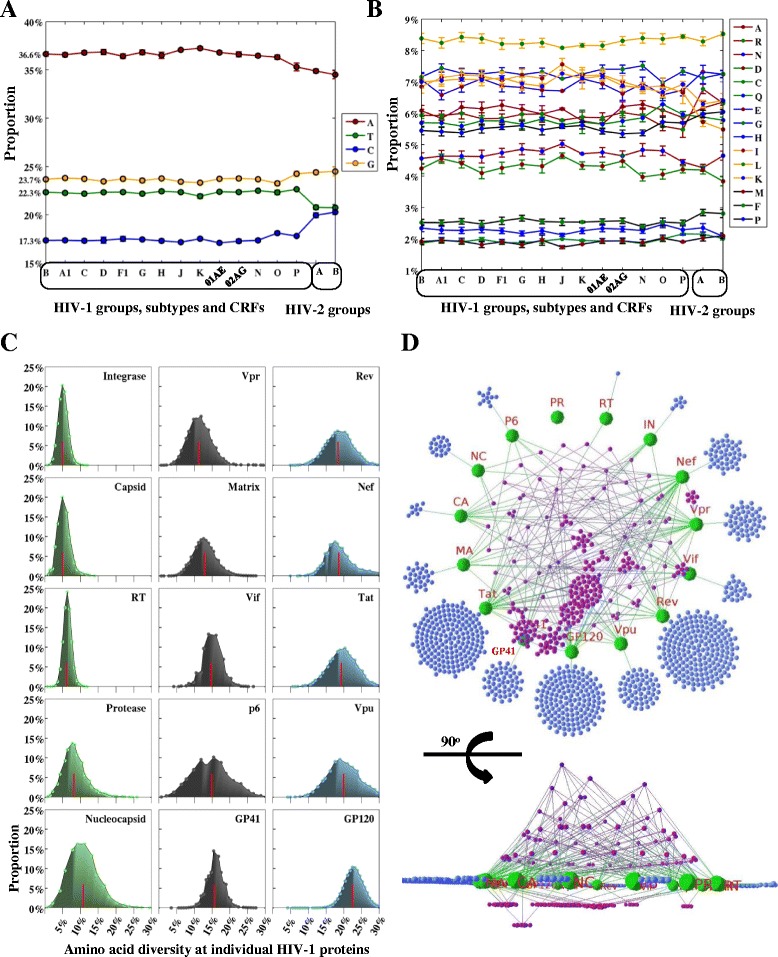
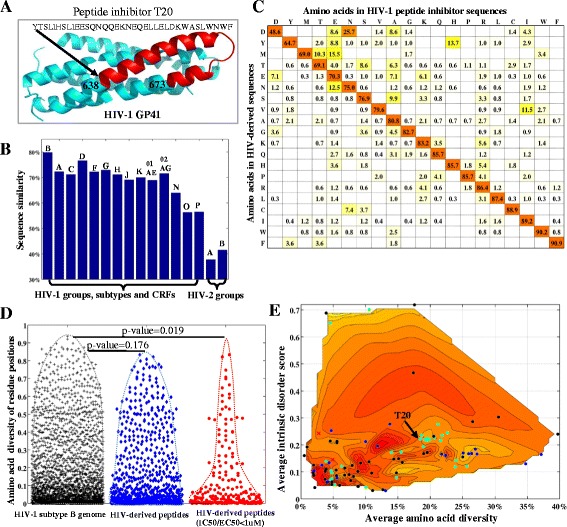
Results: A total of 2996 full-length genomic sequences from 1705 patients infected with 16 major HIV groups, subtypes and circulating recombinant forms (CRFs) were analyzed along with structural, immunological and peptide inhibitor information. Average nucleotide diversity of HIV genomes was almost 50% between HIV-1 and HIV-2 types, 37.5% between HIV-1 groups, 14.7% between HIV-1 subtypes, 8.2% within individual HIV-1 subtypes and less than 1% within single patients. Along the HIV genome, diversity patterns and compositions of nucleotides and amino acids were highly similar across different groups, subtypes and CRFs. Current HIV-derived peptide inhibitors were predominantly derived from conserved, solvent accessible and intrinsically ordered structures in the HIV-1 subtype B genome. We identified these conserved regions in Capsid, Nucleocapsid, Protease, Integrase, Reverse transcriptase, Vpr and the GP41 N terminus as potential drug targets. In the analysis of factors that impact HIV-1 genomic diversity, we focused on protein multimerization, immunological constraints and HIV-human protein interactions. We found that amino acid diversity in monomeric proteins was higher than in multimeric proteins, and diversified positions were preferably located within human CD4 T cell and antibody epitopes. Moreover, intrinsic disorder regions in HIV-1 proteins coincided with high levels of amino acid diversity, facilitating a large number of interactions between HIV-1 and human proteins.

Conclusions: This first large-scale analysis provided a detailed mapping of HIV genomic diversity and highlighted drug-target regions conserved across different groups, subtypes and CRFs. Our findings suggest that, in addition to the impact of protein multimerization and immune selective pressure on HIV-1 diversity, HIV-human protein interactions are facilitated by high variability within intrinsically disordered structures.


Figures

Figure 1
Figure 1
Distribution of HIV genome-wide diversity and phylogenetic tree. (A) Distribution plots of amino acid diversity in the HIV genome. The plots show the genomic diversity within HIV-1 infected patients (HIV-1 intra-patient, blue), within HIV-1 subtypes (HIV-1 intra-subtype, green), between HIV-1 subtypes (HIV-1 inter-subtype, red), between HIV-1 group M and group N (HIV-1 inter-group, yellow), between HIV-1 group M and group O/P (HIV-1 inter-group, black) and between HIV-1 and HIV-2 (pink). Distribution plots of nucleotide genomic diversity are shown in Additional file 1: Figure S2. (B) Maximum likelihood phylogenetic tree of HIV groups and pure subtypes. Green cones indicate HIV-1 subtypes in group M, while orange cones denote other HIV groups. All phylogenetic branches have bootstrap supports of more than 85% except one containing subtypes J, H and C. Branch lengths from the root to HIV-1 and HIV-2 are shortened for visualization purposes. SIV strains were not included in our phylogenetic tree. Visualization software: FigTree V1.4.0 (http://tree.bio.ed.ac.uk/software/figtree/). (C) Distribution plots of amino acid diversity in 6 major HIV-1 subtypes and CRFs (B, A1, C, D, CRF01_AE, CRF02_AG). X- and y-axes indicate the amino acid diversity and the proportions of sequence pairs, respectively. Six subplots in the first and second rows show the intra-subtype amino acid diversity of 6 HIV-1 subtypes and CRFs. Three subplots in the third row show the distribution of inter-subtype genomic diversity (B vs A1, B vs C, B vs 01_AE). One genomic sequence per patient (Table 1) was used for our analysis. Distribution plots of the other inter-clade genomic diversity are shown in Additional file 1: Figure S3. (D) Average inter- and intra-clade genomic diversity of HIV-1 and HIV-2. The top right matrix demonstrates results for amino acid diversity, the bottom left matrix for nucleotide diversity. HIV subtypes and groups are shown on the left side of the matrix.
Figure 2
Figure 2
Plots of amino acid and nucleotide diversity in the HIV full-length genome. (A) Amino acid diversity along the HIV full-length genome using the sliding windows (window size: 100AA; also see the plots of exact diversity values in Additional file 1: Figure S5). Each colored plot shows the density of amino acid diversity for one HIV group, subtype or CRF genome, indicated by the figure legend. Six layers are shown beneath the plots: (1) HIV-1 protein regions (HXB2 reference) are concatenated and shown with abbreviated names (e.g. MA: matrix); (2) peptide-inhibitor-derived region; (3) CD8+ T cell epitope position; (4) CD4+ T cell epitope position; (5) antibody epitope position; (6) HIV-2 protein region (BEN reference). (B) Nucleotide diversity along the full-length HIV genome using sliding windows (window size: 300 nucleotides; also see the plots of exact diversity values in Additional file 1: Figure S6). Each colored plot shows the density of nucleotide diversity for one HIV group, subtype or CRF genome, indicated by the figure legend. Annotated HIV-1 and HIV-2 reference genomes are shown beneath; each track contains one open reading frame (ORF). Long terminal regions in the HIV genome are not shown. (C) Contour map of inter-clade amino acid diversity between HIV-1 subtype B and the other HIV genomes. Inter-clade amino acid diversity was calculated by a sliding window of 30 amino acids over the HIV genome (low: ≤1 AA difference, high: ≥25 AA differences). Five colored layers beneath the contour map are annotated similarly in (A).
Figure 3
Figure 3
Nucleotide and amino acid composition of HIV genomes and 3D mapping of HIV-human protein interactions. (A) Nucleotide composition for HIV-1 and HIV-2. X-axis represents the HIV groups, subtypes and CRFs. Y-axis shows the average proportions of nucleotides (A, T, C, G) using the HIV genomic sequence datasets (one sequence per patient, Table 1). (B) Amino acid composition for HIV-1 and HIV-2. X-axis represents HIV groups, subtypes and CRFs. Y-axis shows the average proportions of amino acids using the HIV protein sequence datasets (one sequence per patient, Table 1). (C) Distribution plots of amino acid genetic diversity for 15 HIV-1 subtype B proteins. Each subplot demonstrates a viral protein. X- and y-axes indicate the amino acid diversity and the proportions of amino acid diversity, respectively. Red lines inside the distribution plots indicate the mean values of amino acid diversity at individual proteins. (D) Top and side views of 3D HIV-human protein interaction networks. HIV-1 proteins with protein names annotated are indicated by green spheres. Human proteins that interact with only one HIV-1 protein are indicated by blue spheres in the outer circle (one human protein one sphere). Human proteins that interact with more than one HIV-1 protein are indicated by purple spheres above the plane of HIV-1 proteins. The height of the layers above the plane indicates the number of HIV proteins that a human protein interacts with. Below, human proteins are clustered if they interact with a set of more than one HIV-1 protein. Abbreviation names have been described in the abbreviation list. Visualization software: Geomi V2.0(http://sydney.edu.au/engineering/it/~visual/geomi2/).
Figure 4
Figure 4
Correlations between HIV-1 protein diversity and HIV-human protein interactions, protein disorder and viral particle structures. (A) Plot of polynomial regression between the HIV-1 protein diversity (x-axis) and the number of HIV-human protein interactions (y-axis). The second-order model is Y=8346X21223X+57.96 (adjusted R-squared: 0.82, root-mean-square error: 42.31). (B) Plot of average protein disorder score and average amino acid diversity in HIV-1 proteins. Red circles indicate the number of HIV-human protein interactions at individual viral proteins, for visualization purpose, scaled between 20 and 200 interactions (proteins with fewer than 20 interactions are scaled to the same size as those with 20, proteins with more than 200 interactions are scaled to the same size as those with 200). Average amino acid diversities of HIV-1 proteins are calculated using subtype B sequences (one genomic sequence per patient, Table 1). (C) Clustering of HIV-1 proteins and schematic view of HIV-1 viral particle. On the left, each colored circle represents a viral protein positioned according to the clusters of protein functions. The size of each red circle indicates the number of HIV-human protein interactions involving each HIV-1 protein (see (B)). On the right, the schematic view of mature viral particle is visualized at the bottom with annotations indicated in the inserted figure legend. Above, surface representations show the structures of HIV-1 proteins that are grouped according to their functional roles. Different units in HIV-1 multimeric proteins are indicated with different colors and HIV-1 monomeric proteins are colored pink. HIV-1 protein structures are scaled according to their precise protein sizes for direct comparison. Visualization software: PyMOL V1.5 (http://www.pymol.org/).
Figure 5
Figure 5
Characterization of HIV-derived peptide inhibitors. (A) Cartoon representation of GP41 structure. The red structure indicates the region from which peptide inhibitor T20 was derived (PDB: 3H01). (B) Bar plot of sequence similarities between peptide inhibitor sequences and the sequences of HIV-derived regions in the consensus genome of different HIV clades. X-axis presents the HIV groups, subtypes and CRFs. Y-axis shows the sequence similarity between peptide inhibitor sequences and the sequences of HIV-derived regions in the consensus genomes of HIV groups, subtypes or CRFs. (C) Amino acid replacements between peptide inhibitor sequences and HIV-derived regions in the subtype B genome. The percentage values (%) are colored using heat maps. (D) Distribution (bee-swarm) plots of amino acid diversity in the full-length subtype B genome (black crosses), peptide-derived regions (blue diamonds) and peptide-derived regions of those inhibitors whose IC50/EC50 are less than 1 μM (red circles). Each shape represents the amino acid diversity at one protein position. Two-sample Kolmogorov-Smirnov tests were performed to compare diversity distributions (significance level: 0.05). (E) Plot of amino acid diversity (x-axis), disorder score (y-axis) and solvent accessible surface area of peptide-inhibitor-derived regions (contour map, darker red indicates larger accessible surface areas). GP41 inhibitor T20 is also annotated. For individual peptide inhibitors, the average amino acid diversity, disorder score and solvent accessible surface areas are shown in Additional file 1: Figure S9, S10 and S11, respectively.
Figure 6
Figure 6
An integrated map of HIV-1 genomic diversity and protein structures. All 15 HIV-1 proteins are mapped in the circle with 8 layers, showing the schematic view of HIV-1 peptide inhibitors (layer 1), protein secondary structures (layer 2, dark blue: helix structures, light blue: beta-strand structures, white: random-coil structures), protein disorder scores (layer 3), amino acid diversity at individual positions (layer 4), human CD4/CD8/antibody epitope regions (layer 5, three sub-layers from inside to outside represent CD8+ T cell, CD4+ T cell and antibody epitope regions), HXB2 reference indices (layer 6), peptide-inhibitor-derived regions (layer 7) and the protein structures are colored according to the diversity of amino acid positions (layer 8, low: 0%, high: ≥30%). Three major genes (gag, pol, env) are annotated in the center. Structures of multimeric HIV-1 proteins are shown outside the circle and different protein units are colored separately. The list of PDB data is available in Additional file 2: Table S5. Visualization software: Circos V0.64 (http://circos.ca/).

References

    1. Hemelaar J. The origin and diversity of the HIV-1 pandemic. Trends Mol Med. 2012;18:182–92. doi: 10.1016/j.molmed.2011.12.001. - DOI - PubMed
    1. Gaschen B, Taylor J, Yusim K, Foley B, Gao F, Lang D, et al. Diversity considerations in HIV-1 vaccine selection. Science. 2002;296:2354–60. doi: 10.1126/science.1070441. - DOI - PubMed
    1. Frankel AD, Young JA. HIV-1: fifteen proteins and an RNA. Annu Rev Biochem. 1998;67:1–25. doi: 10.1146/annurev.biochem.67.1.1. - DOI - PubMed
    1. Engelman A, Cherepanov P. The structural biology of HIV-1: mechanistic and therapeutic insights. Nat Rev Microbiol. 2012;10:279–90. doi: 10.1038/nrmicro2747. - DOI - PMC - PubMed
    1. Acosta EG, Kumar A, Bartenschlager R. Revisiting dengue virus-host cell interaction: new insights into molecular and cellular virology. Adv Virus Res. 2014;88:1–109. doi: 10.1016/B978-0-12-800098-4.00001-5. - DOI - PubMed

Publication types