. 2016 Jan;26(1):43-61.
doi: 10.1111/bpa.12263. Epub 2015 May 19.

Specific Preferences in Lineage Choice and Phenotypic Plasticity of Glioma Stem Cells Under BMP4 and Noggin Influence

Affiliations

Specific Preferences in Lineage Choice and Phenotypic Plasticity of Glioma Stem Cells Under BMP4 and Noggin Influence

Guillermo Agustín Videla Richardson et al. Brain Pathol. 2016 Jan.

Abstract

Although BMP4-induced differentiation of glioma stem cells (GSCs) is well recognized, details of the cellular responses triggered by this morphogen are still poorly defined. In this study, we established several GSC-enriched cell lines (GSC-ECLs) from high-grade gliomas. The expansion of these cells as adherent monolayers, and not as floating neurospheres, enabled a thorough study of the phenotypic changes that occurred during their differentiation. Herein, we evaluated GSC-ECLs' behavior toward differentiating conditions by depriving them of growth factors and/or by adding BMP4 at different concentrations. After analyzing cellular morphology, proliferation and lineage marker expression, we determined that GSC-ECLs have distinct preferences in lineage choice, where some of them showed an astrocyte fate commitment and others a neuronal one. We found that this election seems to be dictated by the expression pattern of BMP signaling components present in each GSC-ECL. Additionally, treatment of GSC-ECLs with the BMP antagonist, Noggin, also led to evident phenotypic changes. Interestingly, under certain conditions, some GSC-ECLs adopted an unexpected smooth muscle-like phenotype. As a whole, our findings illustrate the wide differentiation potential of GSCs, highlighting their molecular complexity and paving a way to facilitate personalized differentiating therapies.

Keywords: BMP4; Noggin; cancer stem cells; differentiation; glioblastoma; multipotency.


Conflict of interest statement

The authors declare that they have no conflict of interest.

Figures

Figure 1
Figure 1
Characterization of glioma stem cell‐enriched cell lines (GSCECLs). A. Analysis of CD133 mRNA expression levels by quantitative real‐time polymerase chain reaction (RTPCR) in GSC‐ECLs. gapdh expression was used as normalizer. Graphs show mRNA fold change relative to human foreskin fibroblasts (HF). Bars represent the mean ± SEM of three different experiments performed in triplicate (top panel). Representative flow cytometry histogram overlays of GSCECLs are shown to visualize CD133 expression relative to isotype control (middle panel). The table shows the results obtained by flow cytometry expressed as mean fluorescence intensity (MFI) and percentage of CD133 + cells. Data represent mean ± SD of MFI and percentages of CD133 + cells from three independent experiments (bottom panel). B. Representative immunofluorescent images of GSCECLs stained with antibodies against Nestin, Vimentin, CD44 and Sox2. Nuclei were counterstained with 4,6‐diamidino‐2‐phenylindole (DAPI). Objective 20×; scale bar, 50 μm. C. Representative micrographs of xenograft biopsies from G02 GSCECL. Hematoxylin and eosin‐stained (H&E) sections showing an evident increase in cellularity. Objectives 2× and 20×; scale bars, 500 and 50 μm, respectively (left panels). Immunohistochemical stains illustrating the distribution of human glial fibrillary acidic protein (GFAP) and Ki67. Objective 40×; scale bars, 25 μm (right panels). D. GSCECL doubling time. Data represent mean ± SD from three independent experiments performed in triplicate.
Figure 2
Figure 2
Lineage choice of glioma stem cell‐enriched cell lines (GSCECLs) under distinct differentiating conditions. Representative phase contrast and immunofluorescent images of the G02, G03 and G05 cell lines after 21 days under defined experimental conditions: proliferating conditions, growth factor (bFGF and EGF) withdrawal and growth factor withdrawal plus BMP4 addition (0.5 or 10 ng/mL). Cells were stained with antibodies against MAP2 and glial fibrillary acidic protein (GFAP). Nuclei were counterstained with 4,6‐diamidino‐2‐phenylindole (DAPI). Objective 20×; scale bar, 50 μm. Percentages of positive cells (single‐ or double‐stained) or double‐negative cells were quantified by normalization with total cells (DAPI‐stained nuclei) (right panel). GF = growth factors.
Figure 3
Figure 3
Lineage choice of glioma stem cell‐enriched cell lines (GSCECLs) under distinct differentiating conditions. Representative phase contrast and immunofluorescent images of the G07, G08 and G09 cell lines after 21 days under defined experimental conditions: proliferating conditions, growth factor (bFGF and EGF) withdrawal and growth factor withdrawal plus BMP4 addition (0.5 or 10 ng/mL). Cells were stained with antibodies against MAP2 and glial fibrillary acidic protein (GFAP). Nuclei were counterstained with 4,6‐diamidino‐2‐phenylindole (DAPI). Objective 20×; scale bar, 50 μm. Percentages of positive cells (single‐ or double‐stained) or double‐negative cells were quantified by normalization with total cells (DAPI‐stained nuclei) (right panel). GF = growth factors.
Figure 4
Figure 4
Lineage and stem cell markers expression levels under distinct differentiating conditions. A. Analysis of glial fibrillary acidic protein (GFAP) and MAP2 mRNA expression levels by quantitative real‐time polymerase chain reaction (RTPCR) in glioma stem cell‐enriched cell lines (GSCECLs) exposed for 21 days to the experimental conditions depicted in the figure. gapdh expression was used as normalizer. Graphs show mRNA fold change relative to human foreskin fibroblasts (HF). Bars represent the mean ± SEM of three different experiments performed in triplicate. In all cases, a paired Student's t‐test was used to compare differentiated cells to the respective undifferentiated counterparts (*P < 0.05; *P < 0.01). B. Representative flow cytometry histograms overlays of differentiated G07, G08 and G09 GSCECLs in the absence of growth factors and in the absence of growth factors plus 10 ng/mL BMP4 for 21 days are shown to visualize CD133 expression relative to their respective isotype controls. The table shows the results obtained by flow cytometry expressed as mean percentage of CD133 + cells. Data represent mean ± SD of percentages of CD133 + cells from three independent experiments (bottom table). GF = growth factors; L and H = low and high concentrations of BMP4, respectively.
Figure 5
Figure 5
Noggin influences lineage choice along differentiation of glioma stem cell‐enriched cell lines (GSCECLs). Representative immunofluorescent images of the G03, G08 and G09 cell lines after 21 days of growth factor (bFGF and EGF) withdrawal in the presence or absence of Noggin (250 ng/mL). Cells were stained with antibodies against glial fibrillary acidic protein (GFAP) and MAP2. Nuclei were counterstained with 4,6‐diamidino‐2‐phenylindole (DAPI). Objective 20×; scale bars, 50 μm. Percentages of positive cells (single‐ or double‐stained) or double‐negative cells were quantified by normalization with total cells (DAPI‐stained nuclei) (right panel). Student's t‐test was used to compare percentages of cells under the aforementioned conditions *P < 0.05, **P < 0.01, ***P < 0.001. GF = growth factors; ns = not significant.
Figure 6
Figure 6
Bone morphogenetic protein (BMP) signaling status influences the phenotype of proliferating glioma stem cell‐enriched cell lines (GSCECLs). Representative immunofluorescent images of the G03, G08 and G09 cell lines after 21 days in proliferating conditions (+GF) either in the presence of Noggin (250 ng/mL) or BMP4 (10 ng/mL). Cells were stained with antibodies against glial fibrillary acidic protein (GFAP) and MAP2. Nuclei were counterstained with 4,6‐diamidino‐2‐phenylindole (DAPI). Objective 20×; scale bars, 50 μm. Percentages of positive cells (single‐ or double‐stained) or double‐negative cells were quantified by normalization with total cells (DAPI‐stained nuclei) (right panel).
Figure 7
Figure 7
Glioma stem cell‐enriched cell lines (GSCECLs) can adopt a smooth muscle‐like phenotype upon specific differentiating stimuli. A. Representative immunofluorescent images of the G03, G08 and G09 cell lines cultured for 21 days under the experimental conditions depicted in the figure. Cells were stained with an antibody against alpha smooth muscle actin (α‐SMA). Nuclei were counterstained with 4,6‐diamidino‐2‐phenylindole (DAPI). Objective 20×; scale bar, 50 μm. B. Representative immunofluorescent images of G03 and G09 GSCECLs grown for 21 days under the experimental conditions depicted in the figure and stained with antibodies against α‐SMA and glial fibrillary acidic protein (GFAP). Percentages of positive cells (single‐ or double‐stained) or double‐negative cells were quantified by normalization with total cells (DAPI‐stained nuclei). Objective 20×; scale bars, 50 μm. C. Analysis of h‐Caldesmon, Calponin‐1 and Transgelin mRNA levels by quantitative real‐time polymerase chain reaction (RTPCR) in G03, G05 and G09 GSCECLs under the experimental conditions described in the figure. gapdh expression was used as normalizer. Graphs show mRNA fold change relative to undifferentiated G03 cells, arbitrarily set as 1 for each of analyzed transcript. In all cases, a paired Student's t‐test was used to compare differentiated cells to the respective undifferentiated counterparts (*P < 0.05; *P < 0.01). GF = growth factors; L and H = low and high concentrations of BMP4, respectively.
Figure 8
Figure 8
Differentiating conditions reduce Ki67 immunoreactivity. Quantification of KI67+ cells under proliferation‐permissive conditions (+GF) and after 21 days in distinct differentiating conditions (depicted in the figure). Cells were stained for both Ki67 and 4,6‐diamidino‐2‐phenylindole (DAPI). Data show mean ± SD of three independent experiments where four random fields were counted. In each case Ki67+ cells were expressed as a percentage of total cell number (DAPI‐stained nuclei). Student's t‐test was used to compare percentages of dividing cells under differentiating conditions with cells under a proliferation‐permissive condition. *P < 0.05, **P < 0.01, ***P < 0.001. GF = growth factors.
Figure 9
Figure 9
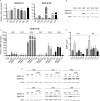
Glioma stem cell‐enriched cell lines (GSCECLs) exhibit characteristic expression patterns of BMPR1A, BMPR1B and BMP4. A. Analysis of BMPR1A and BMPR1B mRNAs expression levels by quantitative real‐time polymerase chain reaction (RTPCR) in GSCECLs. gapdh expression was used as normalizer. Graphs show mRNA fold change relative to human foreskin fibroblasts (HF). Bars represent the mean ± SEM of three different experiments performed in triplicate. B. Western blot analysis of undifferentiated GSCECLs, using specific antibodies against BMPR1A, BMPR1B and actin (loading control). C. Analysis of BMPR1B mRNA expression levels by quantitative RTPCR in GSCECLs exposed for 21 days to the experimental conditions depicted in the figure. gapdh expression was used as normalizer. Graphs show mRNA fold change relative to HF. Bars represent the mean ± SEM of three different experiments performed in triplicate. In all cases, a paired Student's t‐test was used to compare differentiated cells to the respective undifferentiated counterparts (*P < 0.05; *P < 0.01). D. Western blot analysis of undifferentiated and differentiated GSCECLs exposed for 21 days to the experimental conditions depicted in the figure, using specific antibodies against BMPR1A, BMPR1B and actin (loading control). E. The amount of secreted BMP4 by GSCECLs in the presence or in the absence of growth factors for 21 days was quantified by ELISA in cell supernatants. The results are expressed as mean ± SD for three culture wells in triplicate experiments. A paired Student's t‐test was used to compare the amount of BMP4 secreted by each GSCECLs to the amount of BMP4 secreted by the G03 cell line (*P < 0.01) or to compare the amount of BMP4 secreted by each differentiated GSCECL to the amount of BMP4 secreted by their respective undifferentiated counterparts (#P < 0.05). GF = growth factors; L and H = low and high concentrations of BMP4, respectively.

References

    1. Assinder SJ, Stanton JA, Prasad PD (2009) Transgelin: an actin‐binding protein and tumour suppressor. Int J Biochem Cell Biol 41:482–486. - PubMed
    1. Bao S, Wu Q, McLendon RE, Hao Y, Shi Q, Hjelmeland AB et al (2006) Glioma stem cells promote radioresistance by preferential activation of the DNA damage response. Nature 444:756–760. - PubMed
    1. Berggren P, Kumar R, Sakano S, Hemminki L, Wada T, Steineck G et al (2003) Detecting homozygous deletions in the CDKN2A[p16(INK4a)]/ARF[p14(ARF)] gene in urinary bladder cancer using real‐time quantitative PCR. Clin Cancer Res 9:235–242. - PubMed
    1. Bjornson CR, Rietze RL, Reynolds BA, Magli MC, Vescovi AL (1999) Turning brain into blood: a hematopoietic fate adopted by adult neural stem cells in vivo . Science 283:534–537. - PubMed
    1. Bonaguidi MA, McGuire T, Hu M, Kan L, Samanta J, Kessler JA (2005) LIF and BMP signaling generate separate and discrete types of GFAP‐expressing cells. Development 132:5503–5514. - PubMed

Publication types

MeSH terms