

Molecular profiling of ETS and non-ETS aberrations in prostate cancer patients from northern India
- PMID: 25809148
- PMCID: PMC4832366
- DOI: 10.1002/pros.22989
Molecular profiling of ETS and non-ETS aberrations in prostate cancer patients from northern India
Erratum in
-
Molecular profiling of ETS and non-ETS aberrations in prostate cancer patients from northern India.Prostate. 2021 May;81(6):357-358. doi: 10.1002/pros.24111. Epub 2021 Mar 8. Prostate. 2021. PMID: 33683724 Free PMC article. No abstract available.
Abstract
Background: Molecular stratification of prostate cancer (PCa) based on genetic aberrations including ETS or RAF gene-rearrangements, PTEN deletion, and SPINK1 over-expression show clear prognostic and diagnostic utility. Gene rearrangements involving ETS transcription factors are frequent pathogenetic somatic events observed in PCa. Incidence of ETS rearrangements in Caucasian PCa patients has been reported, however, occurrence in Indian population is largely unknown. The aim of this study was to determine the prevalence of the ETS and RAF kinase gene rearrangements, SPINK1 over-expression, and PTEN deletion in this cohort.
Methods: In this multi-center study, formalin-fixed paraffin embedded (FFPE) PCa specimens (n = 121) were procured from four major medical institutions in India. The tissues were sectioned and molecular profiling was done using immunohistochemistry (IHC), RNA in situ hybridization (RNA-ISH) and/or fluorescence in situ hybridization (FISH).
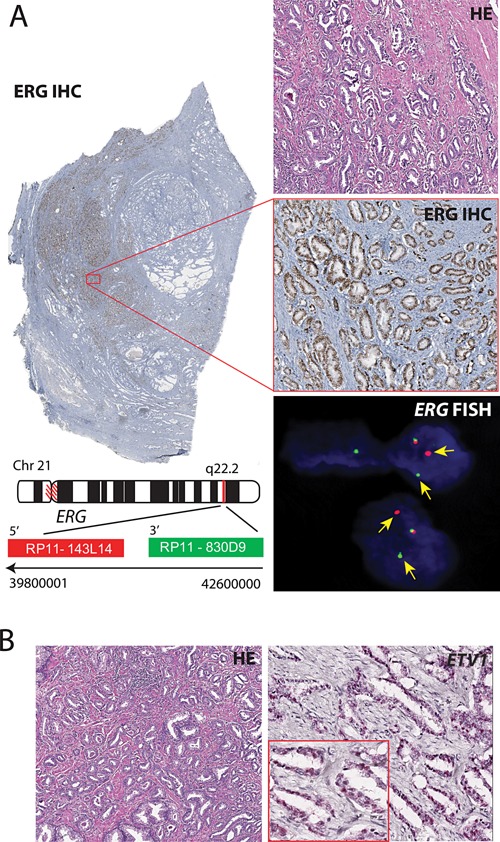
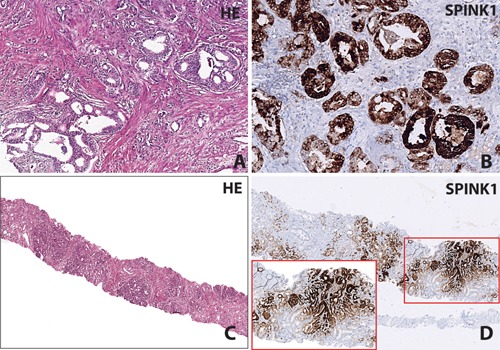
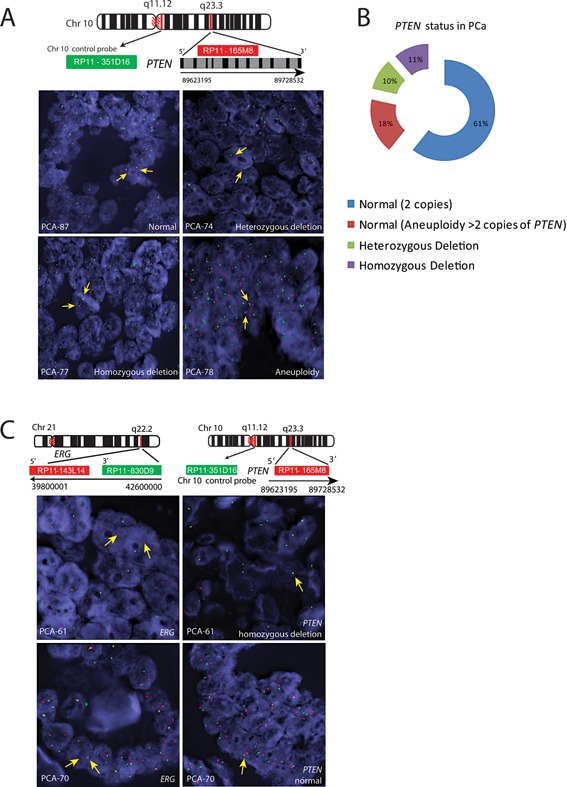
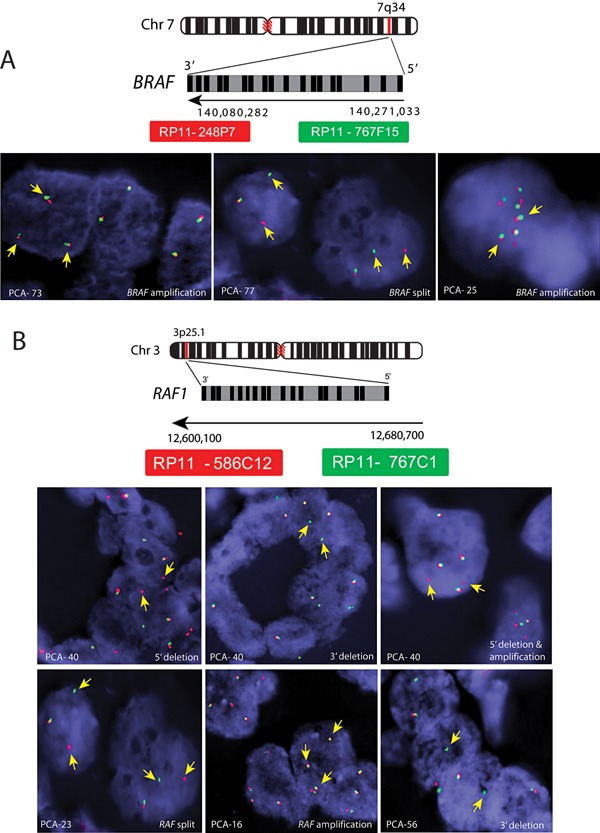
Results: ERG over-expression was detected in 48.9% (46/94) PCa specimens by IHC, which was confirmed in a subset of cases by FISH. Among other ETS family members, while ETV1 transcript was detected in one case by RNA-ISH, no alteration in ETV4 was observed. SPINK1 over-expression was observed in 12.5% (12/96) and PTEN deletion in 21.52% (17/79) of the total PCa cases. Interestingly, PTEN deletion was found in 30% of the ERG-positive cases (P = 0.017) but in only one case with SPINK1 over-expression (P = 0.67). BRAF and RAF1 gene rearrangements were detected in ∼1% and ∼4.5% of the PCa cases, respectively.
Conclusions: This is the first report on comprehensive molecular profiling of the major spectrum of the causal aberrations in Indian men with PCa. Our findings suggest that ETS gene rearrangement and SPINK1 over-expression patterns in North Indian population largely resembled those observed in Caucasian population but differed from Japanese and Chinese PCa patients. The molecular profiling data presented in this study could help in clinical decision-making for the pursuit of surgery, diagnosis, and in selection of therapeutic intervention.
Keywords: PTEN; RAF kinase; SPINK1; TMPRSS2-ERG; genetic rearrangements.
© 2015 The Authors. The Prostate, published by Wiley Periodicals, Inc.
Figures
References
-
- Takiar R, Vijay CR. An alternative approach to study the changes in the cancer pattern of men in India (1988–2005). Asian Pac J Cancer Prev 2011; 12(4):875–878. - PubMed
-
- Swaminathan R, Shanta V, Ferlay J, Balasubramanian S, Bray F, Sankaranarayanan R. Trends in cancer incidence in Chennai city (1982–2006) and statewide predictions of future burden in Tamil Nadu (2007–16). Natl Med J India 2011; 24(2):72–77. - PubMed
-
- Tomlins SA, Rhodes DR, Perner S, Dhanasekaran SM, Mehra R, Sun XW, Varambally S, Cao X, Tchinda J, Kuefer R, Montie JE, Shah RB, Pienta KJ, Chinnaiyan AM. Recurrent fusion of TMPRSS2 and ETS transcription factor genes in prostate cancer. Science 2005; 310(5748):644–648. - PubMed
-
- Leinonen KA, Tolonen TT, Bracken H, Stenman UH, Tammela TL, Saramaki OR, Visakorpi T. Association of SPINK1 expression and TMPRSS2:ERG fusion with prognosis in endocrine? Treated prostate cancer. Clin Cancer Res 2010; 16(10):2845–2851. - PubMed
Publication types
MeSH terms
Substances
Grants and funding
LinkOut - more resources
Full Text Sources
Other Literature Sources
Medical
Research Materials
Miscellaneous
