. 2015 Oct;10(10):1413-23.
doi: 10.1093/scan/nsv029. Epub 2015 Mar 25.

Age-related changes in intrinsic function of the superior temporal sulcus in autism spectrum disorders

Affiliations

Age-related changes in intrinsic function of the superior temporal sulcus in autism spectrum disorders

Kaat Alaerts et al. Soc Cogn Affect Neurosci. 2015 Oct.

Abstract

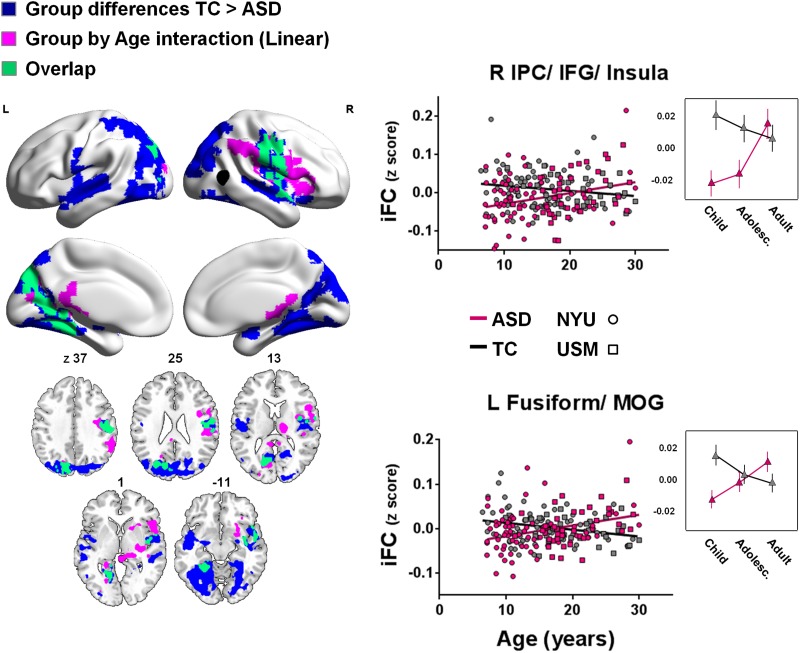
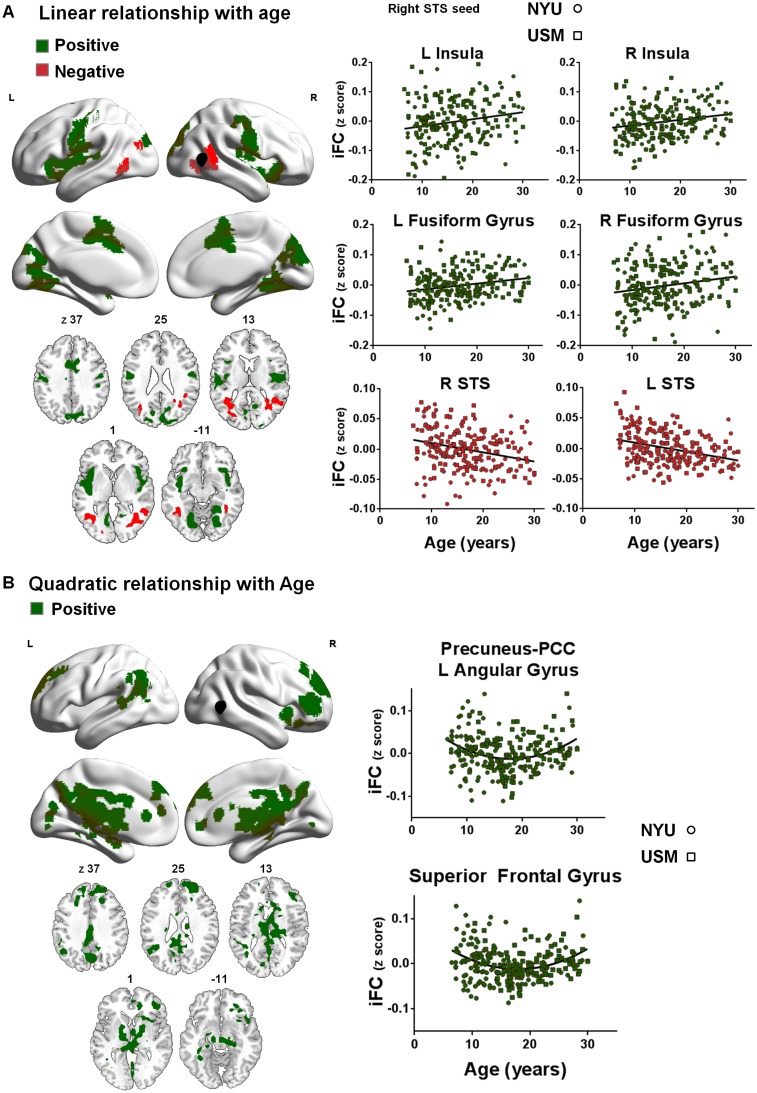
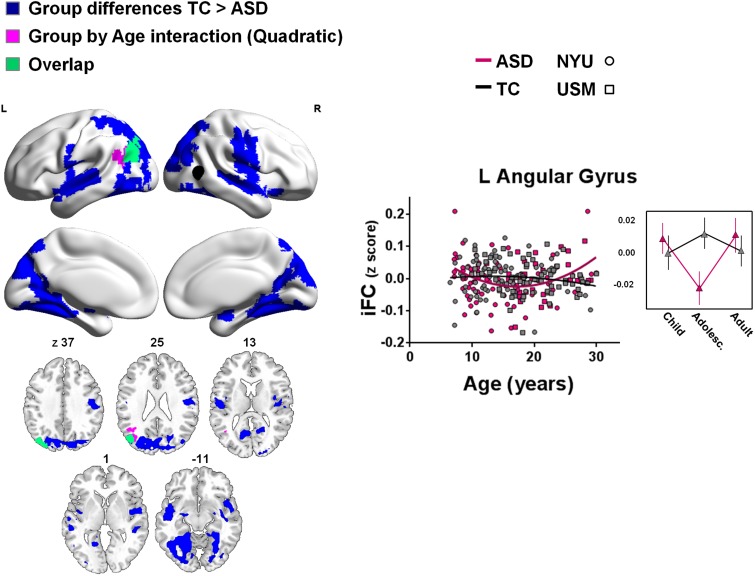
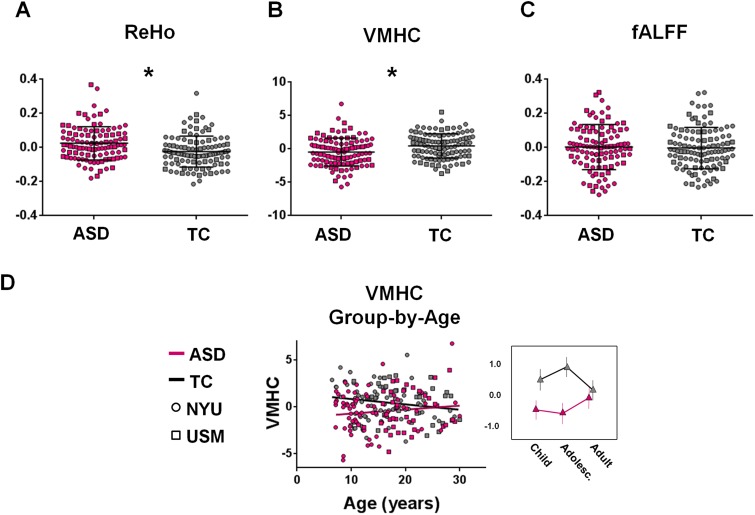
Currently, the developmental trajectories of neural circuits implicated in autism spectrum disorders (ASD) are largely unknown. Here, we specifically focused on age-related changes in the functional circuitry of the posterior superior temporal sulcus (pSTS), a key hub underlying social-cognitive processes known to be impaired in ASD. Using a cross-sectional approach, we analysed resting-state functional magnetic resonance imaging (fMRI) data collected from children, adolescents and adults available through the autism brain imaging data exchange repository [n = 106 with ASD and n = 109 typical controls (TC), ages 7-30 years]. The observed age-related changes of pSTS intrinsic functional connectivity (iFC) suggest that no single developmental pattern characterizes ASD. Instead, pSTS circuitry displayed a complex developmental picture, with some functional circuits showing patterns consistent with atypical development in ASD relative to TC (pSTS-iFC with fusiform gyrus and angular gyrus) and others showing delayed maturation (pSTS-iFC with regions of the action perception network). Distinct developmental trajectories in different functional circuits in ASD likely reflect differential age-related changes in the socio-cognitive processes they underlie. Increasing insight on these mechanisms is a critical step in the development of age-specific interventions in ASD.

Keywords: autism brain imaging data exchange; autism spectrum disorders; developmental changes; intrinsic functional connectivity; posterior superior temporal sulcus.


Figures

Fig. 1
Fig. 1
Main effects of group and linear group-by-age interaction effects for right pSTS iFC. Shown are clusters for which group differences (TC > ASD) (blue) or linear group-by-age interactions (purple) were observed (min Z > 2.3; cluster significance: P < 0.05, corrected). The right pSTS seed is illustrated in black. The scatter plots and adjacent line plots show the linear group-by-age interactions (i.e. individual participants’ iFC-scores for the clusters shown in purple). In the line plots, age ranges are grouped for childhood: 7–12.8 years; adolescence: 12.9–18.6 years and adulthood: 18.7–30.0 years. Relationships with age are plotted separately for the ASD (pink) and TC groups (gray). NYU participants are displayed as circles; USM participants as squares. Significant clusters are overlaid on inflated surface maps generated using BrainNet Viewer (http://www.nitrc.org/projects/bnv/), as well as on axial images generated with MRIcroN (http://www.mricro.com/). L, left hemisphere; R, right hemisphere. Vertical lines in the line plots denote SEM.
Fig. 2
Fig. 2
Linear (A) and quadratic (B) effects of age (7–30 years) for right pSTS iFC. Panel A depicts clusters in which iFC increased (green) or decreased (red) linearly as a function of age. Panel B depicts clusters in which iFC increased (green) quadratically as a function of age (min Z > 2.3; cluster significance: P < 0.05, corrected). The right pSTS seed is illustrated in black. The scatter plots show the positive (green) or negative (red) relationships with age across all participants (ASD and TC groups combined). NYU participants are displayed as circles; USM participants as squares. Significant clusters are overlaid on inflated surface maps generated using BrainNet Viewer (http://www.nitrc.org/projects/bnv/), as well as on axial images generated with MRIcroN (http://www.mricro.com/). L, left hemisphere; R, right hemisphere.
Fig. 3
Fig. 3
Effects of group and quadratic group-by-age interaction effects for right pSTS iFC. Shown are clusters for which group differences (TC > ASD) (blue) or group-by-age (quadratic) interaction effects (purple) were observed (min Z > 2.3; cluster significance: P < 0.05, corrected). The right pSTS seed is illustrated in black. The scatter plot and adjacent line plot show the quadratic group-by-age interaction (i.e. individual participants’ iFC-scores for the cluster shown in purple). In the line plot, age ranges are grouped for childhood: 7–12.8 years; adolescence: 12.9–18.6 years and adulthood: 18.7–30.0 years. Relationships with age are plotted separately for the ASD (pink) and TC groups (gray). NYU participants are displayed as circles; USM participants as squares. Significant clusters are overlaid on inflated surface maps generated using BrainNet Viewer (http://www.nitrc.org/projects/bnv/), as well as on axial images generated with MRIcroN (http://www.mricro.com/). L, left hemisphere; R, right hemisphere. Vertical lines in the line plots denote SEM.
Fig. 4
Fig. 4
Exploration of regional measures of intrinsic brain architecture within the right pSTS. Panel A shows mean ReHo for participants with ASD (pink) and TC (gray). Participants with ASD exhibited significantly higher ‘local’ (ReHo) connectivity than the TC group. Panel B shows mean VMHC for participants with ASD (pink) and TC (gray). Participants with ASD exhibited significantly lower inter-hemispheric ‘mirrored’ (VMHC) intrinsic connectivity than the TC group. Panel C shows fALFF connectivity for participants with ASD (pink) and TC (gray). No group differences were observed in fALFF. The scatter plot and line plot in panel D show the linear group-by-age interaction obtained for VMHC, which indicates that group differences in VMHC were more pronounced at the younger ages and diminished with increasing age. In the line plot, age ranges are grouped for childhood: 7–12.8 years; adolescence: 12.9–18.6 years and adulthood: 18.7–30.0 years. VMHC is plotted as a function of age, separately for the ASD (pink) and TC groups (gray). NYU participants are displayed as circles; USM participants as squares. Vertical lines in panel A–C denote s.d. *P < 0.05 (corrected).

References

    1. Akaike H. New look at statistical-model identification. Transactions on Automatic Control. 1974;19:716–23.
    1. Alaerts K, Woolley DG, Steyaert J, Di MA, Swinnen SP, Wenderoth N. Underconnectivity of the superior temporal sulcus predicts emotion recognition deficits in autism. Social Cognitive and Affective Neuroscience. 2014;9:1589–600. - PMC - PubMed
    1. Allen EA, Damaraju E, Plis SM, Erhardt EB, Eichele T, Calhoun VD. Tracking whole-brain connectivity dynamics in the resting state. Cerebral Cortex. 2014;24:663–76. - PMC - PubMed
    1. Allison T, Puce A, McCarthy G. Social perception from visual cues: role of the STS region. Trends in Cognitive Science. 2000;4:267–78. - PubMed
    1. Anderson JS, Druzgal TJ, Froehlich A, et al. Decreased interhemispheric functional connectivity in autism. Cerebral Cortex. 2011;21:1134–46. - PMC - PubMed

Publication types