. 2015 Jul;146(1):31-42.
doi: 10.1093/toxsci/kfv068. Epub 2015 Mar 25.

Mitochondrial Toxicity of Cadmium Telluride Quantum Dot Nanoparticles in Mammalian Hepatocytes

Affiliations

Mitochondrial Toxicity of Cadmium Telluride Quantum Dot Nanoparticles in Mammalian Hepatocytes

Kathy C Nguyen et al. Toxicol Sci. 2015 Jul.

Abstract

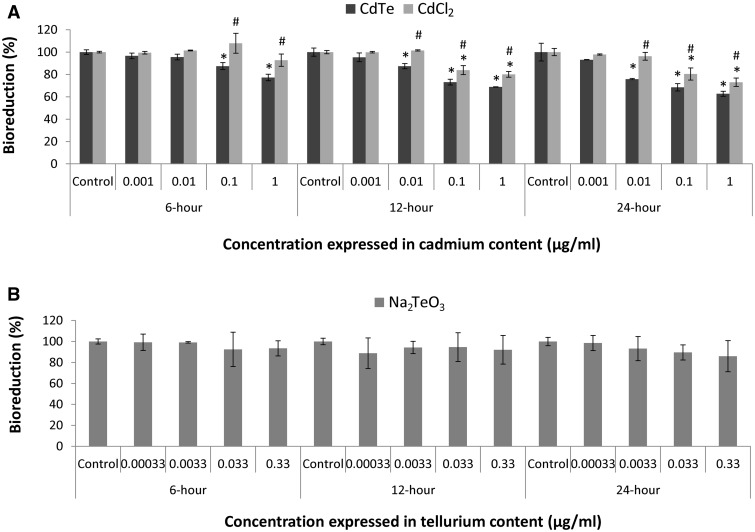
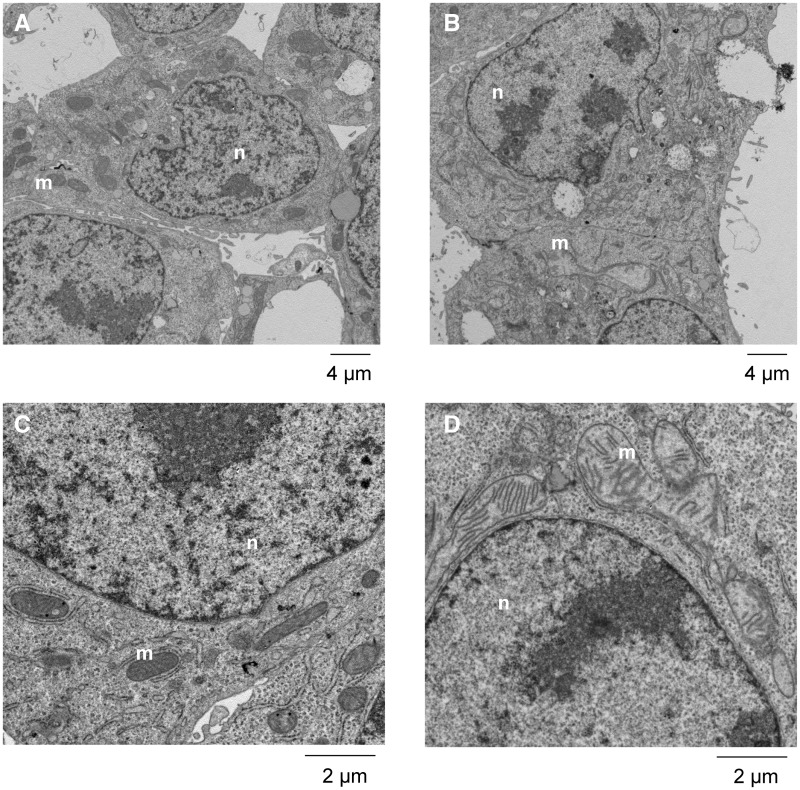
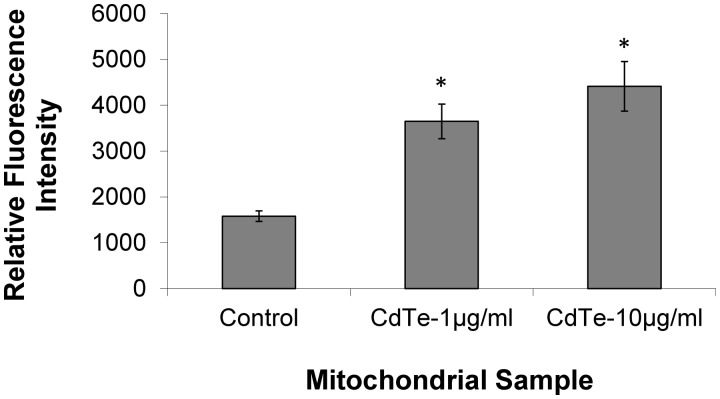
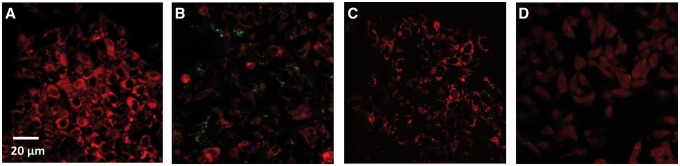
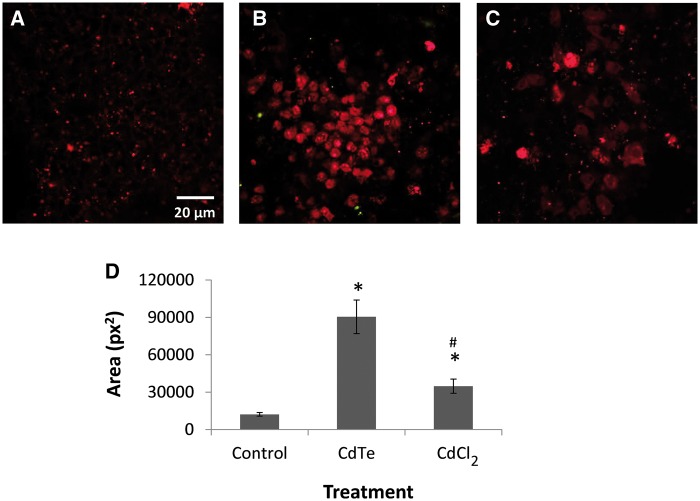
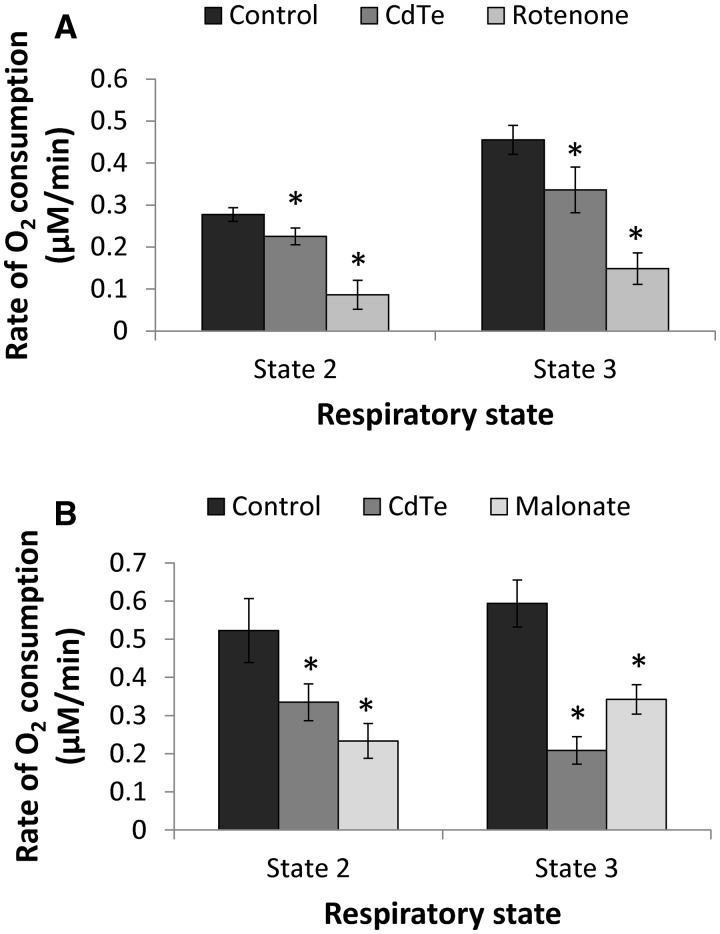
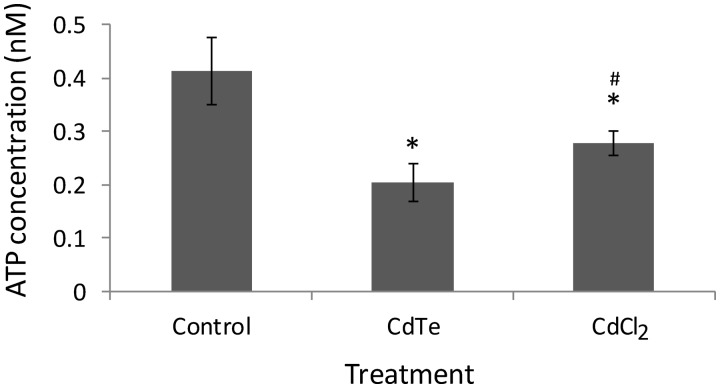
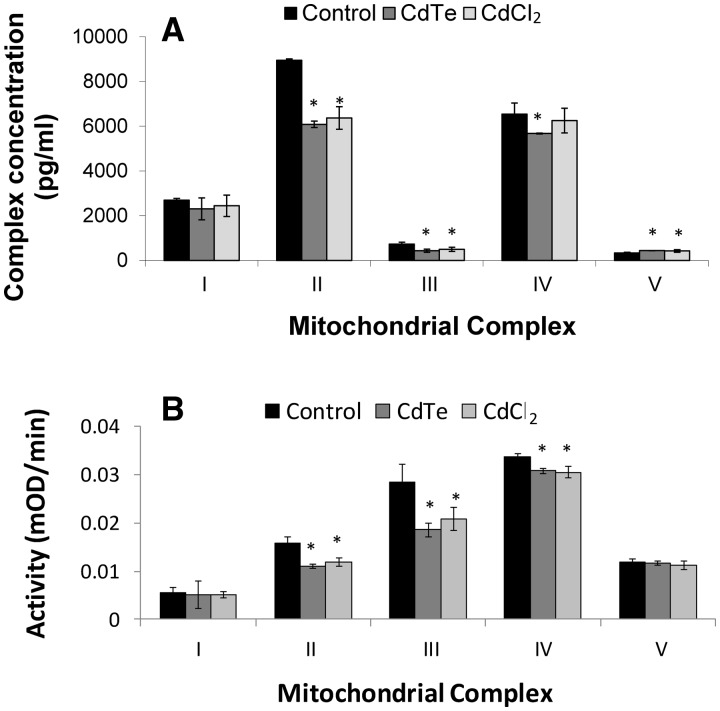
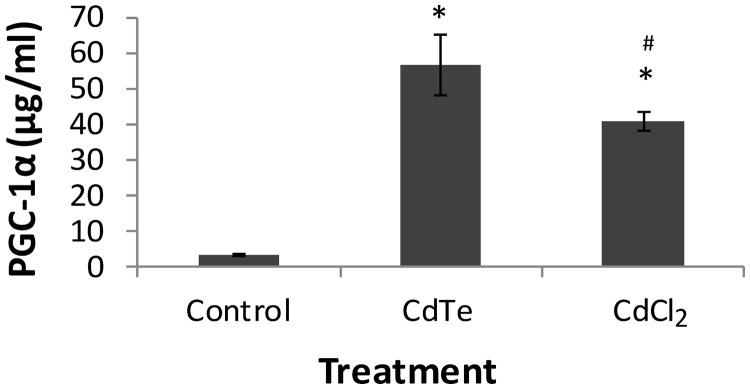
There are an increasing number of studies indicating that mitochondria are relevant targets in nanomaterial-induced toxicity. However, the underlying mechanisms by which nanoparticles (NPs) interact with these organelles and affect their functions are unknown. The aim of this study was to investigate the effects of cadmium telluride quantum dot (CdTe-QD) NPs on mitochondria in human hepatocellular carcinoma HepG2 cells. CdTe-QD treatment resulted in the enlargement of mitochondria as examined with transmission electron microscopy and confocal microscopy. CdTe-QDs appeared to associate with the isolated mitochondria as detected by their inherent fluorescence. Further analyses revealed that CdTe-QD caused disruption of mitochondrial membrane potential, increased intracellular calcium levels, impaired cellular respiration, and decreased adenosine triphosphate synthesis. The effects of CdTe-QDs on mitochondrial oxidative phosphorylation were evidenced by changes in levels and activities of the enzymes of the electron transport chain. Elevation of peroxisome proliferator-activated receptor-γ coactivator levels after CdTe-QD treatment suggested the effects of CdTe-QDs on mitochondrial biogenesis. Our results also showed that the effects of CdTe-QDs were similar or greater to those of cadmium chloride at equivalent concentrations of cadmium, suggesting that the toxic effects of CdTe-QDs were not solely due to cadmium released from the NPs. Overall, the study demonstrated that CdTe-QDs induced multifarious toxicity by causing changes in mitochondrial morphology and structure, as well as impairing their function and stimulating their biogenesis.

Keywords: cadmium telluride quantum dots; cellular respiration; electron transport chain; hepatocytes; membrane potential; mitochondria.


Figures

FIG. 1.
FIG. 1.
Cytotoxicity in HepG2 cells as assessed by loss of 3-(4,5-dimethylthiazol-2-yl)-2,5-diphenyl tetrazolium bromide bioreduction activity of cadmium telluride quantum dots (CdTe-QDs), cadmium chloride (CdCl2), and sodium tellurite (Na2TeO3)-treated cultures relative to PBS-treated controls. A, Cells were treated with different concentrations of CdTe-QD and CdCl2, at equivalent concentrations of cadmium, for 6, 12, and 24 h. The concentrations of CdTe-QDs and CdCl2 were expressed in cadmium concentrations. B, Cells were treated with different concentrations of Na2TeO3 for 6, 12, and 24 h. The concentrations of Na2TeO3 were expressed in tellurium concentrations that corresponded to the concentrations of cadmium in CdTe-QDs used in (A). Data points represent the means of 3 independent experiments done in duplicate ± standard deviations. The asterisks (*) indicate statistically significant differences compared with PBS-treated controls (P < 0.001). The number (#) sign indicates statistically significant differences of CdCl2 compared with the CdTe-QD-treated group (P < 0.05).
FIG. 2.
FIG. 2.
Transmission electron micrographs of HepG2 cells showing the effects of CdTe-QDs on mitochondrial morphology and structure. A and C, PBS-treated controls at low and high magnifications. B and D, CdTe-QD-treated cells at low and high magnifications. Abbreviations: n, nuclear; m, mitochondrion.
FIG. 3.
FIG. 3.
Fluorometric detection of CdTe-QDs in enriched mitochondrial fractions. Fluorescence intensity was measured at an excitation of 485 nm and emission of 540 nm. Each data point represents the mean ± standard deviation. The asterisks (*) indicate statistically significant differences compared with the PBS-treated controls (P < 0.05).
FIG. 4.
FIG. 4.
Confocal micrographs of HepG2 cells showing the effects on mitochondrial membrane potential induced by CdTe-QDs and CdCl2, at an equivalent concentration of cadmium, using TMRE staining. A, PBS-treated controls; B, cells treated with CdTe-QDs, which appeared as green dots/aggregates on the micrograph; C, cells treated with CdCl2; and D, cells treated with carbonylcyanide m-chlorophenylhydrazone, as the positive control.
FIG. 5.
FIG. 5.
Confocal micrographs showing intracellular Ca2+ levels in HepG2 cells detected using calcium crimson after being treated for 24 h with PBS (A), 10 µg/ml CdTe-QDs (B), and CdCl2 (C). Intracellular Ca2+ is indicated with red fluorescence. D, The total area of red fluorescence (pixels squared: px2) was analyzed with image analysis software using 3 micrographs for each sample. Each data point represents the mean ± standard deviation. The asterisks (*) indicate statistically significant differences compared with the PBS-treated controls (P < 0.05). The number (#) sign indicates statistically significant difference compared with the CdTe-QD-treated group (P < 0.05).
FIG. 6.
FIG. 6.
Effects of CdTe-QDs on cellular respiration expressed in rates of O2 consumption from isolated mitochondria. A, State 2 and state 3 respiration performed with complex I substrate, glutamate/malate. Rotenone, a complex I inhibitor, was used as the positive control. B, State 2 and state 3 respiration performed with complex II substrate, succinate. Malonate, a complex II inhibitor, was used as the positive control. Data points represent the means of 3 independent experiments ± standard deviations. The asterisks (*) indicate statistically significant differences compared with controls (P < 0.05).
FIG. 7.
FIG. 7.
Effects of CdTe-QDs on ATP content in HepG2 cells. Cells were treated with CdTe-QDs and CdCl2, at an equivalent concentration of cadmium (1 µg/ml), for 24 h. Data points represent the means of 3 independent experiments ± standard deviations. The asterisks (*) indicate statistically significant differences compared with controls (P < 0.001). The number (#) sign indicates statistically significant difference compared with the CdTe-QD-treated group (P < 0.05).
FIG. 8.
FIG. 8.
Effects of CdTe-QDs on mitochondrial electron transport chain (ETC) complexes. A, Changes in ETC complex concentrations. B, Changes in ETC complex activities. Cells were treated with CdTe-QDs and CdCl2, at an equivalent concentration of cadmium (1 µg/ml), for 24 h. Data points represent the means of 3 independent experiments ± standard deviations. The asterisks (*) indicate statistically significant differences compared with controls (P < 0.05).
FIG. 9.
FIG. 9.
Effects of CdTe-QDs on mitochondrial biogenesis expressed as changes in PGC-1α levels. Cells were treated with CdTe-QDs and CdCl2, at an equivalent concentration of cadmium (1 µg/ml), for 24 h. Data points represent the means of 3 independent experiments ± standard deviations. The asterisks (*) indicate statistically significant differences compared with controls (P < 0.05). The number (#) sign indicates statistically significant difference compared with the CdTe-QD-treated group (P < 0.05).

Similar articles

Cited by

References

    1. Acin-Perez R., Salazar E., Brosel S., Yang H., Schon E. A., Manfredi G. (2009). Modulation of mitochondrial protein phosphorylation by soluble adenylyl cyclase ameliorates cytochrome oxidase defects. EMBO Mol. Med. 1, 392–406. - PMC - PubMed
    1. Adiele R. C., Stevens D., Kamunde C. (2012). Differential inhibition of electron transport chain enzyme complexes by cadmium and calcium in isolated rainbow trout (Oncorhynchus mykiss) hepatic mitochondria. Toxicol. Sci. 127, 110–119. - PubMed
    1. Armstrong J. S. (2006). Mitochondrial membrane permeabilization: The sine qua non for cell death. Bioessays 28, 253–260. - PubMed
    1. Baratli Y., Charles A. L., Wolff V., Ben Tahar L., Smiri L., Bouitbir J., Zoll J., Piquard F., Tebourbi O., Sakly M., et al. (2013). Impact of iron oxide nanoparticles on brain, heart, lung, liver, and kidneys mitochondrial respiratory chain complexes activities and coupling. Toxicol. in vitro 27, 2142–2148. - PubMed
    1. Belyaeva E. A., Sokolova T. V., Emelyanova L. V., Zakharova I. O. (2012). Mitochondrial electron transport chain in heavy metal-induced neurotoxicity: Effects of cadmium, mercury, and copper. Scientific World Journal 2012, 136063. - PMC - PubMed

Publication types